


Today’s report: Not the result investors were looking for
The thing investors don’t want the Fed to be thinking about, is exactly the thing that has come back into the spotlight this week. Investors have been aggressively pushing for a Fed pivot towards more accommodative monetary policy, and yet, the Fed has resisted these calls.
Wake-up call
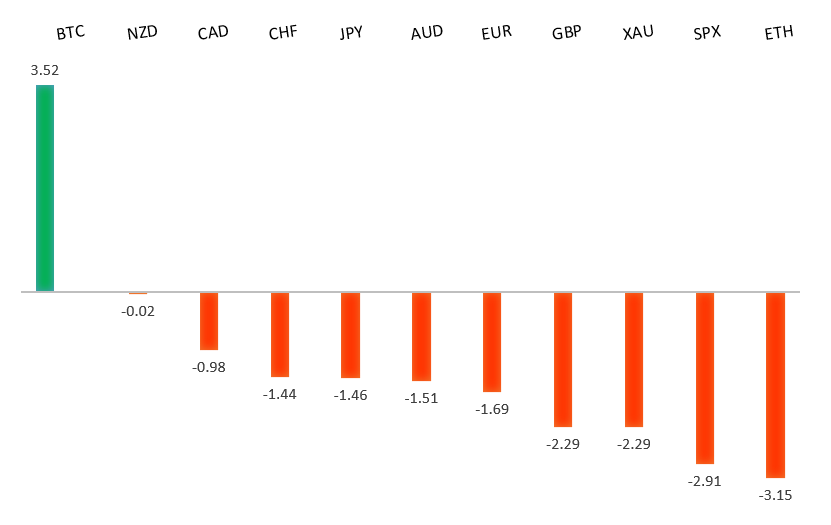
Peformance chart: 30 Day Performance vs. US dollar (%)
Suggested reading
- Gimme Less Shelter, or Inflation Won’t Fade Away, J. Authers, Bloomberg (October 13, 2023)
- Workers Never Catch Up To Inflation, C. Thies, AIER (October 11, 2023)
Chart talk: Technical & fundamental highlights
Choose pair:
EURUSD – technical overview
Any additional setbacks should be well supported on dips below 1.0500 in favor of the start to the next major upside extension. Ultimately, only a monthly close back below 1.0500 would give reason for concern. Back above 1.0618 will take the immediate pressure off the downside.EURUSD – fundamental overview
The ECB Minutes showed preference for some policymakers to maintain rates at current levels. This sentiment along with a wave of more dovish leaning ECB speak of late has factored into a decent amount of the latest round of Euro selling. Key standouts on Friday’s calendar come from Eurozone industrial production, and ECB Lagarde speech, and Michigan sentiment.EURUSD - Technical charts in detail
GBPUSD – technical overview
Signs have emerged of the market wanting to put in a longer-term base after collapsing to a record low in September 2022. The November 2022 monthly close back above 1.2000 strengthens this prospect. Any setbacks should now be well supported ahead of 1.2000. Next key resistance comes in at 1.3143.GBPUSD – fundamental overview
We've seen a downward revision to UK GDP, softer industrial production, and weak housing data. All of this comes in the face of hotter inflation out of the US, which has translated to a lot of the latest wave of selling in the Pound. Key standouts on Friday’s calendar come from Eurozone industrial production, and ECB Lagarde speech, and Michigan sentiment.USDJPY – technical overview
At this stage, it looks like the market is wanting to resume the bigger picture uptrend and head back towards a retest of that multi-year high from October 2022 up at 151.95. Look for any weakness to continue to be well supported on dips.USDJPY – fundamental overview
Yield differentials continue to widen in favor of the US Dollar, with downside pressure in the Yen picking up some more after Japan inflation data came in softer than expected earlier this week. Key standouts on Friday’s calendar come from Eurozone industrial production, and ECB Lagarde speech, and Michigan sentiment.AUDUSD – technical overview
There are signs of the potential formation of a longer-term base with the market trading down into a meaningful longer-term support zone. Only a monthly close below 0.6300 would give reason for rethink. Back above 0.6523 will take the immediate pressure off the downside and strengthen case for a bottom.AUDUSD – fundamental overview
Renewed downside pressure on commodities and stocks, along with broad based demand for the US Dollar, have been what has factored into the latest round of Australian Dollar selling. Key standouts on Friday’s calendar come from Eurozone industrial production, and ECB Lagarde speech, and Michigan sentiment.USDCAD – technical overview
Above 1.3000 signals an end to a period of longer-term bearish consolidation and suggests the market is in the process of carving out a more significant longer-term base. Next key resistance now comes in up into the 1.4000 area. Setbacks should be very well supported down into the 1.3000 area.USDCAD – fundamental overview
The Canadian Dollar has come back under pressure in the aftermath of a hot US inflation print, pullback in the price of oil, and lower stocks. Key standouts on Friday’s calendar come from Eurozone industrial production, and ECB Lagarde speech, and Michigan sentiment.NZDUSD – technical overview
Overall pressure remains on the downside with the market once again stalling out on a run up into the 0.6500 area. Ultimately, a break back above 0.6049 would be required to take the immediate pressure off the downside. A monthly close below 0.5900 would intensify bearish price action.NZDUSD – fundamental overview
The New Zealand Dollar is getting hit hard into the end of the week despite calls from RBNZ Orr for rates to be restrictive for the foreseeable future. The bigger focus has been on declining New Zealand food prices in contrast with hotter inflation data in the US and the risk off reaction. Key standouts on Friday’s calendar come from Eurozone industrial production, and ECB Lagarde speech, and Michigan sentiment.US SPX 500 – technical overview
Longer-term technical studies are in the process of unwinding from extended readings off record highs. Look for rallies to be well capped in favor of lower tops and lower lows. A monthly close back above 4600 will be required to take the immediate pressure off the downside. Next key support comes in at 4200.US SPX 500 – fundamental overview
We've finally reached a point in the cycle where the Fed recognizes unanchored inflation expectations pose a greater downside risk than over-tightening. This is significant, as it means less investor friendly monetary policy, especially with the growth outlook looking up in recent months. Overall, we expect inflation to continue to be a problem in 2023 that results in downside pressure into rallies despite market expectations that would argue otherwise.GOLD (SPOT) – technical overview
The 2019 breakout above the 2016 high at 1375 was a significant development, opening the door for fresh record highs. Setbacks should now be well supported above 1600 on a monthly close basis ahead of the next major upside extension. Next major resistance comes in at 2100, above which opens the next extension towards 2500.GOLD (SPOT) – fundamental overview
The yellow metal continues to be well supported on dips with solid demand from medium and longer-term accounts. These players are more concerned about inflation risk and a less upbeat global growth outlook. All of this should keep the commodity well supported, with many market participants also fleeing to the hard asset as the grand dichotomy of record high equities and record low yields comes to an unnerving climax.