


Today’s report: Does the market have tunnel vision?
We often highlight the fact that the market has an amazing ability to focus in on what it wants to focus in on, while dismissing anything that might call its views into question. This week, the market has chosen to feel good about a number of things.
Wake-up call
- ECB Minutes
- PMI reads
- Yield differentials
- upbeat sentiment
- retail sales
- retail sales
- policy outlook
- Macro themes
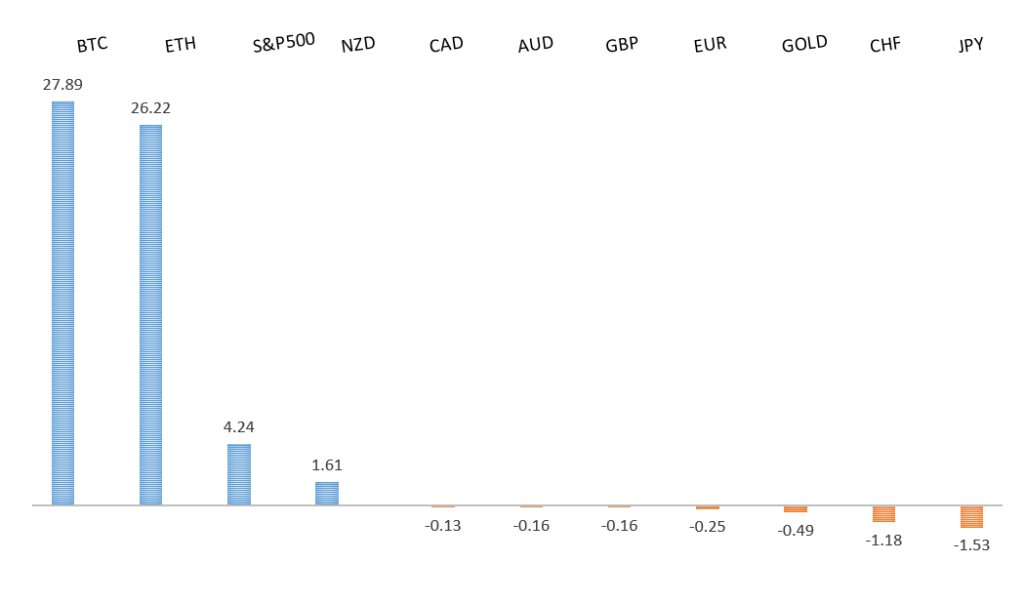
Peformance chart: 30-Day Performance vs. US dollar (%)
Suggested reading
- Should Oil and Gas Reserves Remain Untapped?, M. McCormick, Financial Times (February 22, 2024)
- A Top Contrarian Investment Idea for 2024, S. Dziubinski, Morningstar (February 21, 2024)
Chart talk: Technical & fundamental highlights
Choose pair:
EURUSD – technical overview
The Euro has been in a multi-month consolidation since bottoming out in 2022. Setbacks have since been exceptionally well supported on dips below 1.0500, with a higher platform sought out ahead of the next major upside extension. Look for a push through the 2023 high at 1.1276 to strengthen the constructive outlook and extend the recovery run towards 1.2000. Only back below 1.0400 negates.EURUSD – fundamental overview
The latest round of economic data out of the Eurozone in the form of PMI reads has come in better than expected on the whole. Meanwhile, we've just come out of a session of relatively hawkish ECB speak and a more hawkish leaning ECB Minutes. All of this has helped to keep the single currency propped up into the end of the week. Key standouts on Friday’s calendar come from German GDP and Ifo reads, ECB speak, and Eurozone consumer inflation expectations.EURUSD - Technical charts in detail
GBPUSD – technical overview
Signs have emerged of the market wanting to put in a longer-term base after collapsing to a record low in September 2022. The November 2022 monthly close back above 1.2000 strengthens this prospect. Any setbacks should now be well supported ahead of 1.2000. Next key resistance comes in at 1.2849.GBPUSD – fundamental overview
The Pound was back to trading with a bid tone on Thursday after a round of UK PMI reads came in on the better side of expectation. Key standouts on Friday’s calendar come from German GDP and Ifo reads, ECB speak, and Eurozone consumer inflation expectations.USDJPY – technical overview
The market remains confined to a strong uptrend, with sights set on a retest and break of the multi-year high from 2022 at 151.95. A push through this level will open the next major upside extension towards 155.00. Key support comes in at 145.90, with only a weekly close below to delay the constructive outlook.USDJPY – fundamental overview
The combination of weaker PMI data out of Japan and yield differentials that continue to move in favor of the Buck, is a combination that keeps pushing the Yen towards its lowest levels in years. Key standouts on Friday’s calendar come from German GDP and Ifo reads, ECB speak, and Eurozone consumer inflation expectations.AUDUSD – technical overview
There are signs of the potential formation of a longer-term base with the market trading down into a meaningful longer-term support zone. Only a monthly close below 0.6200 would give reason for rethink. Back above 0.6900 will take the big picture pressure off the downside and strengthen case for a bottom.AUDUSD – fundamental overview
The Australian Dollar has held up well into the end of the week despite the dump in Aussie manufacturing PMIs. It's clear the upbeat global sentiment and record high US equities are playing their part in keeping Aussie bid. Key standouts on Friday’s calendar come from German GDP and Ifo reads, ECB speak, and Eurozone consumer inflation expectations.USDCAD – technical overview
Above 1.3000 signals an end to a period of longer-term bearish consolidation and suggests the market is in the process of carving out a more significant longer-term base. Next key resistance now comes in up into the 1.4000 area. Setbacks should be very well supported down into the 1.3000 area.USDCAD – fundamental overview
Canada retail sales came in much stronger than expected on Thursday, while the price of oil remained bid. This helped to put the Canadian Dollar in the win column on the day. Key standouts on Friday’s calendar come from German GDP and Ifo reads, ECB speak, and Eurozone consumer inflation expectations.NZDUSD – technical overview
Overall pressure remains on the downside with the market continuing to stall out on runs up into the 0.6500 area. At the same time, there are some signs of the market wanting to put in a longer-term base. Ultimately, a break back above 0.6500 would be required to take the medium-term pressure off the downside and encourage this prospect. A monthly close below 0.5800 will intensify bearish price action.NZDUSD – fundamental overview
The risk correlated New Zealand Dollar has done a good job shrugging off an unimpressive New Zealand retail sales report that came in much softer than forecast. Clearly the upbeat global sentiment and record high US equities has been a factor. Key standouts on Friday’s calendar come from German GDP and Ifo reads, ECB speak, and Eurozone consumer inflation expectations.US SPX 500 – technical overview
Longer-term technical studies continue to look quite extended after pushing to fresh record highs, begging for a deeper correction ahead. Look for rallies to be well capped in favor of lower tops and lower lows. A monthly close above 5000 will be required to delay the outlook. Next key support comes in at 4842.US SPX 500 – fundamental overview
Though we have seen an adjustment of investor expectations towards the amount of rate cuts in 2024, the market still believes policy will end up erring more towards the investor friendly, accommodative side of things. This bet has kept stocks well bid and pushing record highs. Still, it's important to highlight the fact that the Fed has yet to declare a victory over inflation and could disappoint investors with less accommodative policy than desired going forward. If this happens, stocks could be in for a nasty bearish reversal.GOLD (SPOT) – technical overview
The 2019 breakout above the 2016 high at 1375 was a significant development, opening the door for fresh record highs. Setbacks should now be well supported above 1900 on a monthly close basis ahead of the next major upside extension towards 2500.GOLD (SPOT) – fundamental overview
The yellow metal continues to be well supported on dips with solid demand from medium and longer-term accounts. These players are more concerned about inflation risk and a less stable and upbeat global growth outlook. All of this should keep the commodity well supported, with many market participants also fleeing to the hard asset as the grand dichotomy of record high equities and record low yields comes to an end.