


Next 24 hours: ECB speak helps to boost Euro
Today’s report: More adjustments to Fed rate cut bets
The market has been trading with some caution as the new week gets going. US equity futures are off a bit and the US Dollar is broadly bid. As far as US rate expectations go, the OIS market is now pricing a cumulative 82 basis points of rate cuts in 2024.
Wake-up call
- ECB officials
- consumer confidence
- PPI services
- sentiment shift
- Oil retreat
- retail sales
- policy outlook
- Macro themes
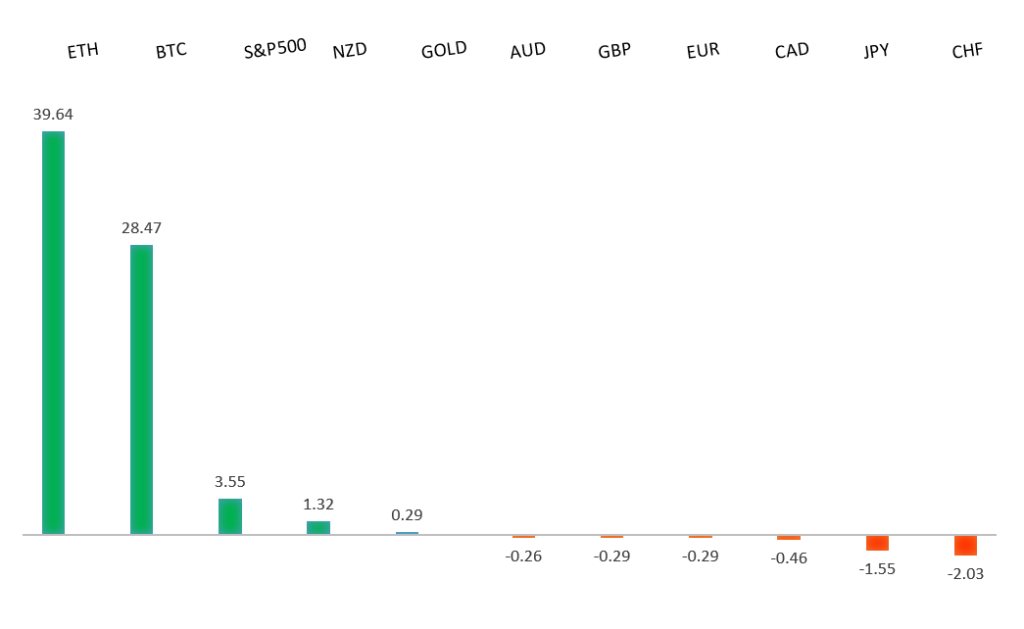
Peformance chart: 30-Day Performance vs. US dollar (%)
Suggested reading
- All-Time Highs Are Historically Bullish, B. Ritholtz, The Big Picture (February 22, 2024)
- How to Use Macroeconomics In Investing, C. Roche, Discipline Funds (February 21, 2024)
Chart talk: Technical & fundamental highlights
Choose pair:
EURUSD – technical overview
The Euro has been in a multi-month consolidation since bottoming out in 2022. Setbacks have since been exceptionally well supported on dips below 1.0500, with a higher platform sought out ahead of the next major upside extension. Look for a push through the 2023 high at 1.1276 to strengthen the constructive outlook and extend the recovery run towards 1.2000. Only back below 1.0400 negates.EURUSD – fundamental overview
We're coming out of a Friday session in which the key takeaway was a flurry of ECB speak that for the most part was sending a message that rate cuts aren't happening any time soon. Meanwhile, on the data front, 1 year ECB inflation expectations nudged up. Key standouts on Monday’s calendar come from UK CBI trades, BOE speak, Canada manufacturing sales, US new home sales, Dallas Fed manufacturing, and US building permits.EURUSD - Technical charts in detail
GBPUSD – technical overview
Signs have emerged of the market wanting to put in a longer-term base after collapsing to a record low in September 2022. The November 2022 monthly close back above 1.2000 strengthens this prospect. Any setbacks should now be well supported ahead of 1.2000. Next key resistance comes in at 1.2849.GBPUSD – fundamental overview
UK Gfk consumer confidence slid to -21 from -19 in January, also coming in below forecast. Nevertheless, the Pound was able to hold up on broader US Dollar outflows. Key standouts on Monday’s calendar come from UK CBI trades, BOE speak, Canada manufacturing sales, US new home sales, Dallas Fed manufacturing, and US building permits.USDJPY – technical overview
The market remains confined to a strong uptrend, with sights set on a retest and break of the multi-year high from 2022 at 151.95. A push through this level will open the next major upside extension towards 155.00. Key support comes in at 145.90, with only a weekly close below to delay the constructive outlook.USDJPY – fundamental overview
Japan's PPI services for January came out softer than expected. The market will now look ahead to Japan's national CPI data for January due early Tuesday. Overall, the Yen has been weak on the very clear yield differential advantage to the US Dollar. Key standouts on Monday’s calendar come from UK CBI trades, BOE speak, Canada manufacturing sales, US new home sales, Dallas Fed manufacturing, and US building permits.AUDUSD – technical overview
There are signs of the potential formation of a longer-term base with the market trading down into a meaningful longer-term support zone. Only a monthly close below 0.6200 would give reason for rethink. Back above 0.6900 will take the big picture pressure off the downside and strengthen case for a bottom.AUDUSD – fundamental overview
The Australian Dollar could be feeling last week's dump in Aussie manufacturing PMIs a little more as the week gets going. Risk sentiment has turned lower, while the US Dollar is broadly bid. Key standouts on Monday’s calendar come from UK CBI trades, BOE speak, Canada manufacturing sales, US new home sales, Dallas Fed manufacturing, and US building permits.USDCAD – technical overview
Above 1.3000 signals an end to a period of longer-term bearish consolidation and suggests the market is in the process of carving out a more significant longer-term base. Next key resistance now comes in up into the 1.4000 area. Setbacks should be very well supported down into the 1.3000 area.USDCAD – fundamental overview
Friday's end of day retreat in US equities combined with bearish price action in the price of oil were behind the latest wave of selling in the Canadian Dollar. Key standouts on Monday’s calendar come from UK CBI trades, BOE speak, Canada manufacturing sales, US new home sales, Dallas Fed manufacturing, and US building permits.NZDUSD – technical overview
Overall pressure remains on the downside with the market continuing to stall out on runs up into the 0.6500 area. At the same time, there are some signs of the market wanting to put in a longer-term base. Ultimately, a break back above 0.6500 would be required to take the medium-term pressure off the downside and encourage this prospect. A monthly close below 0.5800 will intensify bearish price action.NZDUSD – fundamental overview
The New Zealand Dollar has been feeling the downside pressure from last week's discouraging Kiwi retail sales number and some downbeat global sentiment as the new week gets going. We also recently heard from New Zealand Finance Minister Willis who said returning the budget to surplus by 2027 was going to be challenging. Key standouts on Monday’s calendar come from UK CBI trades, BOE speak, Canada manufacturing sales, US new home sales, Dallas Fed manufacturing, and US building permits.US SPX 500 – technical overview
Longer-term technical studies continue to look quite extended after pushing to fresh record highs, begging for a deeper correction ahead. Look for rallies to be well capped in favor of lower tops and lower lows. A monthly close above 5000 will be required to delay the outlook. Next key support comes in at 4842.US SPX 500 – fundamental overview
Though we have seen an adjustment of investor expectations towards the amount of rate cuts in 2024, the market still believes policy will end up erring more towards the investor friendly, accommodative side of things. This bet has kept stocks well bid and pushing record highs. Still, it's important to highlight the fact that the Fed has yet to declare a victory over inflation and could disappoint investors with less accommodative policy than desired going forward. If this happens, stocks could be in for a nasty bearish reversal.GOLD (SPOT) – technical overview
The 2019 breakout above the 2016 high at 1375 was a significant development, opening the door for fresh record highs. Setbacks should now be well supported above 1900 on a monthly close basis ahead of the next major upside extension towards 2500.GOLD (SPOT) – fundamental overview
The yellow metal continues to be well supported on dips with solid demand from medium and longer-term accounts. These players are more concerned about inflation risk and a less stable and upbeat global growth outlook. All of this should keep the commodity well supported, with many market participants also fleeing to the hard asset as the grand dichotomy of record high equities and record low yields comes to an end.