


Today’s report: Serious risks to consider into the weekend
On Thursday, we highlighted the fact that investors are desperate to use anything to justify the Fed needing to get back to moving to more rate cuts than less in 2024. And on Thursday, as per our commentary, US producer prices were all of a sudden that big deal economic data that normally isn’t a big deal.
Wake-up call
- dovish hold
- BOE Greene
- Intervention chatter
- stocks rebound
- oil slide
- soft data
- Inflation risk
- Macro themes
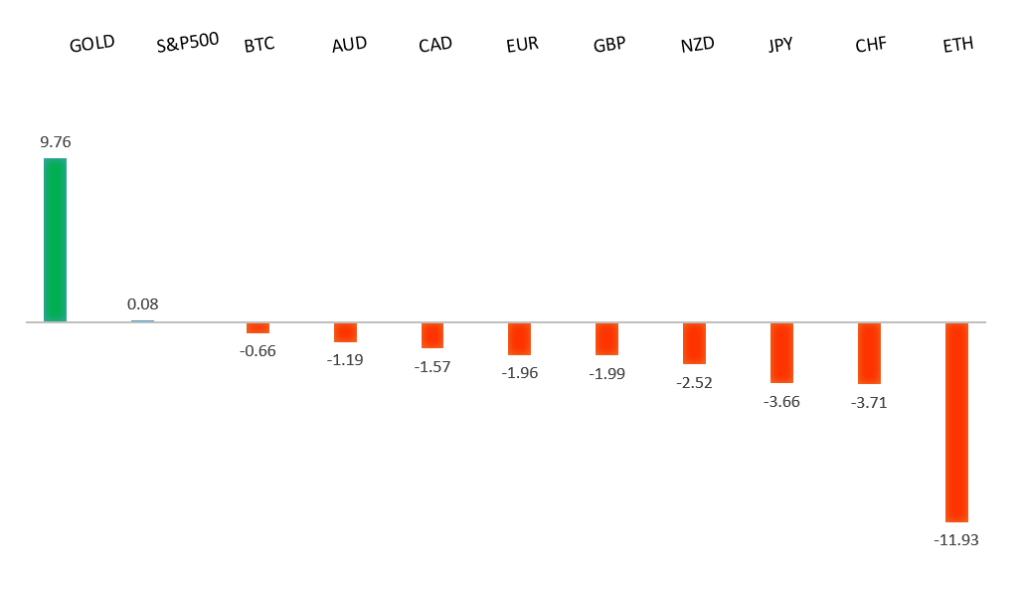
Peformance chart: 30-Day Performance vs. US dollar (%)
Suggested reading
- Spending More, Enjoying It Less?, R. Moody, Regions Bank (April, 2024)
- Augusta National's Most Interesting Details, J. Pompliano, Huddle Up (April 11, 2024)
Chart talk: Technical & fundamental highlights
Choose pair:
EURUSD – technical overview
The Euro has been in a multi-month consolidation since bottoming out in 2022. Setbacks have since been exceptionally well supported on dips below 1.0500, with a higher platform sought out ahead of the next major upside extension. Look for a push through the 2023 high at 1.1276 to strengthen the constructive outlook and extend the recovery run towards 1.2000. Only back below 1.0400 negates.EURUSD – fundamental overview
The ECB left rates on hold as widely expected, but the communication leaned more dovish after it was revealed there was a deeper sense of urgency to be looking to cut rates. Odds for a June cut have now risen to about 90%. The Euro has come under more pressure as a consequence. Key standouts on Friday’s calendar come from German inflation, UK GDP, industrial production, trade, and construction output, US trade, Michigan sentiment, and central bank speak.EURUSD - Technical charts in detail
GBPUSD – technical overview
Signs have emerged of the market wanting to put in a longer-term base after collapsing to a record low in September 2022. The latest push to a fresh 2024 high beyond 1.2830 confirms the outlook and opens the door for the next major upside extension towards the 2023 high at 1.3143. Any setbacks should now be well supported ahead of 1.2500.GBPUSD – fundamental overview
The Pound has held up relatively well into the end of the week when considering just how hard currencies have been hit against the Buck. A lot of the recent support for the Pound is said to be coming from sizable demand in the 1.2500 area and hawkish comments from BOE Greene who has warned against cutting rates too soon. The local rates market is pricing in less than two BOE cuts for 2024, down from nearly three cuts earlier this week. Key standouts on Friday’s calendar come from German inflation, UK GDP, industrial production, trade, and construction output, US trade, Michigan sentiment, and central bank speak.USDJPY – technical overview
The market remains confined to a strong uptrend, most recently pushing through the multi-year high from 2022 at 151.95. This now opens the next major upside extension towards 155.00. Key support comes in at 150.00, with only a weekly close below to delay the constructive outlook.USDJPY – fundamental overview
The Yen has slid to a 34 year low against the Buck after US inflation data came in hotter than expected this week, forcing a healthy further repricing of Fed expectations. The chatter making the rounds now is that there won't be any intervention until USDJPY 155.00. Key standouts on Friday’s calendar come from German inflation, UK GDP, industrial production, trade, and construction output, US trade, Michigan sentiment, and central bank speak.AUDUSD – technical overview
There are signs of the potential formation of a longer-term base with the market trading down into a meaningful longer-term support zone. Only a monthly close below 0.6200 would give reason for rethink. Back above 0.6900 will take the big picture pressure off the downside and strengthen case for a bottom.AUDUSD – fundamental overview
Slightly cooler US producer prices and a recovering US equity market were the primary drivers behind the latest mild recovery in the Australian Dollar. Key standouts on Friday’s calendar come from German inflation, UK GDP, industrial production, trade, and construction output, US trade, Michigan sentiment, and central bank speak.USDCAD – technical overview
Above 1.3000 signals an end to a period of longer-term bearish consolidation and suggests the market is in the process of carving out a more significant longer-term base. Next key resistance now comes in up into the 1.4000 area. Setbacks should be very well supported down into the 1.3000 area.USDCAD – fundamental overview
Recent economic data out of Canada has been less encouraging and odds for rate cuts from the Bank of Canada have ramped up. This in conjunction with the latest slide in oil and broad based US Dollar demand have contributed to the Canadian Dollar's slide to fresh yearly lows against the Buck. Key standouts on Friday’s calendar come from German inflation, UK GDP, industrial production, trade, and construction output, US trade, Michigan sentiment, and central bank speak.NZDUSD – technical overview
Overall pressure remains on the downside with the market continuing to stall out on runs up into the 0.6500 area. At the same time, there are some signs of the market wanting to put in a longer-term base. Ultimately, a break back above 0.6500 would be required to take the medium-term pressure off the downside and encourage this prospect. A monthly close below 0.5800 will intensify bearish price action.NZDUSD – fundamental overview
Slightly cooler US producer prices and a recovering US equity market were the primary drivers behind the latest mild recovery in the New Zealand Dollar. However, softer Kiwi data in the form of business PMIs and credit card sales, have weighed on the currency into rallies. Key standouts on Friday’s calendar come from German inflation, UK GDP, industrial production, trade, and construction output, US trade, Michigan sentiment, and central bank speak.US SPX 500 – technical overview
Longer-term technical studies continue to look quite extended after pushing to fresh record highs, begging for a deeper correction ahead. Look for rallies to be well capped in favor of lower tops and lower lows. Next key support comes in at 5110.US SPX 500 – fundamental overview
Though we have seen an adjustment of investor expectations towards the amount of rate cuts in 2024, the market still believes policy will end up erring more towards the investor friendly, accommodative side of things. This bet has kept stocks well bid and pushing record highs. Still, it's important to highlight the fact that the Fed has yet to declare a victory over inflation and could disappoint investors with less accommodative policy than desired going forward. If this happens, stocks could be in for a nasty bearish reversal.GOLD (SPOT) – technical overview
The 2019 breakout above the 2016 high at 1375 was a significant development, opening the door for fresh record highs. Setbacks should now be well supported above 1900 on a monthly close basis ahead of the next major upside extension towards 2500.GOLD (SPOT) – fundamental overview
The yellow metal continues to be well supported on dips with solid demand from medium and longer-term accounts. These players are more concerned about inflation risk and a less upbeat global growth outlook. All of this should keep the commodity well supported, with many market participants also fleeing to the hard asset as the grand dichotomy of record high equities and record low yields comes to an end.