


Next 24 hours: Investors will keep focusing on reduced geopolitical risk
Today’s report: Things could have been a lot worse over the weekend
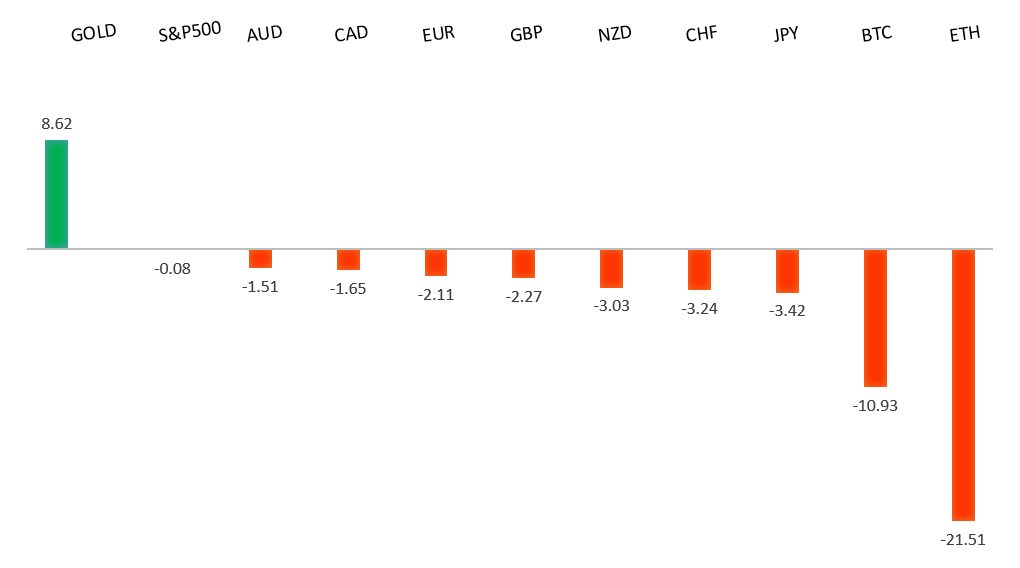
The run of Dollar demand has resulted in fresh yearly highs against many currencies. We had already seen a wave of Dollar demand on the back of a repricing of Fed rate expectations, and in recent days, geopolitical factors have played into even more Dollar demand.
Wake-up call
- Rate repricing
- GDP slowdown
- Intervention chatter
- geopolitical risk
- oil slide
- business PMI
- Inflation risk
- Macro themes
Peformance chart: 30-Day Performance vs. US dollar (%)
Suggested reading
- The Bond Crash Continues, JC, Parets, All Star Charts (April 11, 2024)
- US-China Trade May Have Hit a Bottom, Political Calculations (April 10, 2024)
Chart talk: Technical & fundamental highlights
Choose pair:
EURUSD – technical overview
The Euro has been in a multi-month consolidation since bottoming out in 2022. Setbacks have since been exceptionally well supported on dips below 1.0500, with a higher platform sought out ahead of the next major upside extension. Look for a push through the 2023 high at 1.1276 to strengthen the constructive outlook and extend the recovery run towards 1.2000. Only back below 1.0400 negates.EURUSD – fundamental overview
The strong possibility the ECB will now move to a cut before the Fed has sent the Euro into a free fall to a fresh yearly low. We've also seen added downside pressure on a broad based flight to safety into the US Dollar amidst escalating geopolitical tension. Key standouts on Monday’s calendar come from Eurozone industrial production, Canada manufacturing and wholesale sales, US retail sales, NY empire manufacturing, business inventories, and NAHB housing.EURUSD - Technical charts in detail
GBPUSD – technical overview
Signs have emerged of the market wanting to put in a longer-term base after collapsing to a record low in September 2022. The latest push to a fresh 2024 high beyond 1.2830 confirms the outlook and opens the door for the next major upside extension towards the 2023 high at 1.3143. Any setbacks should now be well supported ahead of 1.2000.GBPUSD – fundamental overview
The Pound has sunk to a fresh yearly low against the Buck on broad based US Dollar demand and softer economic data highlighted by a slowing of UK GDP. Key standouts on Monday’s calendar come from Eurozone industrial production, Canada manufacturing and wholesale sales, US retail sales, NY empire manufacturing, business inventories, and NAHB housing.USDJPY – technical overview
The market remains confined to a strong uptrend, most recently pushing through the multi-year high from 2022 at 151.95. This now opens the next major upside extension towards 155.00. Key support comes in at 150.00, with only a weekly close below to delay the constructive outlook.USDJPY – fundamental overview
The ongoing chatter that the MOF is willing to let the USDJPY rate push to 155.00 before intervening has been the fuel that has kept this major pair extending its run of multi-year gains. We're also coming out of another wave of broad based Dollar demand on the escalation in geopolitical tension over the weekend. Key standouts on Monday’s calendar come from Eurozone industrial production, Canada manufacturing and wholesale sales, US retail sales, NY empire manufacturing, business inventories, and NAHB housing.AUDUSD – technical overview
There are signs of the potential formation of a longer-term base with the market trading down into a meaningful longer-term support zone. Only a monthly close below 0.6200 would give reason for rethink. Back above 0.6900 will take the big picture pressure off the downside and strengthen case for a bottom.AUDUSD – fundamental overview
The Australian Dollar was under a good deal of pressure into the weekend on the escalation in geopolitical tension, but has since been finding some demand early Monday as the market is somewhat relieved to see things looking better than what could have been. Key standouts on Monday’s calendar come from Eurozone industrial production, Canada manufacturing and wholesale sales, US retail sales, NY empire manufacturing, business inventories, and NAHB housing.USDCAD – technical overview
Above 1.3000 signals an end to a period of longer-term bearish consolidation and suggests the market is in the process of carving out a more significant longer-term base. Next key resistance now comes in up into the 1.4000 area. Setbacks should be very well supported down into the 1.3000 area.USDCAD – fundamental overview
Recent economic data out of Canada has been less encouraging and odds for rate cuts from the Bank of Canada have ramped up. This in conjunction with the latest slide in oil and broad based US Dollar demand have contributed to the Canadian Dollar's slide to fresh yearly lows against the Buck. Key standouts on Monday’s calendar come from Eurozone industrial production, Canada manufacturing and wholesale sales, US retail sales, NY empire manufacturing, business inventories, and NAHB housing.NZDUSD – technical overview
Overall pressure remains on the downside with the market continuing to stall out on runs up into the 0.6500 area. At the same time, there are some signs of the market wanting to put in a longer-term base. Ultimately, a break back above 0.6500 would be required to take the medium-term pressure off the downside and encourage this prospect. A monthly close below 0.5800 will intensify bearish price action.NZDUSD – fundamental overview
The New Zealand Dollar has managed to find some support into the latest dip to a fresh yearly low, mostly on relief things didn't get worse than what many had feared in the Middle East over the weekend. Still, Kiwi is lagging relative to its Aussie cousin given the weak March business PSI reading. Key standouts on Monday’s calendar come from Eurozone industrial production, Canada manufacturing and wholesale sales, US retail sales, NY empire manufacturing, business inventories, and NAHB housing.US SPX 500 – technical overview
Longer-term technical studies continue to look quite extended after pushing to fresh record highs, begging for a deeper correction ahead. Look for rallies to be well capped in favor of lower tops and lower lows. Next key support comes in at 5110.US SPX 500 – fundamental overview
Though we have seen an adjustment of investor expectations towards the amount of rate cuts in 2024, the market still believes policy will end up erring more towards the investor friendly, accommodative side of things. This bet has kept stocks well bid and pushing record highs. Still, it's important to highlight the fact that the Fed has yet to declare a victory over inflation and could disappoint investors with less accommodative policy than desired going forward. If this happens, stocks could be in for a nasty bearish reversal.GOLD (SPOT) – technical overview
The 2019 breakout above the 2016 high at 1375 was a significant development, opening the door for fresh record highs. Setbacks should now be well supported above 1900 on a monthly close basis ahead of the next major upside extension towards 2500.GOLD (SPOT) – fundamental overview
The yellow metal continues to be well supported on dips with solid demand from medium and longer-term accounts. These players are more concerned about inflation risk and a less upbeat global growth outlook. All of this should keep the commodity well supported, with many market participants also fleeing to the hard asset as the grand dichotomy of record high equities and record low yields comes to an end.