


Today’s report: Profit taking kicking in on Friday
There’s a tinge of risk off flow into Friday, perhaps somewhat and understandably overdue after the run of record highs that we saw this week in US equities. But at the moment, the market could also be feeling a little less confident after a batch of China data underwhelmed.
Wake-up call
- German inflation
- Gilt yields
- Mixed bag
- SNB policy
- Aussie-China tensions
- first-tier data
- asset purchases
- Stocks vulnerable
- Dealers report
- Bigger money
- risk appetite
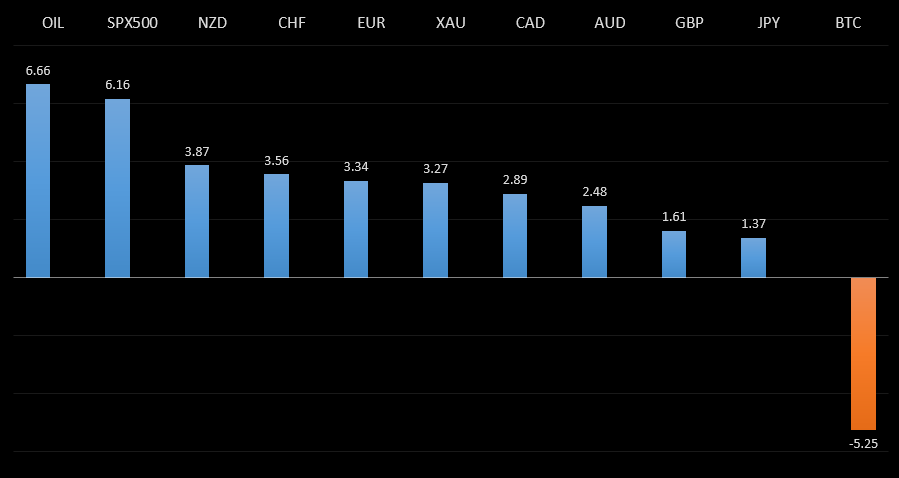
Peformance chart: 30 Day Performance vs. US dollar (%)
Suggested reading
- Hot Earnings Engine Can’t Propel Stocks Forever, N. Kaissar, Bloomberg (April 30, 2021)
- 50 Innovative Technology Leaders, M. Giles, Forbes (April 29, 2021)
Chart talk: Technical & fundamental highlights
Choose pair:
EURUSD – technical overview
The market has been looking for a higher low since topping out in 2021 up at 1.2350. Ideally, this next higher low is sought out ahead of 1.1600 in favour of the next major upside extension back through 1.2350 and towards a retest of the 2018 high at 1.2555 further up.EURUSD – fundamental overview
German inflation data came in hotter than expected on Thursday, though the Euro ultimately traded flat on the day. Key standouts on today’s calendar include German and Eurozone GDP, Eurozone inflation, Canada GDP, Canada inflation, US personal income and spending, US core PCE, Chicago PMIs, and Michigan sentiment.EURUSD - Technical charts in detail
GBPUSD – technical overview
Technical studies are in the process of unwinding from stretched levels after the push to fresh multi-month highs. This leaves room for additional consolidation, before the market considers a meaningful bullish continuation towards a retest of the 2018 high. But look for setbacks to now be very well supported into the 1.3500 area.GBPUSD – fundamental overview
Some relative outperformance in the Pound on Thursday as Gilt yields outpaced Europe. Key standouts on today’s calendar include German and Eurozone GDP, Eurozone inflation, Canada GDP, Canada inflation, US personal income and spending, US core PCE, Chicago PMIs, and Michigan sentiment.USDJPY – technical overview
The major pair has run into massive resistance in the form of the monthly Ichimoku cloud, and has since rolled back over below the cloud. This translates to a longer-term trend that is still bearish despite the run up we saw in 2021, with risk for deeper setbacks ahead. It would take a clear break back above 113.00 to negate the outlook.USDJPY – fundamental overview
Asa per the usual, Japan economic data has taken a backseat to bigger picture flow. Overall, data was mixed with the jobless rate falling, CPI softer, and industrial production rebounding. The Yen has been mostly sold this week on the back of the dovish Fed and ongoing demand for US equities. Key standouts on today’s calendar include German and Eurozone GDP, Eurozone inflation, Canada GDP, Canada inflation, US personal income and spending, US core PCE, Chicago PMIs, and Michigan sentiment.EURCHF – technical overview
Lots of sideways price action here, with no clear directional insight. For the most part, price action has been confined between 1.0600 and 1.1200, and it will take a weekly close above or below for an indication of the next big move.EURCHF – fundamental overview
The SNB remains uncomfortable with Franc appreciation and continues to remind the market it will need to be careful about any attempts at trying to force an appreciation in the currency. But the SNB will also need to be careful right now, as its strategy to weaken the Franc is facing headwinds from a less certain global outlook. Any signs of renewed risk liquidation will likely invite a very large wave of demand for the Franc that will put the SNB in the more challenging position of needing to back up its talk with action, that ultimately, may not prove to be as effective as it once was, given where we're at in the monetary policy cycle.AUDUSD – technical overview
Technical studies have turned up in recent months, after the market traded down to its lowest levels since 2003 in 2020. There is evidence of a longer-term bottom following the latest push back through 0.7000, though at this stage, there is risk for a deeper pullback to allow for shorter term studies to unwind. Setbacks should now be well supported ahead of 0.7400.AUDUSD – fundamental overview
Some weakness in Aussie into Friday as tensions between China and Australia remain elevated. China's ambassador to Australia Cheng Jingye has blamed Canberra for deteriorating bilateral ties, accusing Australia of economic coercion and provocations. Also seen weighing a bit has been underwhelming data out of China. Key standouts on today’s calendar include German and Eurozone GDP, Eurozone inflation, Canada GDP, Canada inflation, US personal income and spending, US core PCE, Chicago PMIs, and Michigan sentiment.USDCAD – technical overview
Has been in major decline since topping out in 2021 above 1.4600. At this stage, with the decline now well extended, the market is likely to find solid support into the 1.2200-1.2400 area ahead of a resumption of gains. Ultimately, only a weekly close below 1.2200 would suggest otherwise. Back above 1.2655 will strengthen the outlook.USDCAD – fundamental overview
Last week's hawkish Bank of Canada, rallying commodities prices, a dovish Fed, strong Canada economic data and record high US stocks have all helped to drive the Canadian Dollar higher. Key standouts on today’s calendar include German and Eurozone GDP, Eurozone inflation, Canada GDP, Canada inflation, US personal income and spending, US core PCE, Chicago PMIs, and Michigan sentiment.NZDUSD – technical overview
Finally signs of topping out after a nice multi-month rally. Look for a weekly close below 0.7000 to strengthen the bearish outlook and expose deeper setbacks towards the 0.6500 area. Back above 0.7315 would be required to take the immediate pressure off the downside.NZDUSD – fundamental overview
Today's RBNZ QE operation was met with heavy offers, with investors seemingly bracing for the RBNZ to further taper their QE purchases. Still, the RBNZ sprung a surprise by keeping QE purchases unchanged next week at NZD 350 million, ending 2 straight weeks of tapering. New Zealand's ANZ consumer confidence rebounded and has returned to pre-pandemic levels. Key standouts on today’s calendar include German and Eurozone GDP, Eurozone inflation, Canada GDP, Canada inflation, US personal income and spending, US core PCE, Chicago PMIs, and Michigan sentiment.US SPX 500 – technical overview
Longer-term technical studies are looking quite exhausted and the market is showing signs of wanting to roll over after racing to another record high. Look for rallies to be well capped above of 4200, with a break back below 4000 to strengthen the outlook.US SPX 500 – fundamental overview
We're trading just off fresh record highs, and yet, with so little room for additional central bank accommodation, given an already depressed interest rate environment, the prospect for sustainable runs to the topside on easy money policy incentives and government stimulus, should no longer be as enticing to investors. Meanwhile, ongoing worry associated with coronavirus fallout should weigh more heavily on investor sentiment into the second half of 2021.GOLD (SPOT) – technical overview
The 2019 breakout above the 2016 high at 1375 was a significant development, opening the door for fresh record highs and an acceleration beyond the next major psychological barrier at 2000. Setbacks should now be well supported above 1600. Longer-term technical studies are however in the process of unwinding, with the market in search of a higher low ahead of a bullish continuation.GOLD (SPOT) – fundamental overview
The yellow metal continues to be well supported on dips with solid demand from medium and longer-term accounts. These players are more concerned about exhausted monetary policy, extended global equities, and coronavirus fallout. All of this should keep the commodity well supported, with many market participants also fleeing to the hard asset as the grand dichotomy of record high equities and record low yields comes to an unnerving climax.BTCUSD – technical overview
Monthly technical readings are still tracking in severe overbought territory heading into Q2 2021. Risk for any meaningful bullish continuation beyond the recent record high at $64,900 should be limited over the coming days and weeks, with the higher probability leaning towards more correction and consolidation. There is now room for the correction to extend back down into the $40,000 area, where a higher low would ideally be sought out for a resumption of the bigger picture uptrend.BTCUSD – fundamental overview
Heading into 2021, there was a great anticipation for institutional adoption. And as we saw follow through on this anticipation, the bitcoin price tripled in value, exploding to a record high beyond $60,000. But with much of that now priced into the market, and with short-term bitcoin fundamentals still correlating with global risk sentiment, there does appear to be room for somewhat of an adjustment lower in the price before we see that next wave of renewed demand. We also believe bitcoin's emergence into the mainstream will invite more challenge and scrutiny from central banks and governments, which could translate to a bumpy ride in Q2 2021 before the asset once again finds its legs on the compelling longer-term value proposition.BTCUSD - Technical charts in detail
ETHUSD – technical overview
Despite the latest run to a fresh record high through $2,500, the market is looking quite extended following a massive run higher in 2021. At this stage, additional upside should be limited to allow for extended studies to unwind, before the market considers a meaningful bullish continuation. Look for setbacks to be well supported ahead of $1,500.ETHUSD – fundamental overview
Ether is getting closer and closer to entering a phase of meaningful correction and consolidation after an explosive start to 2021 that has resulted in fresh record highs beyond $2,500. There are already signs of overvaluation in the defi space and this in conjunction with an anticipated deterioration in global risk sentiment are been behind a lot of the reasoning for the anticipated downside pressure. Still, we believe there will be plenty of demand for ether down into the $1,500 area.