


Next 24 hours: Dollar slammed, US stocks back towards record highs
Today’s report: Go figure
Things have really been turning around, at least as far as price action is concerned. We still think the fundamentals are highly concerning and are still super skeptical about this latest run up in risk assets.
Wake-up call
- construction output
- BOE Bailey
- Policy divergence
- RBA Minutes
- soft data
- 50bp chatter
- Stocks vulnerable
- Dealers report
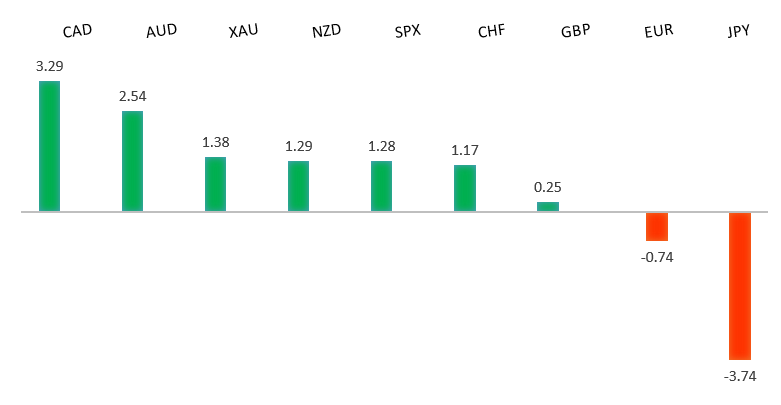
Peformance chart: 30 Day Performance vs. US dollar (%)
Suggested reading
- Markets Start to Bow to the Inflation Reality, J. Authers, Bloomberg (October 19, 2021)
- Is China's Economic Model Broken?, J. Kynge, Financial Post (October 15, 2021)
Chart talk: Technical & fundamental highlights
Choose pair:
EURUSD – technical overview
The market has been looking for a higher low since topping out in 2021 up at 1.2350. Ideally, setbacks continue to be well supported above 1.1500 on a weekly close basis in favour of the next major upside extension back through 1.2350 and towards a retest of the 2018 high at 1.2555 further up. Only a weekly close below 1.1500 would force a rethink.EURUSD – fundamental overview
The Euro has been lifted on broad based US Dollar outflows, rather than on anything Euro specific. If anything, things have been more Euro bearish of late given softer economic data out of the zone and yield differentials that continue to move in the Buck's favour. ECB speak has been mostly dovish leaning and still viewing rising inflation as transitory. Key standouts on today’s calendar include Eurozone construction output, US housing starts and building permits, and a batch of Fed speak.EURUSD - Technical charts in detail
GBPUSD – technical overview
The market is in a consolidation phase in the aftermath of the run to fresh 2021 and multi-month highs. At this stage, additional setbacks should be limited to the 1.3200 area ahead of the next major upside extension towards a retest and break of critical resistance in the form of the 2018 high.GBPUSD – fundamental overview
The Pound continues to race higher on the back of the weekend comments from BOE Bailey, who all but sealed the deal on a rate hike before year end after saying the MPC would need to act in response to rising inflation. Key standouts on today’s calendar include Eurozone construction output, US housing starts and building permits, and a batch of Fed speak.USDJPY – technical overview
The longer-term trend is bearish despite the recent run higher. Look for additional upside to be limited, with scope for a topside failure and bearish resumption back down towards the 100.00 area. It would take a clear break back above 114.55 to negate the outlook.USDJPY – fundamental overview
Monetary policy divergence continues to be a fundamental catalyst driving Yen underperformance. But we have seen some Yen demand on Tuesday, given weaker UST yields and broad USD selling. Key standouts on today’s calendar include Eurozone construction output, US housing starts and building permits, and a batch of Fed speak.AUDUSD – technical overview
The Australian Dollar has been in the process of a healthy correction following the impressive run towards a retest of the 2018 high earlier this year. At this stage, there is risk for additional declines, though setbacks are expected to be well supported down into the 0.7000 area. Look for a weekly close above 0.7500 to force a shift in the structure.AUDUSD – fundamental overview
There were some initial attempts to sell the Australian Dollar on a dovish leaning RBA Minutes, but all of that has been reversed as the day pushes on. We're seeing strong demand on the back of risk on flow and broad US Dollar outflows. It also seems as though the Aussie rates market is pricing an outdated Minutes that will likely need to be reconsidered as inflation continues to rise. Key standouts on today’s calendar include Eurozone construction output, US housing starts and building permits, and a batch of Fed speak.USDCAD – technical overview
Finally signs of a major bottom in the works after a severe decline from the 2020 high. A recent weekly close back above 1.2500 encourages the constructive outlook and opens the door for a push back towards next critical resistance in the 1.3000 area. Any setbacks should be well supported into the 1.2200s.USDCAD – fundamental overview
The Canadian Dollar is bid on the back of risk on flow, oil demand, and broad US Dollar weakness. However, we have seen some relative weakness, given a recent run of softer economic data out of Canada. Key standouts on today’s calendar include Eurozone construction output, US housing starts and building permits, and a batch of Fed speak.NZDUSD – technical overview
The market has entered a period of consolidation after running up to a yearly and multi-month high. At this stage, rallies should be well capped and there is still room for deeper setbacks into the 0.6500-0.6800 area before we see an attempt at a higher low and resumption of upside pressure. Back above the April high at 0.7317 would be required to force a shift in the structure.NZDUSD – fundamental overview
Risk on flow and ramped up RBNZ rate hike expectations are driving Kiwi higher on Tuesday. We've also seen broad based US Dollar outflows contribute as well. The market is now starting to talk about the possibility for a surprise 50bp rate hike in November. Key standouts on today’s calendar include Eurozone construction output, US housing starts and building permits, and a batch of Fed speak.US SPX 500 – technical overview
Longer-term technical studies are looking quite exhausted and the market is showing signs of wanting to roll over after racing to another record high. Look for rallies to be well capped ahead of 4600, with a break back below 4353 to strengthen the outlook.US SPX 500 – fundamental overview
We're trading just off fresh record highs, and yet, with so little room for additional central bank accommodation, given an already depressed interest rate environment, the prospect for sustainable runs to the topside on easy money policy incentives and government stimulus, should no longer be as enticing to investors. Meanwhile, ongoing worry associated with coronavirus fallout and risk of rising inflation should weigh more heavily on investor sentiment in Q4 2021.GOLD (SPOT) – technical overview
The 2019 breakout above the 2016 high at 1375 was a significant development, opening the door for fresh record highs and an acceleration beyond the next major psychological barrier at 2000. Setbacks should now be well supported above 1600.GOLD (SPOT) – fundamental overview
The yellow metal continues to be well supported on dips with solid demand from medium and longer-term accounts. These players are more concerned about exhausted monetary policy, extended global equities, and coronavirus fallout. All of this should keep the commodity well supported, with many market participants also fleeing to the hard asset as the grand dichotomy of record high equities and record low yields comes to an unnerving climax. [audio mp3="https://www.lmax.com/blog/wp-content/uploads/sites/4/2021/09/15seplmaxaudio.mp3"][/audio]