


Special report: So what about bitcoin?
Today’s report: How much longer for the Dollar rally?
The US Dollar continues to hold its own as we come into the new week, trading just off recent eight week highs. What we’ve seen has been a wave of stronger US economic data and a repricing of Fed expectations.
Wake-up call
- ECB cut
- UK data
- Policy divergence
- China sentiment
- Canada jobs
- card spending
- accommodative policy
- Macro themes
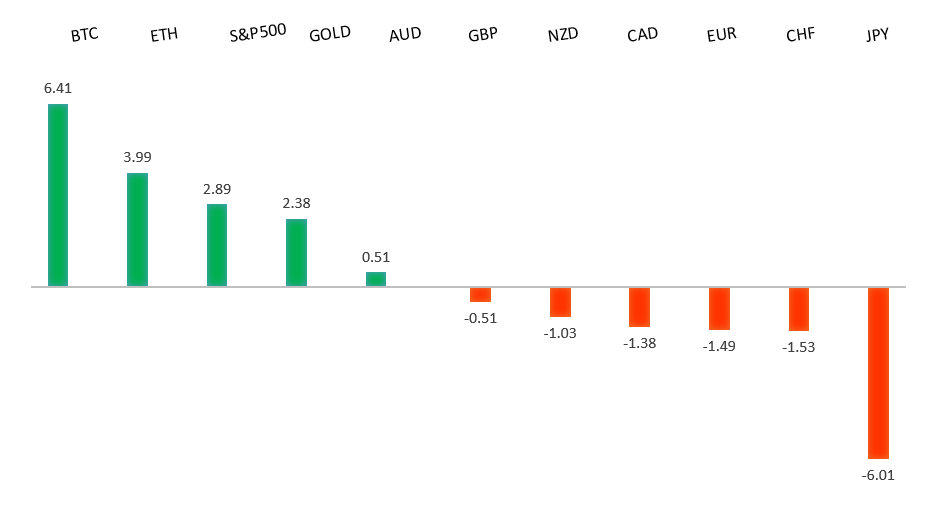
Peformance chart: 30-Day Performance vs. US dollar (%)
Suggested reading
- Sequoia Capital and the evolution of the VC industry, G. Bobillot, FT (October 10, 2024)
- Defining Bull and Bear Markets, B. Carlson, AWOCS (October 10, 2024)
Chart talk: Technical & fundamental highlights
Choose pair:
EURUSD – technical overview
The Euro has been in a multi-month consolidation since bottoming out in 2022. Setbacks have since been exceptionally well supported on dips below 1.0500, with a higher platform sought out ahead of the next major upside extension. Look for a push through the 2023 high at 1.1276 to strengthen the constructive outlook and extend the recovery run towards 1.2000. Only back below 1.0400 negates.EURUSD – fundamental overview
The Euro remains under pressure at the moment, as it contends with shifting monetary policy expectations. An ECB that one month ago wasn't thought to be considering a rate cut this month is now expected to cut rates when it meets later this week. At the same time, US economic data has made the Fed shift to a slightly less accommodative outlook. Monday’s calendar is exceptionally thin with only a round of ECB and Fed speak standing out.EURUSD - Technical charts in detail
GBPUSD – technical overview
Signs have emerged of the market wanting to put in a longer-term base after collapsing to a record low in September 2022. The door is now open for the next major upside extension towards the 2018 high at 1.4377. Any setbacks should be well supported ahead of 1.2500.GBPUSD – fundamental overview
The Pound got some help from Friday's round of UK data in the form of industrial production, manufacturing production, and GDP. Monday’s calendar is exceptionally thin with only a round of Fed speak standing out.USDJPY – technical overview
The market is looking to resume the longer-term uptrend after an intense correction in 2024. A higher low is ideally sought out above 140.00 in favor of a bullish continuation. A weekly close back above 150.00 will hint at the start to longer-term uptrend resumption.USDJPY – fundamental overview
The Yen has come back under pressure in recent weeks as BOJ policy leans less hawkish and Fed policy leans less dovish. We got another taste of this on Friday after US producer prices came in hotter than expected. Monday’s calendar is exceptionally thin with only a round of Fed speak standing out.AUDUSD – technical overview
There are signs of the potential formation of a longer-term base with the market trading down into a meaningful longer-term support zone. Only a monthly close below 0.6200 would give reason for rethink. A monthly close back above 0.7000 will take the big picture pressure off the downside and strengthen case for a bottom.AUDUSD – fundamental overview
The Australian Dollar has been better bid of late on the back of improved sentiment out of China, record high US equities, and recovering commodities prices. Monday’s calendar is exceptionally thin with only a round of Fed speak standing out.USDCAD – technical overview
A sustained hold above 1.3000 over the past several months signals an end to a period of longer-term bearish consolidation and suggests the market is in the process of carving out a more significant longer-term base. Next key resistance now comes in up into the 1.4000 area, with a break to open a retest of the 2020 high just ahead of 1.4700. Setbacks should be very well supported down into the 1.3000 area.USDCAD – fundamental overview
The Canadian Dollar has been hit hard lately and is a clear underperformer, taking a beating from broad based USD demand on shifting Fed expectations, and perhaps also on deeper concerns about the outlook for the Canadian economy. Interestingly enough, the relative weakness comes even after a solid Canada employment report. Monday’s calendar is exceptionally thin with only a round of Fed speak standing out.NZDUSD – technical overview
Overall pressure remains on the downside with the market continuing to stall out on runs up into the 0.6500 area. At the same time, there are some signs of the market wanting to put in a longer-term base. Ultimately, a break back above 0.6500 would be required to take the medium-term pressure off the downside and encourage this prospect. A monthly close below 0.5800 will intensify bearish price action.NZDUSD – fundamental overview
Recent data out of New Zealand (PSI, card spending) has been solid overall, while risk markets continue to run hot as evidenced by record high US equities. Commodities have also been better bid and all of this is supporting the Kiwi rate. Monday’s calendar is exceptionally thin with only a round of Fed speak standing out.US SPX 500 – technical overview
The longer term uptrend remains intact and dips continue to be exceptionally well supported. Critical support comes in at 5093, with only a break back below this level to compromise the structure and open the door for a more significant corrective decline. Until then, the focus remains on a continued push to fresh record highs.US SPX 500 – fundamental overview
The US equities market remains exceptionally well supported in 2024 on the back of an ongoing expectation for more rate cuts than less going forward. Investors are feeling better about a soft landing in the US economy and this has also been accompanied by an accommodative adjustment of Fed policy. It will however be important to keep an eye on inflation, bigger picture economic data, US election and geopolitical risk in the weeks and months ahead.GOLD (SPOT) – technical overview
The 2019 breakout above the 2016 high at 1375 was a significant development, opening the door for fresh record highs and this next major upside extension into the 2500-3000 area. Setbacks should now be well supported above 2300 on a monthly close basis.GOLD (SPOT) – fundamental overview
The yellow metal has pushed record highs in 2024 with solid demand from medium and longer-term accounts. These players are more concerned about inflation, geopolitical risk and a less upbeat global growth outlook. All of this should keep the commodity well supported over the coming months.