


Next 24 hours: Market conditions improve despite China concerns
Today’s report: Investors hoping for a better week
We’ve just come out of a very tough week for financial markets. There were plenty of alarm bells that went off in the previous week highlighted by renewed concerns over the state of inflation in the US and impact on Fed policy, along with plenty of worry around the growth outlook for China.
Wake-up call
- producer prices
- retail sales
- intervention worry
- tough week
- Oil recovery
- RBNZ Silk
- inflation risk
- Dealers report
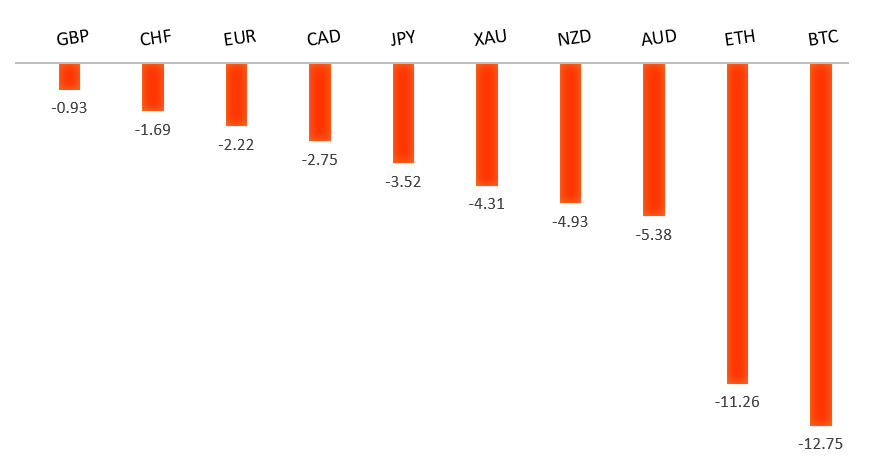
Peformance chart: 30 Day Performance vs. US dollar (%)
Suggested reading
- Meet the New Bonds, Same as the Old Bonds, J. Authers, Bloomberg (August 18, 2023)
- The Perils Of Long Term Forecasts, R. Wigglesworth, FT Alphaville (August 17, 2023)
Chart talk: Technical & fundamental highlights
Choose pair:
EURUSD – technical overview
The Euro remains well supported on dips following a run to the topside through 1.1000. Any additional setbacks should be well supported ahead of 1.0500 in favor of a bullish continuation. Ultimately, only a monthly close back below 1.0500 would give reason for concern. Next key resistance comes in the form of the 2023 high at 1.1276.EURUSD – fundamental overview
The Euro will be looking to stabilize following an intense week of downside pressure. Setbacks had extended to multi-day lows on Friday on the back of some softer data out of the zone, though the single currency did manage to get some minor relief into the weekly close. Monday’s calendar is exceptionally thin. The only notable standouts come from German producer prices, and Canada housing data.EURUSD - Technical charts in detail
GBPUSD – technical overview
Signs have emerged of the market wanting to put in a longer-term base after collapsing to a record low in September 2022. The November 2022 monthly close back above 1.2000 strengthens this prospect. Any setbacks should now be well supported ahead of 1.2500. Next key resistance comes in at 1.3143.GBPUSD – fundamental overview
The Pound did a good job standing out as an outperformer in the previous week, with overall solid economic data and higher inflation reads accounting for the Sterling demand. However, we did see a minor bout of selling kick in on Friday after UK retail sales came in below forecast. Monday’s calendar is exceptionally thin. The only notable standouts come from German producer prices, and Canada housing data.USDJPY – technical overview
At this stage, it looks like the market is wanting to resume the bigger picture uptrend and head back towards a retest of that multi-year high from October 2022 up at 151.95. Look for any weakness to continue to be well supported on dips.USDJPY – fundamental overview
We've been seeing a wave of overdue Yen demand in recent sessions, with many attributing the price action to a market that doesn't want to get too short the Yen on fear of a possible intervention. There have been many warnings in recent days that an intervention could be forthcoming on the back of such an aggressive slide in the Japanese currency. Monday’s calendar is exceptionally thin. The only notable standouts come from German producer prices, and Canada housing data.AUDUSD – technical overview
There are signs of the potential formation of a longer-term base following the late 2022 surge back above 0.6500. Next key resistance comes in at 0.7284. Setbacks should continue to be well supported ahead of 0.6300. Only a monthly close below 0.6400 would give reason for rethink.AUDUSD – fundamental overview
The Australian Dollar extended its run of fresh 2023 lows in the previous week on the back of ongoing fears over the outlook for China, a more dovish leaning RBA Minutes, a more hawkish leaning FOMC Minutes, sliding metals prices, and a discouraging Aussie employment report. Monday’s calendar is exceptionally thin. The only notable standouts come from German producer prices, and Canada housing data.USDCAD – technical overview
Above 1.3000 signals an end to a period of longer-term bearish consolidation and suggests the market is in the process of carving out a more significant longer-term base. Next key resistance now comes in up into the 1.4000 area. Setbacks should be very well supported down into the 1.3000 area.USDCAD – fundamental overview
A worsening global macro condition, and softer Canada economic data have factored into the latest run of Canadian Dollar weakness. At the same time, Thursday and Friday's recovery in the price of oil has mitigated some of the weakness. Monday’s calendar is exceptionally thin. The only notable standouts come from German producer prices, and Canada housing data.NZDUSD – technical overview
Overall pressure remains on the downside with the market once again stalling out on a run up into the 0.6500 area. Ultimately, a break back above 0.6577 would be required to take the immediate pressure off the downside. A monthly close below 0.6000 would intensify bearish price action.NZDUSD – fundamental overview
RBNZ Assistant Governor Silk spoke in an interview on Friday saying that the bump higher to the OCR track was in essence to allow the RBNZ to potentially retain rates at a higher level for longer, citing "some risks on the upside to inflation." Apart from that, she identified the "biggest driver" of said upside risks to inflation was "probably" housing, and was undecided on the current outlook regarding inflation from the ongoing stabilization in the housing market. Early Monday New Zealand trade data failed to produce any major surprises or have any market moving influence. Monday’s calendar is exceptionally thin for the remainder of the day. The only notable standouts come from German producer prices, and Canada housing data.US SPX 500 – technical overview
Longer-term technical studies are in the process of unwinding from extended readings off record highs. Look for rallies to be well capped in favor of lower tops and lower lows. A monthly close back above 4600 will be required to take the immediate pressure off the downside. Next key support comes in at 4328.US SPX 500 – fundamental overview
We've finally reached a point in the cycle where the Fed recognizes unanchored inflation expectations pose a greater downside risk than over-tightening. This is significant, as it means less investor friendly monetary policy. Overall, we expect inflation to continue to be a problem in 2023 that results in downside pressure into rallies despite market expectations that would argue otherwise.GOLD (SPOT) – technical overview
The 2019 breakout above the 2016 high at 1375 was a significant development, opening the door for fresh record highs. Setbacks should now be well supported above 1600 on a monthly close basis ahead of the next major upside extension. Next major resistance comes in at 2100, above which opens the next extension towards 2500.GOLD (SPOT) – fundamental overview
The yellow metal continues to be well supported on dips with solid demand from medium and longer-term accounts. These players are more concerned about inflation risk and a less upbeat global growth outlook. All of this should keep the commodity well supported, with many market participants also fleeing to the hard asset as the grand dichotomy of record high equities and record low yields comes to an unnerving climax.