


Today’s report: Tension running high into weekly close
High beta currencies continue to suffer into the end of the week, while US equities have gotten smashed. It has certainly been an ugly run for financial markets this week and investors are back to worrying about a Fed outlook which still leaves the door open for an even less investor friendly path forward.
Wake-up call
- Eurozone inflation
- retail sales
- JGB auction
- Aussie employment
- Oil recovery
- RBNZ Orr
- inflation risk
- Dealers report
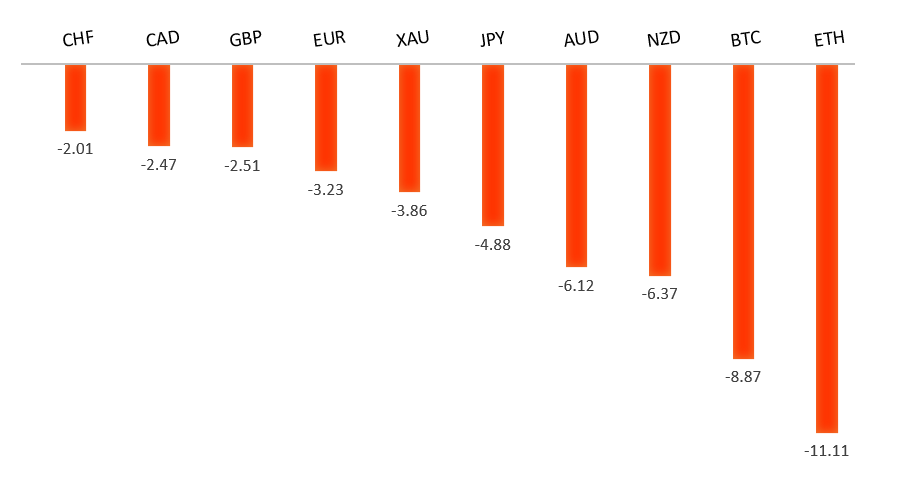
Peformance chart: 30 Day Performance vs. US dollar (%)
Suggested reading
- Don’t Déjà Vu Me, Argentina. Markets Are Out of Tears, J. Authers, Bloomberg (August 17, 2023)
- Thoughts On How Ruble's Decline Could Affect the War, J. Klawans, The Week (August 16, 2023)
Chart talk: Technical & fundamental highlights
Choose pair:
EURUSD – technical overview
The Euro remains well supported on dips following a run to the topside through 1.1000. Any additional setbacks should be well supported ahead of 1.0500 in favor of a bullish continuation. Ultimately, only a monthly close back below 1.0500 would give reason for concern. Next key resistance comes in the form of the 2023 high at 1.1276.EURUSD – fundamental overview
The Euro continues to weaken into the end of the week on broad based US Dollar demand and risk off flow. We have however seen relative strength against high beta FX. Key standouts on Friday’s calendar come from Japan inflation, UK retail sales, Eurozone inflation, and Canada producer prices.EURUSD - Technical charts in detail
GBPUSD – technical overview
Signs have emerged of the market wanting to put in a longer-term base after collapsing to a record low in September 2022. The November 2022 monthly close back above 1.2000 strengthens this prospect. Any setbacks should now be well supported ahead of 1.2500. Next key resistance comes in at 1.3143.GBPUSD – fundamental overview
This weeks solid round of UK data and higher inflation indicators have been behind this run of outperformance in the Pound. Long Gilt yields have topped the October highs and implied UK peak rates have surged back above 6%. Key standouts on Friday’s calendar come from Japan inflation, UK retail sales, Eurozone inflation, and Canada producer prices.USDJPY – technical overview
At this stage, it looks like the market is wanting to resume the bigger picture uptrend and head back towards a retest of that multi-year high from October 2022 up at 151.95. Look for any weakness to continue to be well supported on dips.USDJPY – fundamental overview
An awful JGB auction result sent Japan yields higher, while broad based risk off flow also may have factored into Thursday's round of Yen demand. The Yen was already looking due for a recovery after getting slammed to yearly lows in recent sessions. Market participants have also been a little more worried about a possible intervention. Key standouts on Friday’s calendar come from Japan inflation, UK retail sales, Eurozone inflation, and Canada producer prices.AUDUSD – technical overview
There are signs of the potential formation of a longer-term base following the late 2022 surge back above 0.6500. Next key resistance comes in at 0.7284. Setbacks should continue to be well supported ahead of 0.6300. Only a monthly close below 0.6400 would give reason for rethink.AUDUSD – fundamental overview
The Australian Dollar has extended its run of fresh 2023 lows on the back of ongoing fears over the outlook for China, a more dovish leaning RBA Minutes earlier this week, more hawkish leaning FOMC Minutes, and discouraging Aussie employment report. Key standouts on Friday’s calendar come from Japan inflation, UK retail sales, Eurozone inflation, and Canada producer prices.USDCAD – technical overview
Above 1.3000 signals an end to a period of longer-term bearish consolidation and suggests the market is in the process of carving out a more significant longer-term base. Next key resistance now comes in up into the 1.4000 area. Setbacks should be very well supported down into the 1.3000 area.USDCAD – fundamental overview
A worsening global macro condition, and softer Canada economic data have factored into this week's run of Canadian Dollar weakness. At the same time, Thursday's recovery in the price of oil has mitigated some of the weakness. Key standouts on Friday’s calendar come from Japan inflation, UK retail sales, Eurozone inflation, and Canada producer prices.NZDUSD – technical overview
Overall pressure remains on the downside with the market once again stalling out on a run up into the 0.6500 area. Ultimately, a break back above 0.6577 would be required to take the immediate pressure off the downside. A monthly close below 0.6000 would intensify bearish price action.NZDUSD – fundamental overview
The New Zealand Dollar has slumped to a fresh yearly low this week, though setbacks could have been even more intense if not for a more hawkish leaning central bank decision in which the RBNZ left rates on hold but would not rule out the possibility for additional rate hikes. Still, the outlook for the currency has been quite sour in the face of broad based risk off flow and yield differentials swinging back to the US Dollar. RBNZ Orr was also on the wires saying the New Zealand economy needed a mild recession to tame inflation. Key standouts on Friday’s calendar come from Japan inflation, UK retail sales, Eurozone inflation, and Canada producer prices.US SPX 500 – technical overview
Longer-term technical studies are in the process of unwinding from extended readings off record highs. Look for rallies to be well capped in favor of lower tops and lower lows. A monthly close back above 4600 will be required to take the immediate pressure off the downside. Next key support comes in at 4328.US SPX 500 – fundamental overview
We've finally reached a point in the cycle where the Fed recognizes unanchored inflation expectations pose a greater downside risk than over-tightening. This is significant, as it means less investor friendly monetary policy. Overall, we expect inflation to continue to be a problem in 2023 that results in downside pressure into rallies despite market expectations that would argue otherwise.GOLD (SPOT) – technical overview
The 2019 breakout above the 2016 high at 1375 was a significant development, opening the door for fresh record highs. Setbacks should now be well supported above 1600 on a monthly close basis ahead of the next major upside extension. Next major resistance comes in at 2100, above which opens the next extension towards 2500.GOLD (SPOT) – fundamental overview
The yellow metal continues to be well supported on dips with solid demand from medium and longer-term accounts. These players are more concerned about inflation risk and a less upbeat global growth outlook. All of this should keep the commodity well supported, with many market participants also fleeing to the hard asset as the grand dichotomy of record high equities and record low yields comes to an unnerving climax.