


Next 24 hours: US Dollar jumps out in front as year gets going
Today’s report: Investors proceeding with caution into 2023
We’re just getting ready to get back to fuller trading conditions following the holiday break and as things stand, we’re looking at a market that is still quite cautious with respect to the outlook for 2023.
Wake-up call
- ECB Stournaras
- house prices
- Yamaguchi
- China news
- Business Barometer
- investor appetite
- Inflation headache
- Dealers report
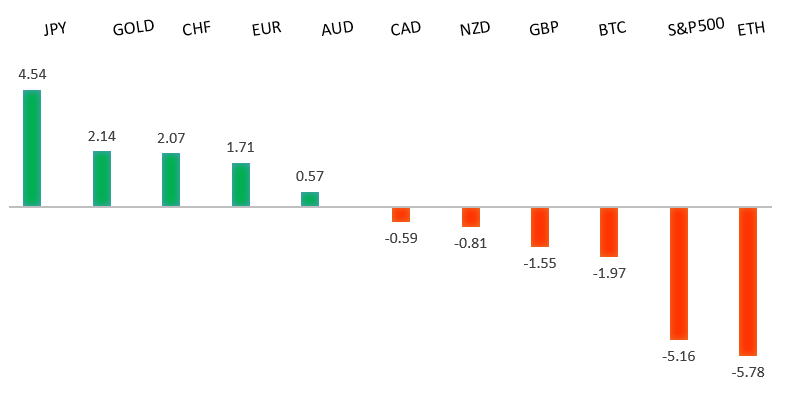
Peformance chart: 30 Day Performance vs. US dollar (%)
Suggested reading
- US Bond Performance Shows Fed Isn't Behind the Curve, M. Winkler, Bloomberg (December 30, 2022)
- The 10 Least Expensive Cities In the United States, B. Stanek, The Week (December 28, 2022)
Chart talk: Technical & fundamental highlights
Choose pair:
EURUSD – technical overview
The Euro recovery has finally run back above meaningful previous support turned resistance at 1.0635. The December close above this level further encourages the recovery outlook and makes a stronger case for the formation of a longer-term bottom. Any setbacks should now be well supported ahead of 1.0200.EURUSD – fundamental overview
A nice rally for the Euro to close out 2022. There has been a lot more hawkish talk out from ECB officials and inflation in the zone continues to trend up overall, further supporting the hawkish commentary. Meanwhile, ECB's Stournaras said the central bank still needs to raise rates significantly at a sustained pace and that “keeping rates at restrictive levels will reduce inflation over time.” Looking ahead, key standouts on the calendar include German employment and inflation reads, Canada manufacturing PMIs, US manufacturing PMIs, and US construction spending.EURUSD - Technical charts in detail
GBPUSD – technical overview
Signs have emerged of the market wanting to put in a longer-term base after collapsing to a record low in September. The latest weekly close back above the September high at 1.1739 strengthens this prospect. Any setbacks should now be well supported ahead of 1.1100. Next key resistance comes in at 1.2668.GBPUSD – fundamental overview
UK house prices dropped for a 4th consecutive month in December. This is the first time since 2009 that prices have declined for four successive months. It leaves the year over year rate at 2.8%, the slowest since June 2020. Looking ahead, key standouts on the calendar include German employment and inflation reads, Canada manufacturing PMIs, US manufacturing PMIs, and US construction spending.USDJPY – technical overview
Longer-term technical studies are in the process of unwinding from severe overbought readings. Look for additional corrective price action back down towards the 126.00 area before the market considers the possibility of uptrend resumption. Rallies should now be well capped ahead of 140.00.USDJPY – fundamental overview
There has been increasing speculation the BOJ will be forced to shift to a tighter policy stance and this has resulted in a lot of the Yen outperformance we've been seeing in recent sessions. Japanese newspaper Sankei Shimbun reported Hirohide Yamaguchi has emerged as a strong candidate alongside Amamiya and Nakaso to replace Kuroda. Based on Yamaguchi's past speeches, the BoJ's policy would have a big shift. Looking ahead, key standouts on the calendar include German employment and inflation reads, Canada manufacturing PMIs, US manufacturing PMIs, and US construction spending.AUDUSD – technical overview
There are signs of the potential formation of a longer-term base following the recent surge back above 0.6500. The recent weekly close back above previous support now turned resistance at 0.6682 strengthens the outlook for a bullish structural shift.AUDUSD – fundamental overview
Most of this latest wave of Aussie demand has come from the news that China is scrapping quarantine measures and from a rally in commodities prices. Looking ahead, key standouts on the calendar include German employment and inflation reads, Canada manufacturing PMIs, US manufacturing PMIs, and US construction spending.USDCAD – technical overview
A recent surge back above 1.3000 signals an end to a period of bearish consolidation and suggests the market is in the process of carving out a more significant longer-term base. Next key resistance now comes in up into the 1.4000 area. Setbacks should be very well supported down into the 1.3000 area.USDCAD – fundamental overview
The Canadian CFIB Business Barometer recovered slightly in December coming in at 50.9 versus the 50.0 reading in November. Notable was the rise in intentions to increase staffing to the highest level since June. Looking ahead, key standouts on the calendar include German employment and inflation reads, Canada manufacturing PMIs, US manufacturing PMIs, and US construction spending.NZDUSD – technical overview
Overall pressure remains on the downside with risk for the current recovery rally to stall out and form a lower top for the next major downside extension. A break back above 0.6577 would be required to take the immediate pressure off the downside.NZDUSD – fundamental overview
There hasn't been much going on out of New Zealand as we get going in the new year. Most of the price action here has revolved around correlations with broader market sentiment. Looking ahead, key standouts on the calendar include German employment and inflation reads, Canada manufacturing PMIs, US manufacturing PMIs, and US construction spending.US SPX 500 – technical overview
Longer-term technical studies are in the process of unwinding from extended readings off record highs. Look for rallies to be well capped in favor of lower tops and lower lows. A monthly close back above 4300 will be required at a minimum to take the immediate pressure off the downside. Next major support comes in at 3492.US SPX 500 – fundamental overview
We've finally reached a point in the cycle where the Fed recognizes unanchored inflation expectations pose a greater downside risk than over-tightening. This is significant, as it means less investor friendly monetary policy that risks potential recession in the months ahead. Overall, we expect inflation to continue to be a problem in H1 2023 that results in downside pressure into rallies.GOLD (SPOT) – technical overview
The 2019 breakout above the 2016 high at 1375 was a significant development, opening the door for fresh record highs. Setbacks should now be well supported above 1600 on a monthly close basis ahead of the next major upside extension. The recent break back above 1808 strengthens the bullish outlook.GOLD (SPOT) – fundamental overview
The yellow metal continues to be well supported on dips with solid demand from medium and longer-term accounts. These players are more concerned about inflation risk and a less upbeat global growth outlook. All of this should keep the commodity well supported, with many market participants also fleeing to the hard asset as the grand dichotomy of record high equities and record low yields comes to an unnerving climax.