


Special report: BOE decision preview
Today’s report: Investors turn their attention to economic data
The Fed decision has come and gone. Any hopes of a Fed pivot have been dashed, and we’re back to a market frustrated by the reality that the Fed won’t be doing anything to alter its higher for longer course until inflation gets under control.
Wake-up call
- heavy PMIs
- BOE decision
- Policy divergence
- hawkish Fed
- BoC officials
- solid data
- Inflation headache
- Dealers report
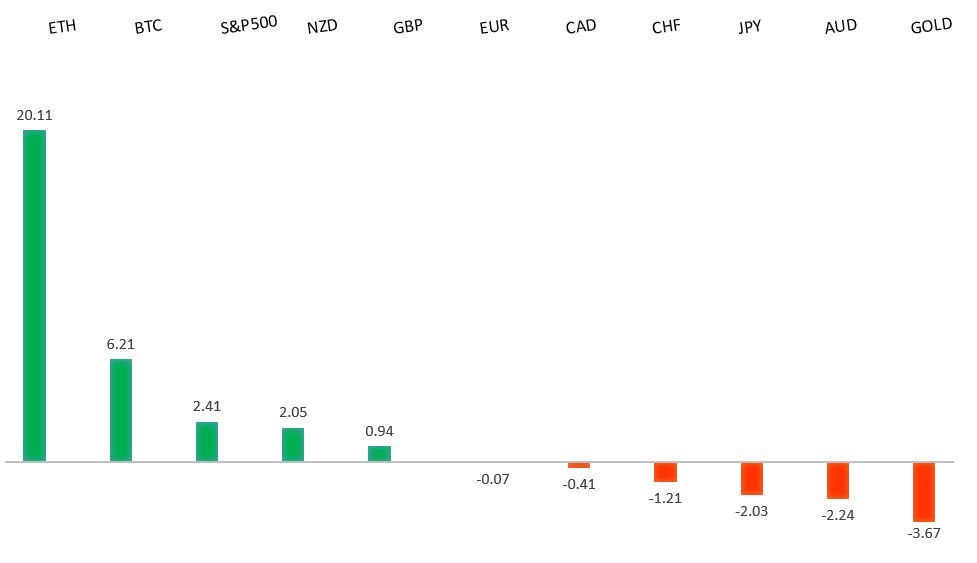
Peformance chart: 30 Day Performance vs. US dollar (%)
Suggested reading
- When Powell Makes Doves Cry With Disappointment, J. Authers, Bloomberg (November 3, 2022)
- Sniff technology: detecting everything from drugs to diseases, P. McGee, FT (November 2, 2022)
Chart talk: Technical & fundamental highlights
Choose pair:
EURUSD – technical overview
Technical studies are turning up from oversold territory, suggesting additional setbacks should be limited in favour of some form of a meaningful correction and consolidation. A weekly close back above parity will take the immediate pressure off the downside.EURUSD – fundamental overview
The Euro has been trading with a heavier tone since last week's dovish ECB communication. Making matters even more complicated has been a subsequent round of hotter than expected inflation data, barely positive growth readings and a heavy round of PMI data. We've also seen a fresh round of US Dollar demand in the aftermath of a more hawkish leaning Fed decision. Key standouts on today’s calendar come from Eurozone unemployment, the BOE policy decision, Canada trade, US trade, US initial jobless claims, US ISM non-manufacturing, and US factory orders.EURUSD - Technical charts in detail
GBPUSD – technical overview
Signs have emerged of the market wanting to put in a longer-term base after collapsing to a record low in September. A break above the September high at 1.1739 will solidify the recovery. Until then, look for setbacks to be well supported ahead of 1.0800.GBPUSD – fundamental overview
The Pound has come under some more pressure into the latter half of the week, with the latest round of setbacks being driven off renewed US Dollar demand in the aftermath of a more hawkish leaning Fed communication. Key standouts on today’s calendar come from Eurozone unemployment, the BOE policy decision, Canada trade, US trade, US initial jobless claims, US ISM non-manufacturing, and US factory orders.USDJPY – technical overview
Technical studies are looking quite stretched on the longer-term chart, warning of consolidation and correction in the days and weeks ahead. Look for additional upside from here to be well capped on rallies above 150.00. Next key support comes in at 145.43.USDJPY – fundamental overview
The Yen has remained under pressure as the BOJ maintains its accommodative policy stance and the Fed keeps with its hawkish communications. Key standouts on today’s calendar come from Eurozone unemployment, the BOE policy decision, Canada trade, US trade, US initial jobless claims, US ISM non-manufacturing, and US factory orders.AUDUSD – technical overview
Overall pressure remains on the downside with the market confined to a well defined downtrend. A break back above 0.6682 would be required to take the pressure off the downside. Until then, scope exists for deeper setbacks towards 0.6000.AUDUSD – fundamental overview
Aussie building approvals came out better than expected the other day, which had helped to prop the Australian Dollar a bit before the currency was sold later on Wednesday following the more hawkish Fed communication. Key standouts on today’s calendar come from Eurozone unemployment, the BOE policy decision, Canada trade, US trade, US initial jobless claims, US ISM non-manufacturing, and US factory orders.USDCAD – technical overview
A recent surge back above 1.3000 signals an end to a period of bearish consolidation and suggests the market is in the process of carving out a more significant longer-term base. Next key resistance now comes in up into the 1.4000 area. Setbacks should be very well supported down into the 1.3000 area.USDCAD – fundamental overview
Various Bank of Canada officials have been out expressing concern about the outlook for the Canada economy, while defending the downsized 50 basis point rate hike from the Bank of Canada. This comes in contrast to the latest hawkish Fed communication and has driven a round of selling in the Canadian Dollar. Key standouts on today’s calendar come from Eurozone unemployment, the BOE policy decision, Canada trade, US trade, US initial jobless claims, US ISM non-manufacturing, and US factory orders.NZDUSD – technical overview
Overall pressure remains on the downside with the focus on a retest of the critical low from 2020 at 0.5469. A break back above 0.6162 would be required to take the immediate pressure off the downside.NZDUSD – fundamental overview
New Zealand economic data has been stronger of late, while inflation continues to climb, all of which has resulted in Kiwi outperformance against its peers. At the same time, the New Zealand Dollar has stumbled against the Buck in the aftermath of the latest hawkish Fed communication. Key standouts on today’s calendar come from Eurozone unemployment, the BOE policy decision, Canada trade, US trade, US initial jobless claims, US ISM non-manufacturing, and US factory orders.US SPX 500 – technical overview
Longer-term technical studies are in the process of unwinding from extended readings off record highs. Look for rallies to be well capped in favor of lower tops and lower lows. Back above 4000 will be required at a minimum to take the immediate pressure off the downside. Next major support comes in around 3200.US SPX 500 – fundamental overview
We've finally reached a point in the cycle where the Fed recognizes unanchored inflation expectations pose a greater downside risk than over-tightening. This is significant, as it means less investor friendly monetary policy that risks potential recession in the months ahead. Overall, we expect inflation to continue to be a problem in 2022 that results in downside pressure into rallies.GOLD (SPOT) – technical overview
The 2019 breakout above the 2016 high at 1375 was a significant development, opening the door for fresh record highs. Setbacks should now be well supported above 1600 on a monthly close basis ahead of the next major upside extension.GOLD (SPOT) – fundamental overview
The yellow metal continues to be well supported on dips with solid demand from medium and longer-term accounts. These players are more concerned about inflation risk and a less upbeat global growth outlook. All of this should keep the commodity well supported, with many market participants also fleeing to the hard asset as the grand dichotomy of record high equities and record low yields comes to an unnerving climax.