


Next 24 hours: Geopolitical risk in the spotlight
Today’s report: More bad news is good news for stocks
The US Dollar took a big hit to close out the previous week, with the most notable setbacks coming against the major currencies. The primary driver of the price action was the extremely discouraging Michigan sentiment read.
Wake-up call
- wholesale prices
- Virus downtick
- USD decline
- Pandemic worry
- Political climate
- manufacturing PMIs
- Stocks vulnerable
- Dealers report
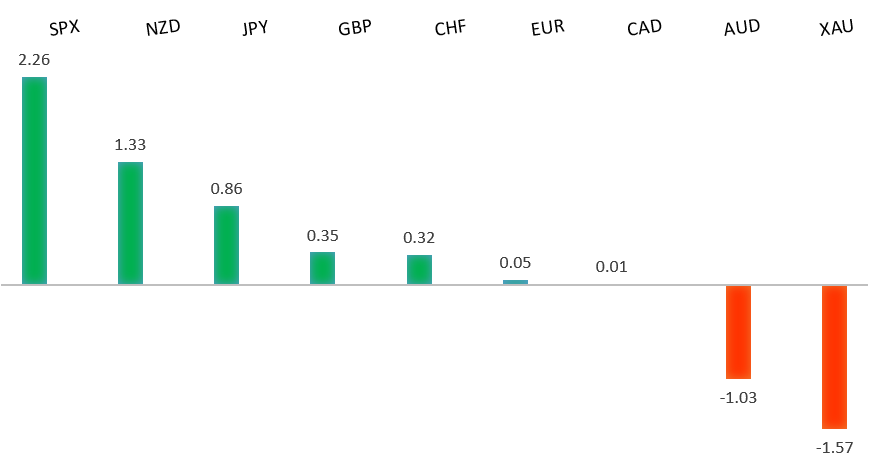
Peformance chart: 30 Day Performance vs. US dollar (%)
Suggested reading
- What Another $3.5 Trillion Could Do to Inflation, K. Smith, Bloomberg (August 12, 2021)
- Missing: Corporate Leadership on Vaccines, B. Ritholtz, The Big Picture (August 12, 2021)
Chart talk: Technical & fundamental highlights
Choose pair:
EURUSD – technical overview
The market has been looking for a higher low since topping out in 2021 up at 1.2350. Ideally, setbacks continue to be well supported down towards 1.1600 in favour of the next major upside extension back through 1.2350 and towards a retest of the 2018 high at 1.2555 further up. Only a weekly close below 1.1600 would force a rethink.EURUSD – fundamental overview
The Euro put in a nice recovery to close out the previous week, getting a boost from higher German wholesale prices and the hit to the US Dollar on the awful Michigan sentiment read. Key standouts on Monday’s calendar include Japan GDP, Canada manufacturing sales, and New York empire state manufacturing.EURUSD - Technical charts in detail
GBPUSD – technical overview
The market is in a corrective phase in the aftermath of the run to fresh 2021 and multi-month highs. At this stage, additional setbacks should be limited to the 1.3500 area ahead of the next major upside extension towards a retest and break of critical resistance in the form of the 2018 high.GBPUSD – fundamental overview
The downtick in the virus across five of seven UK regions provided a nice boost for the Pound this past Friday, with the currency also generating momentum from fallout in the US Dollar from the discouraging Michigan sentiment read. Key standouts on Monday’s calendar include Japan GDP, Canada manufacturing sales, and New York empire state manufacturing.USDJPY – technical overview
The longer-term trend is bearish despite the recent run higher. Look for additional upside to be limited, with scope for a topside failure and bearish resumption back down towards the 100.00 area. It would take a clear break back above 113.00 to negate the outlook.USDJPY – fundamental overview
Big gains for the Yen to close out the previous week. It seems the combination of concerning data out of the US and broad based US Dollar declines resulting from this data, were the primary drivers of the flow. Key standouts on Monday’s calendar include Japan GDP, Canada manufacturing sales, and New York empire state manufacturing.AUDUSD – technical overview
The Australian Dollar has been in the process of a healthy correction following the impressive run towards a retest of the 2018 earlier this year. At this stage, there is risk for additional declines, though setbacks are expected to be well supported down into the 0.7000 area.AUDUSD – fundamental overview
The Australian Dollar did its best to recover into the end of the previous week (mostly on broad USD selling from the discouraging Michigan sentiment read), but continued to remain weighed down on the Aussie virus setback and China outlook. Key standouts on Monday’s calendar include Japan GDP, Canada manufacturing sales, and New York empire state manufacturing.USDCAD – technical overview
Finally signs of a major bottom in the works after a severe decline from the 2020 high. The weekly close back above 1.2500 encourages the constructive outlook and opens the door for a push back towards next critical resistance in the 1.3000 area. Any setbacks should be well supported into the 1.2200s.USDCAD – fundamental overview
The Canadian Dollar failed to rally all that much despite strong gains in the major currencies against the Buck this past Friday. Uncertainty around global sentiment and the political climate in Canada managed to offset a lot of the potential demand. Key standouts on Monday’s calendar include Japan GDP, Canada manufacturing sales, and New York empire state manufacturing.NZDUSD – technical overview
The market has entered a period of consolidation after running up to a yearly and multi-month high. At this stage, there is still room for deeper setbacks into the 0.6500-0.6800 area before we see an attempt at a higher low and resumption of upside pressure.NZDUSD – fundamental overview
A nice recovery for the New Zealand Dollar into the weekly close, with the currency getting a boost from a healthy jump in business manufacturing PMIs, and broad based selling of the US Dollar in the aftermath of a discouraging Michigan sentiment read. Key standouts on Monday’s calendar include Japan GDP, Canada manufacturing sales, and New York empire state manufacturing.US SPX 500 – technical overview
Longer-term technical studies are looking quite exhausted and the market is showing signs of wanting to roll over after racing to another record high. Look for rallies to be well capped ahead of 4500, with a break back below 4139 to strengthen the outlook.US SPX 500 – fundamental overview
We're trading just off fresh record highs, and yet, with so little room for additional central bank accommodation, given an already depressed interest rate environment, the prospect for sustainable runs to the topside on easy money policy incentives and government stimulus, should no longer be as enticing to investors. Meanwhile, ongoing worry associated with coronavirus fallout and risk of rising inflation should weigh more heavily on investor sentiment into the second half of 2021.GOLD (SPOT) – technical overview
The 2019 breakout above the 2016 high at 1375 was a significant development, opening the door for fresh record highs and an acceleration beyond the next major psychological barrier at 2000. Setbacks should now be well supported above 1600.GOLD (SPOT) – fundamental overview
The yellow metal continues to be well supported on dips with solid demand from medium and longer-term accounts. These players are more concerned about exhausted monetary policy, extended global equities, and coronavirus fallout. All of this should keep the commodity well supported, with many market participants also fleeing to the hard asset as the grand dichotomy of record high equities and record low yields comes to an unnerving climax.