


Next 24 hours: Not a pretty picture
Today’s report: Odds for 100 basis point July Fed hike cross 50%
The US Dollar extended its run of gains against most currencies on Wednesday, this on the back of a hot US CPI read, which only adds more pressure on the Fed to be needing to do more with rate hikes.
Wake-up call
- industrial production
- UK data
- US CPI
- profit taking
- 100 bps
- downside risk
- Stocks vulnerable
- Dealers report
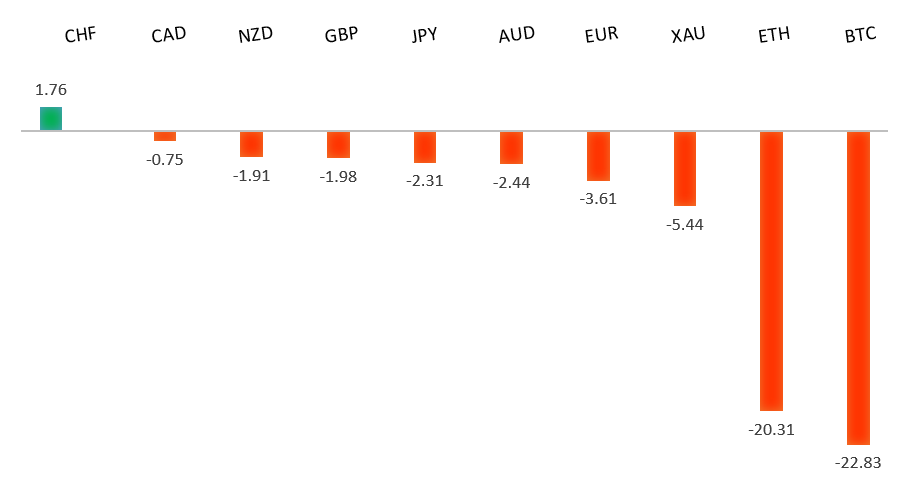
Peformance chart: 30 Day Performance vs. US dollar (%)
Suggested reading
- Housing Inventories May Not Save Prices After All, J. Levin, Bloomberg (July 12, 2022)
- The Ongoing Battle to Defeat Crypto Thieves, H. Murphy, Financial Times (July 5, 2022)
Chart talk: Technical & fundamental highlights
Choose pair:
EURUSD – technical overview
The market has come under intense pressure in recent months, with setbacks accelerating below the critical multi-year low from 2017 at 1.0340. This sets up a test of monumental support in the form of parity. At the same time, technical studies are tracking in oversold territory, suggesting additional setbacks should be limited. Back above 1.0500 would be required to take the immediate pressure off the downside.EURUSD – fundamental overview
The Euro sunk to a fresh multi-year low below parity on Wednesday, but was well supported on the dip and managed to recover into the close. The gains were rather impressive overall when considering a very hot US CPI read. Better than expected Eurozone industrial production reads earlier in the day also helped to prop the Euro. Key standouts on today’s calendar come from US producer prices and US initial jobless claims.EURUSD - Technical charts in detail
GBPUSD – technical overview
The market continues to be exceptionally well supported on dips below 1.2000. Unless we see a monthly close below 1.2000, we expect this to continue to be the case. Look for a break back above 1.2200 to take the immediate pressure off the downside.GBPUSD – fundamental overview
The Pound took a late hit on the hot US CPI read, but held up well overall on the back of profit taking on US Dollar longs and some better than expected UK data highlighted by UK industrial and manufacturing production numbers. Key standouts on today’s calendar come from US producer prices and US initial jobless claims.USDJPY – technical overview
The market has rocketed higher to its highest levels since 1998 after breaking through the 2002 high. Technical studies are however looking stretched, with scope for a sizable consolidation and correction in the weeks ahead. Look for additional upside from here to be well capped ahead of 140.00. A break back below 134.00 would take the immediate pressure off the topside.USDJPY – fundamental overview
More downside pressure in the Yen to fresh multi-year lows on Wednesday, this on the back of the much hotter than expected US CPI read, which only further highlights the US Dollar yield differential advantage against the Yen. Key standouts on today’s calendar come from US producer prices and US initial jobless claims.AUDUSD – technical overview
Overall pressure remains on the downside and conditions remain quite choppy. A break back above 0.7070 would be required at a minimum to take the immediate pressure off the downside. Until then, scope exists for deeper setbacks towards 0.6500.AUDUSD – fundamental overview
Most of the latest slide to fresh yearly lows in the Australian Dollar has come from renewed worry around the coronavirus in China. Meanwhile, a sharp decline in the price of iron oil has also contributed to the Aussie weakness. Key standouts on today’s calendar come from the RBNZ policy decision, China trade, German inflation, UK industrial production, trade, and GDP, Eurozone industrial production, US inflation, the Bank of Canada policy decision, and the Fed Beige Book.USDCAD – technical overview
A recent surge back above 1.3000 signals an end to a period of bearish consolidation and suggests the market is in the process of carving out a more significant longer-term base. Next key resistance now comes in up into the 1.3500 area. Setbacks should be very well supported down into the 1.2500 area.USDCAD – fundamental overview
While the Canadian Dollar has suffered against the US Dollar in recent sessions, the Loonie has held up well against its peers on account of supported oil prices. All eyes now on today's Bank of Canada policy decision where the central bank is expected to raise rates by 75 basis points. Other key standouts on today’s calendar come from the RBNZ policy decision, China trade, German inflation, UK industrial production, trade, and GDP, Eurozone industrial production, US inflation, and the Fed Beige Book.NZDUSD – technical overview
Overall pressure remains on the downside and conditions remain quite choppy. A break back above 0.6400 would be required to force a shift in the structure and suggest we are seeing a more significant bullish reversal. Until then, scope exists for fresh yearly lows and a retest of the major psychological barrier at 0.6000.NZDUSD – fundamental overview
The New Zealand Dollar has extended declines to a fresh yearly low this week, this on the back of ongoing monetary policy divergence with the FOMC and broad based risk off flow. The market will now settle in and digest the latest RBNZ decision due today. The expectation is the central bank will go ahead and hike 50 basis points. Key standouts on today’s calendar come from the RBNZ policy decision, China trade, German inflation, UK industrial production, trade, and GDP, Eurozone industrial production, US inflation, the Bank of Canada policy decision, and the Fed Beige Book.US SPX 500 – technical overview
Longer-term technical studies are in the process of unwinding from extended readings off record highs. Look for rallies to be well capped in favor of lower tops and lower lows. Back above 4,206 will be required at a minimum to take the immediate pressure off the downside. Next major support comes in around 3,400.US SPX 500 – fundamental overview
With so little room for additional central bank accommodation, given an already depressed interest rate environment, the prospect for sustainable runs to the topside on easy money policy incentives and government stimulus, should no longer be as enticing to investors. Meanwhile, ongoing worry associated with rising inflation and slower growth should continue to weigh more heavily on investor sentiment in 2022.GOLD (SPOT) – technical overview
The 2019 breakout above the 2016 high at 1375 was a significant development, opening the door for fresh record highs. Setbacks should now be well supported above 1700.GOLD (SPOT) – fundamental overview
The yellow metal continues to be well supported on dips with solid demand from medium and longer-term accounts. These players are more concerned about exhausted monetary policy, extended global equities, and inflation risk. All of this should keep the commodity well supported, with many market participants also fleeing to the hard asset as the grand dichotomy of record high equities and record low yields comes to an unnerving climax.