


Today’s report: Reduction in risk appetite
As the week comes to a close and we head into some thinner holiday trade, the state of markets is still very much a fragile one. Risk assets are under pressure and the US Dollar is broadly bid, this on the back of yield differentials that continue to lean in the Buck’s favor with the Fed more concerned about rising inflation in 2022.
Wake-up call
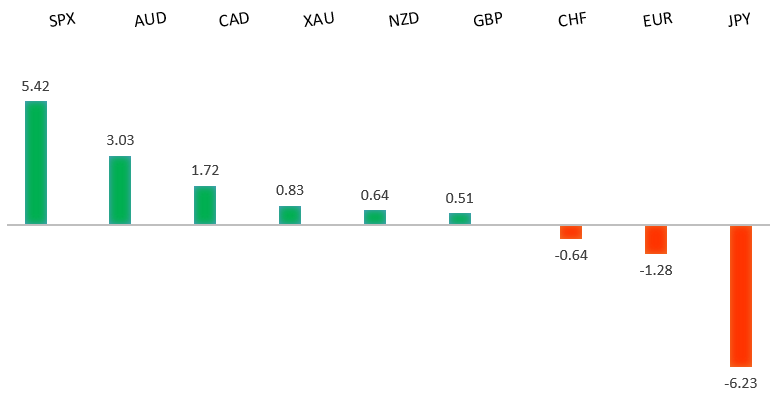
Peformance chart: 30 Day Performance vs. US dollar (%)
Suggested reading
- Four Financial Questions for Passover, and Easter, J. Authers, Bloomberg (April 14, 2022)
- Upcycled Food is on the Up, J. Evans, Financial Times (April 13, 2022)
Chart talk: Technical & fundamental highlights
Choose pair:
EURUSD – technical overview
A recent breakdown below 1.1100 to fresh multi-month lows now sets up the next major downside extension below 1.1000 towards the multi-year low from 2020 in the 1.0600 area. At this stage, it will take a push back above 1.1500 to force a shift in the outlook.EURUSD – fundamental overview
The Euro sunk to a fresh 2022 low in the aftermath of a more dovish leaning ECB decision. The central bank left rates on hold, while committing to continue bond buying in Q3. The ECB also went on to highlight significant risks associated with a Russian energy boycott on the Eurozone economy. Key standouts on today’s calendar come from UK retail sales, German, Eurozone, and UK PMI reads, the Eurozone current account, Canada retail sales and Canada producer prices.EURUSD - Technical charts in detail
GBPUSD – technical overview
The market is in a correction phase in the aftermath of the run to fresh multi-month highs in 2021. At this stage, additional setbacks should be limited to the 1.3000 area ahead of the next major upside extension towards a retest and break of critical resistance in the form of the 2018 high. Back above 1.3835 takes immediate pressure off the downside. Only a weekly close below 1.3000 will force a shift in the outlook.GBPUSD – fundamental overview
An impressive performance for the Pound this week, this after another round of hot inflation data and on a clear divergence between ECB and BOE policy in the aftermath of this latest ECB decision. Key standouts on today’s calendar come from UK retail sales, German, Eurozone, and UK PMI reads, the Eurozone current account, Canada retail sales and Canada producer prices.USDJPY – technical overview
The market has rocketed higher to its highest levels since 2002 after breaking through the 2015 high. Technical studies are however quite extended, with scope for a sizable correction in the weeks ahead.USDJPY – fundamental overview
The Yen continues to take its hits from the massive yield differential and monetary policy divergence between the BOJ and Fed. The BOJ has vowed to continue printing Yen and to keep up with easy monetary policy. The Yen has now traded to its lowest levels against the Buck in 20 years. Key standouts on today’s calendar come from UK retail sales, German, Eurozone, and UK PMI reads, the Eurozone current account, Canada retail sales and Canada producer prices.AUDUSD – technical overview
At this stage, the market has found a bottom and is trying to work back to the topside. Ultimately, it will take a weekly close back above 0.7600 to officially shift the focus back on the topside.AUDUSD – fundamental overview
The Australian Dollar has come under pressure into the end of the week, this mostly on the back of broad based reduction in global risk appetite. We also saw some selling on the lighter than expected Aussie jobs report. Key standouts on today’s calendar come from UK retail sales, German, Eurozone, and UK PMI reads, the Eurozone current account, Canada retail sales and Canada producer prices.USDCAD – technical overview
Signs of a major bottom in the works after a severe decline from the 2020 high. A recent weekly close back above 1.2500 encourages the constructive outlook and opens the door for a push back towards next critical resistance in the 1.3000 area. Any setbacks should be well supported into the 1.2200s.USDCAD – fundamental overview
The Canadian Dollar has outperformed relative to most of its peers this week, this after the Bank of Canada raised rates by 50 basis points and issued an accompanying hawkish communication. However, risk off flow into the end of week has turned things around and forced some profit taking on Canadian Dollar longs. Key standouts on today’s calendar come from UK retail sales, German, Eurozone, and UK PMI reads, the Eurozone current account, Canada retail sales and Canada producer prices.NZDUSD – technical overview
The market has been trending lower since topping out in 2021, making a series of lower highs and lower lows. Look for the latest recovery rally to set up the next lower top for a bearish continuation below 0.6500. Back above 0.7200 would be required to negate and force a shift in the structure.NZDUSD – fundamental overview
The New Zealand Dollar has come under pressure into the end of the week on softer local data and a reduction in global risk appetite. Earlier this week, the currency was sold despite a 50bp rate hike from the RBNZ, with the central bank offsetting the hawkish move with a dovish communication. Key standouts on today’s calendar come from UK retail sales, German, Eurozone, and UK PMI reads, the Eurozone current account, Canada retail sales and Canada producer prices.US SPX 500 – technical overview
Longer-term technical studies are in the process of unwinding from extended readings off record highs. Look for rallies to be well capped in favor of lower tops and lower lows. Back above 4,700 will be required at a minimum to take the immediate pressure off the downside.US SPX 500 – fundamental overview
With so little room for additional central bank accommodation, given an already depressed interest rate environment, the prospect for sustainable runs to the topside on easy money policy incentives and government stimulus, should no longer be as enticing to investors. Meanwhile, ongoing worry associated with coronavirus fallout, rising inflation, and geopolitical tension should weigh more heavily on investor sentiment in Q2 2022.GOLD (SPOT) – technical overview
The 2019 breakout above the 2016 high at 1375 was a significant development, opening the door for fresh record highs. Setbacks should now be well supported above 1900.GOLD (SPOT) – fundamental overview
The yellow metal continues to be well supported on dips with solid demand from medium and longer-term accounts. These players are more concerned about exhausted monetary policy, extended global equities, coronavirus fallout, inflation risk, and geopolitical tension. All of this should keep the commodity well supported, with many market participants also fleeing to the hard asset as the grand dichotomy of record high equities and record low yields comes to an unnerving climax.