


Today’s report: Sentiment sours into end of week
Investors tried their best to prop up risk assets this week after some intense selling in the previous week. But as this week moved along, keeping risk assets propped up proved to be too much of a challenge, with stocks trading right back down towards last week’s low.
Wake-up call
- business confidence
- UK CBI
- Japanese inflation
- Rate market
- since May
- retail sales
- inflation risk
- Dealers report
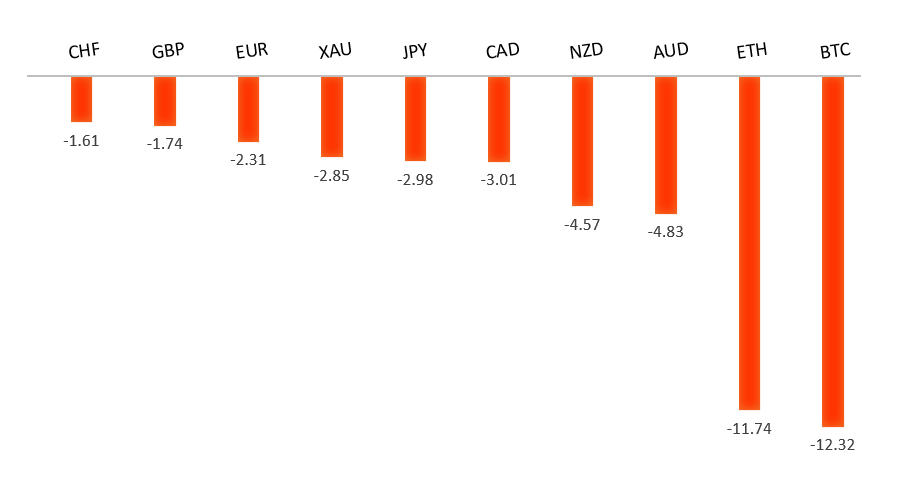
Peformance chart: 30 Day Performance vs. US dollar (%)
Suggested reading
- Who Has the Weakest Banks — the US or China?, S. Ren, Bloomberg (August 23, 2023)
- Inside the UK ‘Jungle Farm’ that Grows Thai Vegetables, D. Garrahan, Financial Times (August 23, 2023)
Chart talk: Technical & fundamental highlights
Choose pair:
EURUSD – technical overview
The Euro remains well supported on dips following a run to the topside through 1.1000. Any additional setbacks should be well supported ahead of 1.0500 in favor of a bullish continuation. Ultimately, only a monthly close back below 1.0500 would give reason for concern. Next key resistance comes in the form of the 2023 high at 1.1276.EURUSD – fundamental overview
The Euro remains under pressure into the end of the week. French business confidence reads came in soft, printing a post pandemic low. Key standouts on Friday’s calendar come from German GDP, German Ifo reads, US Michigan sentiment, and a Fed Powell speech from Jackson Hole.EURUSD - Technical charts in detail
GBPUSD – technical overview
Signs have emerged of the market wanting to put in a longer-term base after collapsing to a record low in September 2022. The November 2022 monthly close back above 1.2000 strengthens this prospect. Any setbacks should now be well supported ahead of 1.2500. Next key resistance comes in at 1.3143.GBPUSD – fundamental overview
The Pound underperformed for a second consecutive day, this after CBI numbers were awful. Key standouts on Friday’s calendar come from German GDP, German Ifo reads, US Michigan sentiment, and a Fed Powell speech from Jackson Hole.USDJPY – technical overview
At this stage, it looks like the market is wanting to resume the bigger picture uptrend and head back towards a retest of that multi-year high from October 2022 up at 151.95. Look for any weakness to continue to be well supported on dips.USDJPY – fundamental overview
JGB yields were in retreat mode on Thursday which accounted for renewed selling in the Yen. Key standouts on Friday’s calendar come from Japan inflation reads, German GDP, German Ifo reads, US Michigan sentiment, and a Fed Powell speech from Jackson Hole.AUDUSD – technical overview
There are signs of the potential formation of a longer-term base following the late 2022 surge back above 0.6500. Next key resistance comes in at 0.7284. Setbacks should continue to be well supported ahead of 0.6300. Only a monthly close below 0.6400 would give reason for rethink.AUDUSD – fundamental overview
The Australian Dollar was hammered in a risk off Thursday day of trade. The local rate market is now pricing an RBA pause in September. Key standouts on Friday’s calendar come from German GDP, German Ifo reads, US Michigan sentiment, and a Fed Powell speech from Jackson Hole.USDCAD – technical overview
Above 1.3000 signals an end to a period of longer-term bearish consolidation and suggests the market is in the process of carving out a more significant longer-term base. Next key resistance now comes in up into the 1.4000 area. Setbacks should be very well supported down into the 1.3000 area.USDCAD – fundamental overview
The Canadian Dollar closed out Thursday at its weakest level since May. Falling commodities prices and a declining US equities were seen as the primary drivers of the Canadian Dollar weakness. Key standouts on Friday’s calendar come from German GDP, German Ifo reads, US Michigan sentiment, and a Fed Powell speech from Jackson Hole.NZDUSD – technical overview
Overall pressure remains on the downside with the market once again stalling out on a run up into the 0.6500 area. Ultimately, a break back above 0.6577 would be required to take the immediate pressure off the downside. A monthly close below 0.6000 would intensify bearish price action.NZDUSD – fundamental overview
The market is still feeling the impact of the softer than expected New Zealand retail sales data earlier in the week. This in conjunction with a heavy round of Thursday risk liquidation have kept the Kiwi rate weighed down near yearly lows. Key standouts on Friday’s calendar come from German GDP, German Ifo reads, US Michigan sentiment, and a Fed Powell speech from Jackson Hole.US SPX 500 – technical overview
Longer-term technical studies are in the process of unwinding from extended readings off record highs. Look for rallies to be well capped in favor of lower tops and lower lows. A monthly close back above 4600 will be required to take the immediate pressure off the downside. Next key support comes in at 4328.US SPX 500 – fundamental overview
We've finally reached a point in the cycle where the Fed recognizes unanchored inflation expectations pose a greater downside risk than over-tightening. This is significant, as it means less investor friendly monetary policy. Overall, we expect inflation to continue to be a problem in 2023 that results in downside pressure into rallies despite market expectations that would argue otherwise.GOLD (SPOT) – technical overview
The 2019 breakout above the 2016 high at 1375 was a significant development, opening the door for fresh record highs. Setbacks should now be well supported above 1600 on a monthly close basis ahead of the next major upside extension. Next major resistance comes in at 2100, above which opens the next extension towards 2500.GOLD (SPOT) – fundamental overview
The yellow metal continues to be well supported on dips with solid demand from medium and longer-term accounts. These players are more concerned about inflation risk and a less upbeat global growth outlook. All of this should keep the commodity well supported, with many market participants also fleeing to the hard asset as the grand dichotomy of record high equities and record low yields comes to an unnerving climax.