


Today’s report: Some relief from below forecast US inflation
There hasn’t been any real positive progress around the war and the market continues to worry about stagflation risk. But the fact that US inflation data managed to come in below forecast has been helping sentiment just a bit into Wednesday.
Wake-up call
- dead end
- employment data
- economic outlook
- household spending
- policy decision
- RBNZ hike
- Stocks vulnerable
- Dealers report
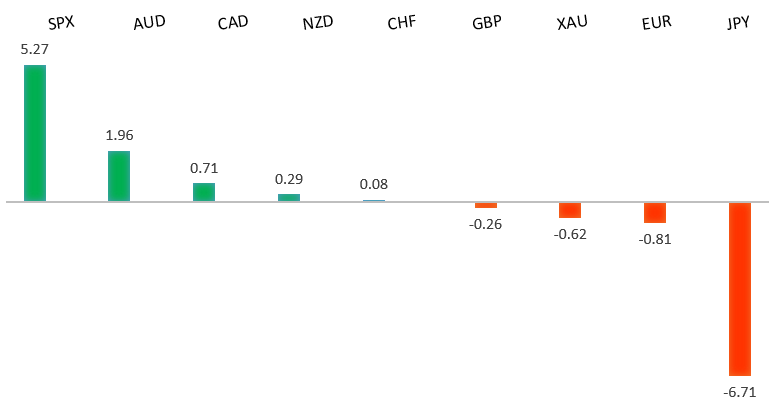
Peformance chart: 30 Day Performance vs. US dollar (%)
Suggested reading
- Is There a Market Upside to China’s Covid Lockdowns?, S. Ren, Bloomberg (April 13, 2022)
- Upcycled Food is on the Up, J. Evans, Financial Times (April 13, 2022)
Chart talk: Technical & fundamental highlights
Choose pair:
EURUSD – technical overview
A recent breakdown below 1.1100 to fresh multi-month lows now sets up the next major downside extension below 1.1000 towards the multi-year low from 2020 in the 1.0600 area. At this stage, it will take a push back above 1.1500 to force a shift in the outlook.EURUSD – fundamental overview
The Euro didn't do well with the news of Russia's Putin calling Ukraine talks at a dead end. Meanwhile, German ZEW reads were back at pandemic lows. Key standouts on today’s calendar come from UK inflation reads, US producer prices, and the Bank of Canada policy decision.EURUSD - Technical charts in detail
GBPUSD – technical overview
The market is in a correction phase in the aftermath of the run to fresh multi-month highs in 2021. At this stage, additional setbacks should be limited to the 1.3000 area ahead of the next major upside extension towards a retest and break of critical resistance in the form of the 2018 high. Back above 1.3835 takes immediate pressure off the downside. Only a weekly close below 1.3000 will force a shift in the outlook.GBPUSD – fundamental overview
Most of the Pound weakness we've been seeing is more about US Dollar strength than anything else. The Fed has been pushing ahead with a more aggressive policy normalization track and this has opened broad based USD demand. We did however see some attempts at buying into dips on the back of better than expected UK employment data. Key standouts on today’s calendar come from UK inflation reads, US producer prices, and the Bank of Canada policy decision.USDJPY – technical overview
The market has rocketed higher to fresh multi-month highs and is now staring at a retest of the critical peak from 2015 up ahead of 126.00. Technical studies are however quite extended, with scope for a sizable correction in the weeks ahead.USDJPY – fundamental overview
The Yen continues to take its hits from the massive yield differential and monetary policy divergence between the BOJ and Fed. The latest economic downgrade from the BOJ has only further exacerbated the Yen outlook. Key standouts on today’s calendar come from UK inflation reads, US producer prices, and the Bank of Canada policy decision.AUDUSD – technical overview
At this stage, the market has found a bottom and is trying to work back to the topside. Ultimately, it will take a weekly close back above 0.7600 to officially shift the focus back on the topside.AUDUSD – fundamental overview
The Australian Dollar managed to outperform on Tuesday, this after an impressive household spending number and a concurrent surge in commodities prices. Key standouts on today’s calendar come from UK inflation reads, US producer prices, and the Bank of Canada policy decision.USDCAD – technical overview
Signs of a major bottom in the works after a severe decline from the 2020 high. A recent weekly close back above 1.2500 encourages the constructive outlook and opens the door for a push back towards next critical resistance in the 1.3000 area. Any setbacks should be well supported into the 1.2200s.USDCAD – fundamental overview
The Canadian Dollar has fallen victim to broad based US Dollar demand from US yields and on the back of the concurrent wave of risk off flow. Much of the focus today will be on the latest Bank of Canada decision in which the central bank could go ahead with a 50bp hike. Key standouts on today’s calendar come from UK inflation reads, US producer prices, and the Bank of Canada policy decision.NZDUSD – technical overview
The market has been trending lower since topping out in 2021, making a series of lower highs and lower lows. Look for the latest recovery rally to set up the next lower top for a bearish continuation below 0.6500. Back above 0.7200 would be required to negate and force a shift in the structure.NZDUSD – fundamental overview
The New Zealand Dollar wasn't able to hold gains from the RBNZ's 50bp rate hike, this after the hike was accompanied by a dovish communication. Overall the New Zealand Dollar has been weaker in recent sessions as risk comes off and as the US Dollar is broadly bid on rising US yields. Key standouts on today’s calendar come from UK inflation reads, US producer prices, and the Bank of Canada policy decision.US SPX 500 – technical overview
Longer-term technical studies are in the process of unwinding from extended readings off record highs. Look for rallies to be well capped in favor of lower tops and lower lows. Back above 4,700 will be required at a minimum to take the immediate pressure off the downside.US SPX 500 – fundamental overview
With so little room for additional central bank accommodation, given an already depressed interest rate environment, the prospect for sustainable runs to the topside on easy money policy incentives and government stimulus, should no longer be as enticing to investors. Meanwhile, ongoing worry associated with coronavirus fallout, rising inflation, and geopolitical tension should weigh more heavily on investor sentiment in Q2 2022.GOLD (SPOT) – technical overview
The 2019 breakout above the 2016 high at 1375 was a significant development, opening the door for fresh record highs. Setbacks should now be well supported above 1900.GOLD (SPOT) – fundamental overview
The yellow metal continues to be well supported on dips with solid demand from medium and longer-term accounts. These players are more concerned about exhausted monetary policy, extended global equities, coronavirus fallout, inflation risk, and geopolitical tension. All of this should keep the commodity well supported, with many market participants also fleeing to the hard asset as the grand dichotomy of record high equities and record low yields comes to an unnerving climax.