


Next 24 hours: Inflation data continues to be a major headache for the Fed
Today’s report: Stocks lower ahead of Q2 earnings
While the Euro did indeed finally drop down to test parity on Tuesday, the ability for the single currency to avoid crashing below the barrier was actually quite impressive when considering the horrid German and Eurozone ZEW reads.
Wake-up call
- Option related
- Heathrow headlines
- producer prices
- global sentiment
- BoC decision
- RBNZ decision
- Stocks vulnerable
- Dealers report
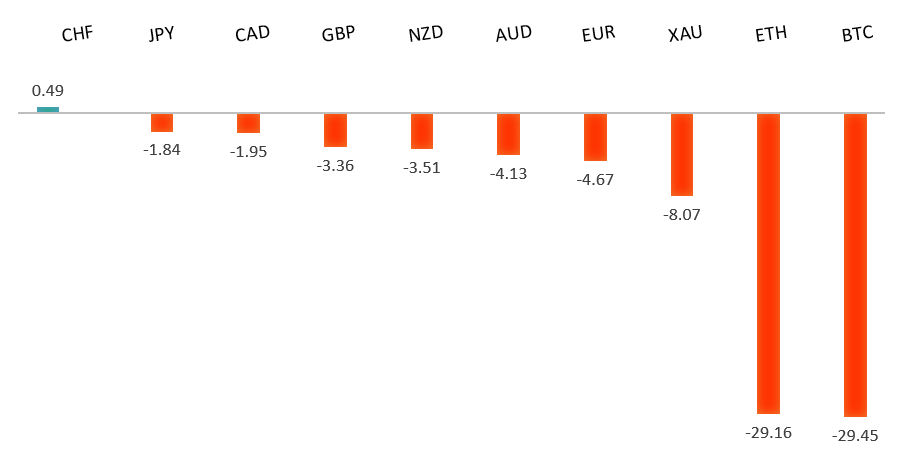
Peformance chart: 30 Day Performance vs. US dollar (%)
Suggested reading
- Housing Inventories May Not Save Prices After All, J. Levin, Bloomberg (July 12, 2022)
- The Ongoing Battle to Defeat Crypto Thieves, H. Murphy, Financial Times (July 5, 2022)
Chart talk: Technical & fundamental highlights
Choose pair:
EURUSD – technical overview
The market has come under intense pressure in recent months, with setbacks accelerating below the critical multi-year low from 2017 at 1.0340. This sets up a test of monumental support in the form of parity. At the same time, technical studies are tracking in oversold territory, suggesting additional setbacks should be limited. Back above 1.0500 would be required to take the immediate pressure off the downside.EURUSD – fundamental overview
We likely saw some option inspired price action on Tuesday, with the Euro kissing parity before bouncing off the massive level. The latest downside price action was helped along after German and Eurozone ZEW reads came in well below expectation. Key standouts on today’s calendar come from the RBNZ policy decision, China trade, German inflation, UK industrial production, trade, and GDP, Eurozone industrial production, US inflation, the Bank of Canada policy decision, and the Fed Beige Book.EURUSD - Technical charts in detail
GBPUSD – technical overview
The market continues to be exceptionally well supported on dips below 1.2000. Unless we see a monthly close below 1.2000, we expect this to continue to be the case. Look for a break back above 1.2200 to take the immediate pressure off the downside.GBPUSD – fundamental overview
We've already seen the Pound suffer from policy divergence between the BOE and Fed, and we've already seen downside pressure from political uncertainty. Throw in more downside pressure this week on the headlines out of Heathrow that it will impose a cap of 100k daily departures, while asking airlines to stop selling summer tickets. Key standouts on today’s calendar come from the RBNZ policy decision, China trade, German inflation, UK industrial production, trade, and GDP, Eurozone industrial production, US inflation, the Bank of Canada policy decision, and the Fed Beige Book.USDJPY – technical overview
The market has rocketed higher to its highest levels since 1998 after breaking through the 2002 high. Technical studies are however looking stretched, with scope for a sizable consolidation and correction in the weeks ahead. Look for additional upside from here to be well capped ahead of 140.00. A break back below 134.00 would take the immediate pressure off the topside.USDJPY – fundamental overview
The combination of hotter Japan producer prices and comments from finance minister Suzuki that FX rates are being monitored with a strong sense of urgency, was enough of a combination to open some well overdue demand for the beaten down Yen. Key standouts on today’s calendar come from the RBNZ policy decision, China trade, German inflation, UK industrial production, trade, and GDP, Eurozone industrial production, US inflation, the Bank of Canada policy decision, and the Fed Beige Book.AUDUSD – technical overview
Overall pressure remains on the downside and conditions remain quite choppy. A break back above 0.7070 would be required at a minimum to take the immediate pressure off the downside. Until then, scope exists for deeper setbacks towards 0.6500.AUDUSD – fundamental overview
Most of the latest slide to fresh yearly lows in the Australian Dollar has come from renewed worry around the coronavirus in China. Meanwhile, a sharp decline in the price of iron oil has also contributed to the Aussie weakness. Key standouts on today’s calendar come from the RBNZ policy decision, China trade, German inflation, UK industrial production, trade, and GDP, Eurozone industrial production, US inflation, the Bank of Canada policy decision, and the Fed Beige Book.USDCAD – technical overview
A recent surge back above 1.3000 signals an end to a period of bearish consolidation and suggests the market is in the process of carving out a more significant longer-term base. Next key resistance now comes in up into the 1.3500 area. Setbacks should be very well supported down into the 1.2500 area.USDCAD – fundamental overview
While the Canadian Dollar has suffered against the US Dollar in recent sessions, the Loonie has held up well against its peers on account of supported oil prices. All eyes now on today's Bank of Canada policy decision where the central bank is expected to raise rates by 75 basis points. Other key standouts on today’s calendar come from the RBNZ policy decision, China trade, German inflation, UK industrial production, trade, and GDP, Eurozone industrial production, US inflation, and the Fed Beige Book.NZDUSD – technical overview
Overall pressure remains on the downside and conditions remain quite choppy. A break back above 0.6400 would be required to force a shift in the structure and suggest we are seeing a more significant bullish reversal. Until then, scope exists for fresh yearly lows and a retest of the major psychological barrier at 0.6000.NZDUSD – fundamental overview
The New Zealand Dollar has extended declines to a fresh yearly low this week, this on the back of ongoing monetary policy divergence with the FOMC and broad based risk off flow. The market will now settle in and digest the latest RBNZ decision due today. The expectation is the central bank will go ahead and hike 50 basis points. Key standouts on today’s calendar come from the RBNZ policy decision, China trade, German inflation, UK industrial production, trade, and GDP, Eurozone industrial production, US inflation, the Bank of Canada policy decision, and the Fed Beige Book.US SPX 500 – technical overview
Longer-term technical studies are in the process of unwinding from extended readings off record highs. Look for rallies to be well capped in favor of lower tops and lower lows. Back above 4,206 will be required at a minimum to take the immediate pressure off the downside. Next major support comes in around 3,400.US SPX 500 – fundamental overview
With so little room for additional central bank accommodation, given an already depressed interest rate environment, the prospect for sustainable runs to the topside on easy money policy incentives and government stimulus, should no longer be as enticing to investors. Meanwhile, ongoing worry associated with rising inflation and slower growth should continue to weigh more heavily on investor sentiment in 2022.GOLD (SPOT) – technical overview
The 2019 breakout above the 2016 high at 1375 was a significant development, opening the door for fresh record highs. Setbacks should now be well supported above 1700.GOLD (SPOT) – fundamental overview
The yellow metal continues to be well supported on dips with solid demand from medium and longer-term accounts. These players are more concerned about exhausted monetary policy, extended global equities, and inflation risk. All of this should keep the commodity well supported, with many market participants also fleeing to the hard asset as the grand dichotomy of record high equities and record low yields comes to an unnerving climax.