


Next 24 hours: Taper tantrum
Today’s report: Tough spot for the Fed
It’s certainly getting uglier out there. And while the Fed has been able to keep the party going for 13 years or so, that party could be getting very close to coming to an end.
Wake-up call
- Inflation gap
- UK data
- risk off
- Iron ore
- Hot inflation
- NZDUSD Lockdown measures hit Kiwi hard
- Stocks vulnerable
- Dealers report
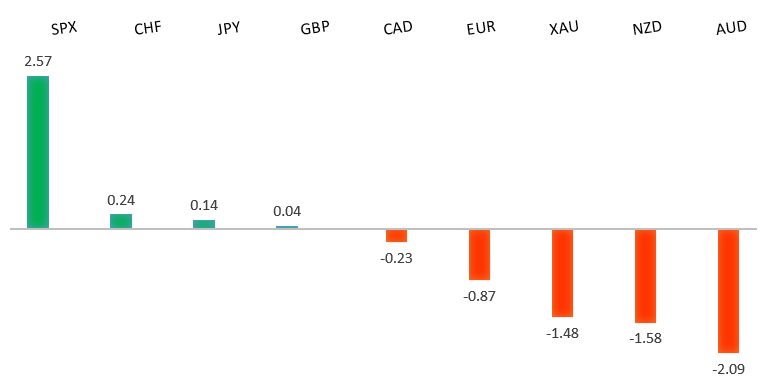
Peformance chart: 30 Day Performance vs. US dollar (%)
Suggested reading
- Covid Fear Is Back in Markets, and It's Global, J. Authers, Bloomberg (August 18, 2021)
- Yellen's Chance to Shape Fed From Outside, J. Smialek, Bloomberg (August 16, 2021)
Chart talk: Technical & fundamental highlights
Choose pair:
EURUSD – technical overview
The market has been looking for a higher low since topping out in 2021 up at 1.2350. Ideally, setbacks continue to be well supported down towards 1.1600 in favour of the next major upside extension back through 1.2350 and towards a retest of the 2018 high at 1.2555 further up. Only a weekly close below 1.1600 would force a rethink.EURUSD – fundamental overview
The Euro extended declines against the Buck to a fresh yearly low on Wednesday. Softer Eurozone construction output and yield differentials moving in the Buck's favor on account of flight to safety were the primary drivers of the flow. Key standouts on today’s calendar come in the form of Aussie employment, the Eurozone current account, Canada ADP employment, US initial jobless claims, and the Philly Fed.EURUSD - Technical charts in detail
GBPUSD – technical overview
The market is in a corrective phase in the aftermath of the run to fresh 2021 and multi-month highs. At this stage, additional setbacks should be limited to the 1.3500 area ahead of the next major upside extension towards a retest and break of critical resistance in the form of the 2018 high.GBPUSD – fundamental overview
The Pound hasn't been immune to broad based US Dollar demand as flight to safety and pressure on the Fed to taper mounts, in response to rising inflation. At the same time, the Pound has held up better than most, getting help from this week's UK data highlighted by a solid employment report and this latest rise in house prices. Key standouts on today’s calendar come in the form of Aussie employment, the Eurozone current account, Canada ADP employment, US initial jobless claims, and the Philly Fed.USDJPY – technical overview
The longer-term trend is bearish despite the recent run higher. Look for additional upside to be limited, with scope for a topside failure and bearish resumption back down towards the 100.00 area. It would take a clear break back above 113.00 to negate the outlook.USDJPY – fundamental overview
The Yen has come under pressure from this latest wave of broad based US Dollar demand. Though the fact that a lot of this demand is also tied to flight to safety flow, has prevented the Buck from running too far and fast against the Yen. Key standouts on today’s calendar come in the form of Aussie employment, the Eurozone current account, Canada ADP employment, US initial jobless claims, and the Philly Fed.AUDUSD – technical overview
The Australian Dollar has been in the process of a healthy correction following the impressive run towards a retest of the 2018 high earlier this year. At this stage, there is risk for additional declines, though setbacks are expected to be well supported down into the 0.7000 area.AUDUSD – fundamental overview
The Australian Dollar has extended it yearly low against the Buck, this on broad based US Dollar demand from risk off flow, along with slumping iron ore prices and softer Aussie data. We've seen a real turnaround in RBA rate expectations as well, only adding further fuel to the Aussie bearishness. Key standouts on today’s calendar come in the form of Aussie employment, the Eurozone current account, Canada ADP employment, US initial jobless claims, and the Philly Fed.USDCAD – technical overview
Finally signs of a major bottom in the works after a severe decline from the 2020 high. The weekly close back above 1.2500 encourages the constructive outlook and opens the door for a push back towards next critical resistance in the 1.3000 area. Any setbacks should be well supported into the 1.2200s.USDCAD – fundamental overview
Inflation data out of Canada came in hotter than expected on Wednesday, though this didn't do anything to help the Canadian Dollar. High beta currencies have come under pressure as risk off intensifies, with this flow trumping any demand we would otherwise see for the Loonie on the back of the rising inflation reads. Key standouts on today’s calendar come in the form of Aussie employment, the Eurozone current account, Canada ADP employment, US initial jobless claims, and the Philly Fed.NZDUSD – technical overview
The market has entered a period of consolidation after running up to a yearly and multi-month high. At this stage, there is still room for deeper setbacks into the 0.6500-0.6800 area before we see an attempt at a higher low and resumption of upside pressure.NZDUSD – fundamental overview
All of this risk off flow and all of this renewed worry around COVID in New Zealand has forced the RBNZ to reconsider its rate hike outlook, and this in turn has resulted in a massive drag on the New Zealand Dollar to fresh yearly lows against the Buck. Key standouts on today’s calendar come in the form of Aussie employment, the Eurozone current account, Canada ADP employment, US initial jobless claims, and the Philly Fed.US SPX 500 – technical overview
Longer-term technical studies are looking quite exhausted and the market is showing signs of wanting to roll over after racing to another record high. Look for rallies to be well capped ahead of 4500, with a break back below 4139 to strengthen the outlook.US SPX 500 – fundamental overview
We're trading just off fresh record highs, and yet, with so little room for additional central bank accommodation, given an already depressed interest rate environment, the prospect for sustainable runs to the topside on easy money policy incentives and government stimulus, should no longer be as enticing to investors. Meanwhile, ongoing worry associated with coronavirus fallout and risk of rising inflation should weigh more heavily on investor sentiment into the second half of 2021.GOLD (SPOT) – technical overview
The 2019 breakout above the 2016 high at 1375 was a significant development, opening the door for fresh record highs and an acceleration beyond the next major psychological barrier at 2000. Setbacks should now be well supported above 1600.GOLD (SPOT) – fundamental overview
The yellow metal continues to be well supported on dips with solid demand from medium and longer-term accounts. These players are more concerned about exhausted monetary policy, extended global equities, and coronavirus fallout. All of this should keep the commodity well supported, with many market participants also fleeing to the hard asset as the grand dichotomy of record high equities and record low yields comes to an unnerving climax.