


Next 24 hours: ECB decision and US tariff updates
Today’s report: US Dollar extends decline
The market is perhaps feeling a little better about the global trade outlook, taking a chance that a lot of what has been coming out of the White House is more about negotiation tactics to ultimately arrive at a less extreme outcome. Meanwhile, US economic data has not been great of late.
Wake-up call
- defense spending
- BOE Greene
- Asset management
- trade balance
- Trade deal
- macro flows
- Trump policies
- Macro themes
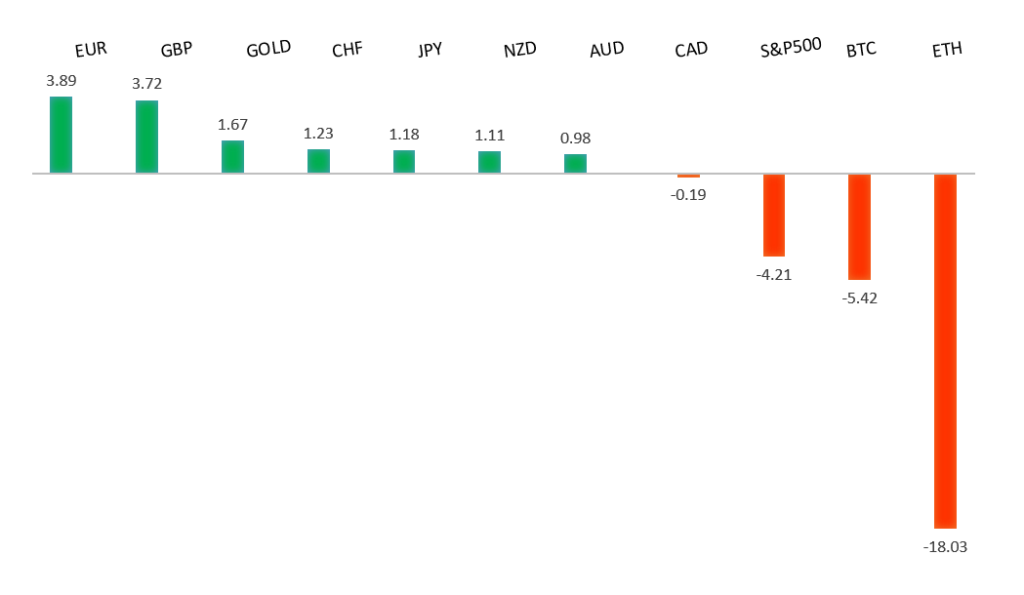
Peformance chart: 30-Day Performance vs. US dollar (%)
Suggested reading
- Could Emerging-Markets Stocks Outperform US Stocks?, D. Lefkovitz, US News (March 5, 2025)
- Scaled Properly, Tariffs Aren't As Big As You Think, Fisher Investments (March 4, 2025)
Chart talk: Technical & fundamental highlights
Choose pair:
EURUSD – technical overview
The Euro has been in a multi-month consolidation since bottoming out in 2022. Setbacks have since been exceptionally well supported on dips towards parity, with a higher platform sought out ahead of the next major upside extension. Look for a push back towards the 2023 high at 1.1276 in the days ahead. Only a monthly close below 1.0000 negates.EURUSD – fundamental overview
The Euro has continued with its impressive run higher on the back of Europe's fiscal defense spending initiative and discouraging US jobs data. Key standouts on Thursday’s calendar come from German, Eurozone, and UK construction PMIs, Eurozone retail sales, the ECB policy decision, Canada trade, US trade, initial jobless claims, Canada Ivey PMIs, BOE speak, and Fed speak.EURUSD - Technical charts in detail
GBPUSD – technical overview
Signs have emerged of the market wanting to put in a longer-term base after collapsing to a record low in September 2022. The door is now open for the next major upside extension towards the 2018 high at 1.4377. Setbacks should be well supported above 1.2000 on a monthly close basis.GBPUSD – fundamental overview
The Pound got a nice boost from BOE Greene who indicated the central bank's policy remains restrictive. Key standouts on Thursday’s calendar come from German, Eurozone, and UK construction PMIs, Eurozone retail sales, the ECB policy decision, Canada trade, US trade, initial jobless claims, Canada Ivey PMIs, BOE speak, and Fed speak.USDJPY – technical overview
The market is looking to resume the longer-term uptrend after an intense correction in 2024. A higher low is ideally sought out above 140.00 in favor of a bullish continuation. The October monthly close back above 150.00 strengthens the case for longer-term uptrend resumption.USDJPY – fundamental overview
The Yen continues to benefit from hawkish BOJ rhetoric, shifting Fed expectations and broad based US Dollar selling. A call from BNP Paribas Asset Management of 130.00 USDJPY is also having an impact. Key standouts on Thursday’s calendar come from German, Eurozone, and UK construction PMIs, Eurozone retail sales, the ECB policy decision, Canada trade, US trade, initial jobless claims, Canada Ivey PMIs, BOE speak, and Fed speak.AUDUSD – technical overview
There are signs of the potential formation of a longer-term base with the market trading down into a meaningful longer-term support zone. Only a monthly close below 0.6000 would give reason for rethink. A monthly close back above 0.7000 will take the big picture pressure off the downside and strengthen case for a bottom.AUDUSD – fundamental overview
A run of broad based US Dollar outflows has been accompanied by a round of better than expected Aussie data in the form of trade and building permits. This has added to Aussie demand after the currency was also already getting support from yesterday's solid GDP print. Key standouts on Thursday’s calendar come from German, Eurozone, and UK construction PMIs, Eurozone retail sales, the ECB policy decision, Canada trade, US trade, initial jobless claims, Canada Ivey PMIs, BOE speak, and Fed speak.USDCAD – technical overview
A sustained hold above 1.3000 over the past several months signals an end to a period of longer-term bearish consolidation and suggests the market is in the process of carving out a more significant longer-term base. Next key resistance now comes in at the 1.5000 psychological barrier. Setbacks should be very well supported ahead of 1.4000.USDCAD – fundamental overview
The Canadian Dollar is feeling better about the trade outlook after the US commerce secretary offered up some words of reassurance about the prospect for a deal. Key standouts on Thursday’s calendar come from German, Eurozone, and UK construction PMIs, Eurozone retail sales, the ECB policy decision, Canada trade, US trade, initial jobless claims, Canada Ivey PMIs, BOE speak, and Fed speak.NZDUSD – technical overview
Overall pressure remains on the downside with the market continuing to stall out on runs up into the 0.6500 area. At the same time, there are some signs of the market wanting to put in a longer-term base. Ultimately, a break back above 0.6500 would be required to take the medium-term pressure off the downside and encourage this prospect. A monthly close below 0.5469 will intensify bearish price action.NZDUSD – fundamental overview
The New Zealand Dollar has been better bid on the back of broad based US Dollar outflows and an uptick in global risk sentiment. Key standouts on Thursday’s calendar come from German, Eurozone, and UK construction PMIs, Eurozone retail sales, the ECB policy decision, Canada trade, US trade, initial jobless claims, Canada Ivey PMIs, BOE speak, and Fed speak.US SPX 500 – technical overview
The longer term uptrend remains intact and dips continue to be exceptionally well supported. Critical support comes in at 5770, with only a break back below this level to compromise the structure and open the door for a more significant corrective decline. Until then, the focus remains on a continued push to fresh record highs.US SPX 500 – fundamental overview
Going forward, it will be important to keep an eye on Trump trade policies, inflation, bigger picture economic data and the Fed policy outlook. Any of these variables are capable of easily ruffling some feathers and we've already seen a little of this as 2025 gets going.GOLD (SPOT) – technical overview
The 2019 breakout above the 2016 high at 1375 was a significant development, opening the door for fresh record highs and this next major upside extension into the 3000 area. Setbacks should now be well supported above 2500 on a monthly close basis.GOLD (SPOT) – fundamental overview
The yellow metal has pushed record highs in recent months with solid demand from medium and longer-term accounts. These players are more concerned about inflation, geopolitical risk and a less upbeat global growth outlook. All of this should keep the commodity well supported over the coming months.