


Next 24 hours: Goldman shaves US recession probability
Today’s report: US Dollar weakness intensifies
The US Dollar has come back under notable pressure in recent sessions. There are a number of possible drivers of the price action, mostly positive. For the most part, we’ve seen a healthy uptick in investor risk appetite, helped along by this latest solid round of US economic data. Absence of first tier data ahead will leave the focus on bigger picture themes.
Wake-up call
- trade surplus
- retail sales
- Nikkei erases
- RBA Bullock
- local data
- manufacturing survey
- Fed outlook
- Macro themes
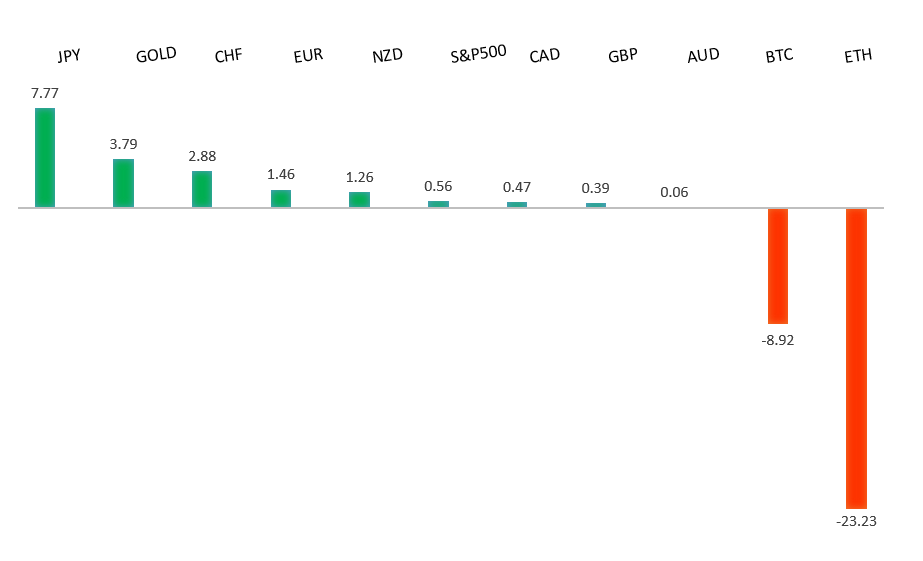
Peformance chart: 30-Day Performance vs. US dollar (%)
Suggested reading
- AI power demand could stifle industry's growth, M. McCormick, Financial Times (August 19, 2024)
- Five Big Questions for the Fed at Jackson Hole, B. Dudley, Bloomberg (August 16, 2024)
Chart talk: Technical & fundamental highlights
Choose pair:
EURUSD – technical overview
The Euro has been in a multi-month consolidation since bottoming out in 2022. Setbacks have since been exceptionally well supported on dips below 1.0500, with a higher platform sought out ahead of the next major upside extension. Look for a push through the 2023 high at 1.1276 to strengthen the constructive outlook and extend the recovery run towards 1.2000. Only back below 1.0400 negates.EURUSD – fundamental overview
The Euro has extended its run of yearly highs against the Dollar, getting an added push on the back of an impressive Eurozone trade surplus for June. Meanwhile, the US Dollar was unsettled by the Harris proposal of price controls. Absence of first tier data on Monday’s calendar will leave the focus on bigger picture themes and flow.EURUSD - Technical charts in detail
GBPUSD – technical overview
Signs have emerged of the market wanting to put in a longer-term base after collapsing to a record low in September 2022. The door is now open for the next major upside extension towards the 2023 high at 1.3143. Any setbacks should be well supported ahead of 1.2500.GBPUSD – fundamental overview
UK retail sales came in on the stronger side, putting in a nice rebound from the previous print. Meanwhile, the US Dollar was unsettled by the Harris proposal of price controls. Absence of first tier data on Monday’s calendar will leave the focus on bigger picture themes and flow.USDJPY – technical overview
The market has entered a period of correction after extending the uptrend to a multi-year high through 160.00. Critical support comes in around 140.00, with only a monthly close below the barrier to compromise the bullish outlook. A higher low is ideally sought out above 140.00 in favor of a bullish continuation.USDJPY – fundamental overview
The Nikkei has all but erased the post-BOJ rate hike losses and the return to stability in markets has opened broad based US Dollar outflows, which has invited renewed Yen demand. Absence of first tier data on Monday’s calendar will leave the focus on bigger picture themes and flow.AUDUSD – technical overview
There are signs of the potential formation of a longer-term base with the market trading down into a meaningful longer-term support zone. Only a monthly close below 0.6200 would give reason for rethink. Back above 0.6900 will take the big picture pressure off the downside and strengthen case for a bottom.AUDUSD – fundamental overview
Risk appetite is looking healthy, commodities are well bid, and RBA Bullock has said it would be premature to consider rate cuts. With all that said, it's been no surprise to see the Australian Dollar well bid. Absence of first tier data on Monday’s calendar will leave the focus on bigger picture themes and flow.USDCAD – technical overview
A sustained hold above 1.3000 over the past several months signals an end to a period of longer-term bearish consolidation and suggests the market is in the process of carving out a more significant longer-term base. Next key resistance now comes in up into the 1.4000 area, with a break to open a retest of the 2020 high just ahead of 1.4700. Setbacks should be very well supported down into the 1.3000 area.USDCAD – fundamental overview
The Canadian Dollar has joined in on the currency gains against the Buck but has lagged notably. Downside pressure on the price of oil and a decline in Canada manufacturing sales have been behind the relative underperformance. Absence of first tier data on Monday’s calendar will leave the focus on bigger picture themes and flow.NZDUSD – technical overview
Overall pressure remains on the downside with the market continuing to stall out on runs up into the 0.6500 area. At the same time, there are some signs of the market wanting to put in a longer-term base. Ultimately, a break back above 0.6500 would be required to take the medium-term pressure off the downside and encourage this prospect. A monthly close below 0.5800 will intensify bearish price action.NZDUSD – fundamental overview
Risk appetite is looking healthy again while the latest New Zealand manufacturing survey has put in an impressive rebound, all of which helping to drive an impressive run higher in the New Zealand Dollar. Absence of first tier data on Monday’s calendar will leave the focus on bigger picture themes and flow.US SPX 500 – technical overview
The longer term uptrend remains intact and dips continue to be exceptionally well supported. Critical support comes in at 5093, with only a break back below this level to compromise the structure and open the door for a more significant corrective decline. Until then, the focus remains on a retest and break back above the record high.US SPX 500 – fundamental overview
Though we have seen a healthy adjustment of investor expectations towards the amount of rate cuts in 2024, the market still hopes policy will end up erring more towards the investor friendly, accommodative side of things. This bet has kept stocks well bid into dips and consistently pushing record highs. Still, if there is a sense the Fed will need to be more sensitive towards erring on the side of higher rates, it could invite a much bigger disruption to stocks than what we've already seen.GOLD (SPOT) – technical overview
The 2019 breakout above the 2016 high at 1375 was a significant development, opening the door for fresh record highs and this next major upside extension into the 2500-3000 area. Setbacks should now be well supported above 2200 on a monthly close basis.GOLD (SPOT) – fundamental overview
The yellow metal has pushed record highs in 2024 with solid demand from medium and longer-term accounts. These players are more concerned about inflation, geopolitical risk and a less upbeat global growth outlook. All of this should keep the commodity well supported, with many market participants also fleeing to the hard asset as the grand dichotomy of record high equities and record low yields comes to an end.