


Today’s report: US Jobs report coming up
It felt like the market didn’t want to commit in either direction on Thursday, perhaps wanting to take some time to hold up and reflect ahead of today’s US jobs report.
Wake-up call
- factory orders
- inflation risk
- risk appetite
- record surplus
- Oil rally
- US equities
- Stocks vulnerable
- Dealers report
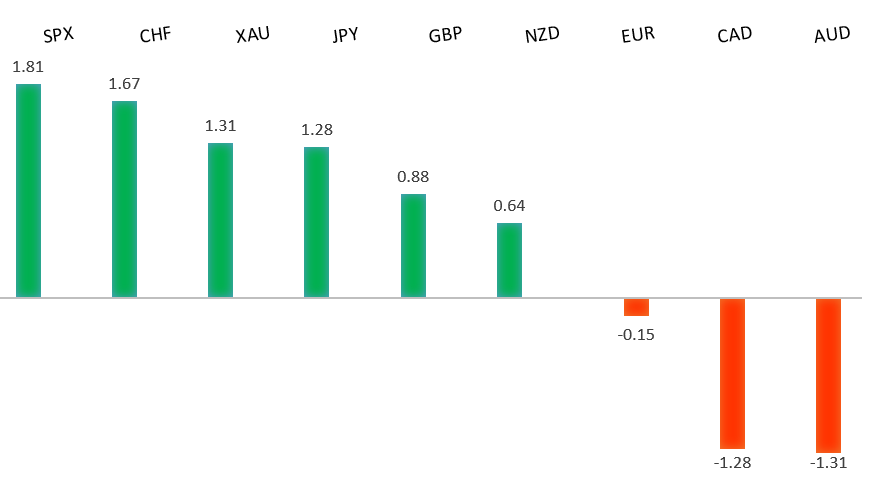
Peformance chart: 30 Day Performance vs. US dollar (%)
Suggested reading
- Betting Against the Ark ETFs Is Good for Cathie Wood, E. Balchunas, Bloomberg (August 5, 2021)
- Why Has Moving Become So Much More Expensive?, S. Allen, Forbes (August 3, 2021)
Chart talk: Technical & fundamental highlights
Choose pair:
EURUSD – technical overview
The market has been looking for a higher low since topping out in 2021 up at 1.2350. Ideally, setbacks continue to be well supported down towards 1.1600 in favour of the next major upside extension back through 1.2350 and towards a retest of the 2018 high at 1.2555 further up. Only a weekly close below 1.1600 would force a rethink.EURUSD – fundamental overview
German factory orders came in better than expected on Thursday and construction PMI data matched forecasts. Overall though, not much movement in the Euro. Key standouts on Friday’s calendar include German industrial production, a BOE Broadbent speech, Canada employment, Canada Ivey PMIs, and the US employment report.EURUSD - Technical charts in detail
GBPUSD – technical overview
The market is in a corrective phase in the aftermath of the run to fresh 2021 and multi-month highs. At this stage, additional setbacks should be limited to the 1.3500 area ahead of the next major upside extension towards a retest and break of critical resistance in the form of the 2018 high.GBPUSD – fundamental overview
The BOE left rates on hold as expected but acknowledged rising near-term inflationary pressures. This offset any downside pressure from the big miss on UK construction PMIs, with the concerns over rising inflation moving yield differentials in the Pound's favour. Key standouts on Friday’s calendar include German industrial production, a BOE Broadbent speech, Canada employment, Canada Ivey PMIs, and the US employment report.USDJPY – technical overview
The longer-term trend is bearish despite the recent run higher. Look for additional upside to be limited, with scope for a topside failure and bearish resumption back down towards the 100.00 area. It would take a clear break back above 113.00 to negate the outlook.USDJPY – fundamental overview
No major price action updates around the Yen on Thursday. We did learn that Japanese investors purchased net JPY225.6 billion in overseas debt last week versus net sellers at JPY 1083.0 billion previously. Most of the movement we have seen in recent sessions is around a lower Yen on supported US equities. Key standouts on Friday’s calendar include German industrial production, a BOE Broadbent speech, Canada employment, Canada Ivey PMIs, and the US employment report.AUDUSD – technical overview
The Australian Dollar has been in the process of a healthy correction following the impressive run towards a retest of the 2018 earlier this year. At this stage, there is risk for additional declines, though setbacks are expected to be well supported down into the 0.7000 area.AUDUSD – fundamental overview
A record surplus in Australia and ongoing demand for risk assets helped to drive Aussie outperformance on Thursday. Key standouts on Friday’s calendar include German industrial production, a BOE Broadbent speech, Canada employment, Canada Ivey PMIs, and the US employment report.USDCAD – technical overview
Finally signs of a major bottom in the works after a severe decline from the 2020 high. The weekly close back above 1.2500 encourages the constructive outlook and opens the door for a push back towards next critical resistance in the 1.3000 area. Any setbacks should be well supported into the 1.2200s.USDCAD – fundamental overview
Solid performance for the Canadian Dollar on Thursday with an unexpected rise in the trade surplus and push higher in the price of oil accounting for the Loonie demand. Key standouts on Friday’s calendar include German industrial production, a BOE Broadbent speech, Canada employment, Canada Ivey PMIs, and the US employment report.NZDUSD – technical overview
The market has entered a period of consolidation after running up to a yearly and multi-month high. At this stage, there is still room for deeper setbacks into the 0.6500-0.6800 area before we see an attempt at a higher low and resumption of upside pressure.NZDUSD – fundamental overview
The New Zealand Dollar held onto bullish momentum from Wednesday's strong jobs data and also kept up on the bid on account of well supported US equities. Key standouts on Friday’s calendar include German industrial production, a BOE Broadbent speech, Canada employment, Canada Ivey PMIs, and the US employment report.US SPX 500 – technical overview
Longer-term technical studies are looking quite exhausted and the market is showing signs of wanting to roll over after racing to another record high. Look for rallies to be well capped ahead of 4500, with a break back below 4139 to strengthen the outlook.US SPX 500 – fundamental overview
We're trading just off fresh record highs, and yet, with so little room for additional central bank accommodation, given an already depressed interest rate environment, the prospect for sustainable runs to the topside on easy money policy incentives and government stimulus, should no longer be as enticing to investors. Meanwhile, ongoing worry associated with coronavirus fallout and risk of rising inflation should weigh more heavily on investor sentiment into the second half of 2021.GOLD (SPOT) – technical overview
The 2019 breakout above the 2016 high at 1375 was a significant development, opening the door for fresh record highs and an acceleration beyond the next major psychological barrier at 2000. Setbacks should now be well supported above 1600.GOLD (SPOT) – fundamental overview
The yellow metal continues to be well supported on dips with solid demand from medium and longer-term accounts. These players are more concerned about exhausted monetary policy, extended global equities, and coronavirus fallout. All of this should keep the commodity well supported, with many market participants also fleeing to the hard asset as the grand dichotomy of record high equities and record low yields comes to an unnerving climax.