


Special report: Previewing Thursday's ECB Decision
Today’s report: Waiting for more clarity on US tariffs
Investor sentiment has taken a turn for the worse as it looks like the US tariffs on Canada, Mexico, and China will be moving forward as planned. All of this comes at a time when US economic data has been struggling a little more and US inflation indicators are showing signs of ticking back up.
Wake-up call
- healthy data
- FTSE Russell
- FinMin Mimura
- RBA Minutes
- US tariffs
- GDT auction
- Trump policies
- Macro themes
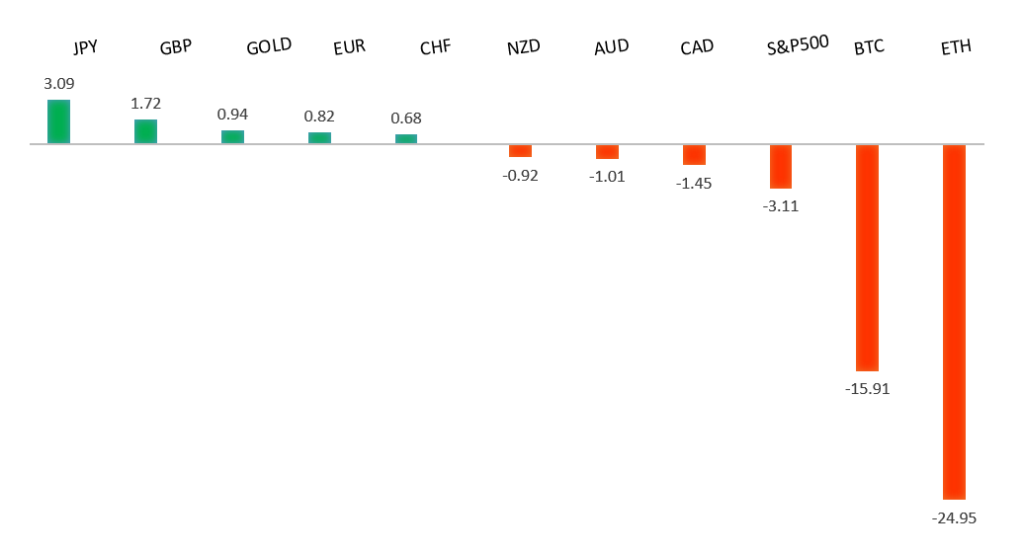
Peformance chart: 30-Day Performance vs. US dollar (%)
Suggested reading
- The weirdness around Trump’s Crypto Reserve announcement, A. Prokup, Vox (March 3, 2025)
- Time to buy Chinese stocks?, S. McBride, RiskHedge (February 28, 2025)
Chart talk: Technical & fundamental highlights
Choose pair:
EURUSD – technical overview
The Euro has been in a multi-month consolidation since bottoming out in 2022. Setbacks have since been exceptionally well supported on dips towards parity, with a higher platform sought out ahead of the next major upside extension. Look for a major bounce in the days ahead and the start to a push back towards the 2023 high at 1.1276. Only a monthly close below 1.0000 negates.EURUSD – fundamental overview
Eurozone and German manufacturing PMIs came in better than expected on Monday, while Eurozone inflation data was also hotter than forecast. The Euro was bid up on the back of this along with political developments in which European leaders stood as a unified front on the support of Ukraine. Key standouts on Tuesday’s calendar come from Eurozone unemployment, the New Zealand GDT auction, and some Fed speak.EURUSD - Technical charts in detail
GBPUSD – technical overview
Signs have emerged of the market wanting to put in a longer-term base after collapsing to a record low in September 2022. The door is now open for the next major upside extension towards the 2018 high at 1.4377. Setbacks should be well supported above 1.2000 on a monthly close basis.GBPUSD – fundamental overview
UK manufacturing PMIs came in better than forecast, which helped to prop up the Pound on Monday. Meanwhile, the FTSE Russell will look to attract new listings in the future by allowing equities that trade in EUR and USD to join UK benchmarks. Key standouts on Tuesday’s calendar come from Eurozone unemployment, the New Zealand GDT auction, and some Fed speak.USDJPY – technical overview
The market is looking to resume the longer-term uptrend after an intense correction in 2024. A higher low is ideally sought out above 140.00 in favor of a bullish continuation. The October monthly close back above 150.00 strengthens the case for longer-term uptrend resumption.USDJPY – fundamental overview
Economic data out of Japan continues to come in on the stronger side, which only reaffirms the BOJ's hawkish policy outlook that points to more rate hikes ahead. Meanwhile, Japan FinMin Mimura was on the wires saying "a weaker Yen could hinder gains in real wages, a key requirement for shoring up a positive cycle of rising prices, consumption and economic growth.” All of this has factored into the latest run of Yen demand. Key standouts on Tuesday’s calendar come from Eurozone unemployment, the New Zealand GDT auction, and some Fed speak.AUDUSD – technical overview
There are signs of the potential formation of a longer-term base with the market trading down into a meaningful longer-term support zone. Only a monthly close below 0.6000 would give reason for rethink. A monthly close back above 0.7000 will take the big picture pressure off the downside and strengthen case for a bottom.AUDUSD – fundamental overview
Earlier today, Aussie retail sales rebounded, though this was offset by weaker consumer confidence and inflationary slowdowns. This did not help the Australian Dollar, already feeling the pressure from a dovish leaning RBA Minutes and news of the Canada/Mexico/China tariffs likely going into effect. The RBA Minutes highlighted downside risks to the economy and a stronger case for cutting rates. Key standouts on Tuesday’s calendar come from Eurozone unemployment, the New Zealand GDT auction, and some Fed speak.USDCAD – technical overview
A sustained hold above 1.3000 over the past several months signals an end to a period of longer-term bearish consolidation and suggests the market is in the process of carving out a more significant longer-term base. Next key resistance now comes in at the 1.5000 psychological barrier. Setbacks should be very well supported ahead of 1.4000.USDCAD – fundamental overview
The Canadian Dollar has come back under pressure as President Trump says tariffs on Canada and Mexico are on schedule to proceed as planned today. Canada has already stepped up with plans to launch its own retaliatory measures, with Canadian Foreign Minister Joy telling reporters the tariffs posed an existential threat. Key standouts on Tuesday’s calendar come from Eurozone unemployment, the New Zealand GDT auction, and some Fed speak.NZDUSD – technical overview
Overall pressure remains on the downside with the market continuing to stall out on runs up into the 0.6500 area. At the same time, there are some signs of the market wanting to put in a longer-term base. Ultimately, a break back above 0.6500 would be required to take the medium-term pressure off the downside and encourage this prospect. A monthly close below 0.5469 will intensify bearish price action.NZDUSD – fundamental overview
The New Zealand Dollar has held up relatively well in the face of trade tension and intense risk off flow, but remains vulnerable to developments on this front which continue to keep the currency well capped into rallies. Key standouts on Tuesday’s calendar come from Eurozone unemployment, the New Zealand GDT auction, and some Fed speak.US SPX 500 – technical overview
The longer term uptrend remains intact and dips continue to be exceptionally well supported. Critical support comes in at 5770, with only a break back below this level to compromise the structure and open the door for a more significant corrective decline. Until then, the focus remains on a continued push to fresh record highs.US SPX 500 – fundamental overview
Going forward, it will be important to keep an eye on Trump trade policies, inflation, bigger picture economic data and the Fed policy outlook. Any of these variables are capable of easily ruffling some feathers and we've already seen a little of this as 2025 gets going.GOLD (SPOT) – technical overview
The 2019 breakout above the 2016 high at 1375 was a significant development, opening the door for fresh record highs and this next major upside extension into the 3000 area. Setbacks should now be well supported above 2500 on a monthly close basis.GOLD (SPOT) – fundamental overview
The yellow metal has pushed record highs in recent months with solid demand from medium and longer-term accounts. These players are more concerned about inflation, geopolitical risk and a less upbeat global growth outlook. All of this should keep the commodity well supported over the coming months.