


Next 24 hours: News around China helps to bolster sentiment
Today’s report: Yen back under pressure on record JGB buying
We got off to a quiet start to the week, which perhaps ended up helping out the market. We’re in the final days of summer holiday for many a trader and as such, trading conditions should continue to trade on the lighter side into early September.
Wake-up call
- German PPI
- rates outlook
- JGB buying
- RMB bounce
- macro factors
- trade data
- inflation risk
- Dealers report
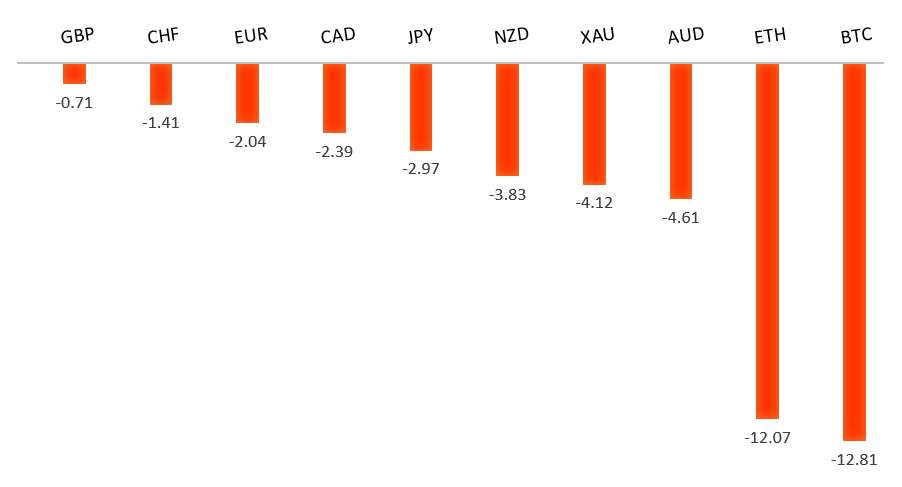
Peformance chart: 30 Day Performance vs. US dollar (%)
Suggested reading
- Sterling Is Heading for a Wile E. Coyote Moment, M. Ashworth, Bloomberg (August 21, 2023)
- Biodiversity Funds Spring Up in the Investor Market, A. Ross, FT Alphaville (August 21, 2023)
Chart talk: Technical & fundamental highlights
Choose pair:
EURUSD – technical overview
The Euro remains well supported on dips following a run to the topside through 1.1000. Any additional setbacks should be well supported ahead of 1.0500 in favor of a bullish continuation. Ultimately, only a monthly close back below 1.0500 would give reason for concern. Next key resistance comes in the form of the 2023 high at 1.1276.EURUSD – fundamental overview
News flow hasn't been all that positive for the Euro. Nevertheless, the single currency managed to break a sequence of daily lower highs. The price action is particularly surprising in light of the plunge in German producer prices to a cycle low. Meanwhile, the Bundesbank was out warning the German economy would stagnate again. Key standouts on Tuesday’s calendar come from the Eurozone current account, UK CBI trends, and US existing home sales.EURUSD - Technical charts in detail
GBPUSD – technical overview
Signs have emerged of the market wanting to put in a longer-term base after collapsing to a record low in September 2022. The November 2022 monthly close back above 1.2000 strengthens this prospect. Any setbacks should now be well supported ahead of 1.2500. Next key resistance comes in at 1.3143.GBPUSD – fundamental overview
The Pound has done a good job standing out as an outperformer in recent weeks, with overall solid economic data and higher inflation reads accounting for the Sterling demand. Key standouts on Tuesday’s calendar come from the Eurozone current account, UK CBI trends, and US existing home sales.USDJPY – technical overview
At this stage, it looks like the market is wanting to resume the bigger picture uptrend and head back towards a retest of that multi-year high from October 2022 up at 151.95. Look for any weakness to continue to be well supported on dips.USDJPY – fundamental overview
The Yen was right back under pressure on Monday, trading back towards a retest of yearly lows against the Buck. The weakness came from the BOJ reporting record JGB buying, which suggests the central bank is nowhere near considering an exit from current accommodative monetary policy. Key standouts on Tuesday’s calendar come from the Eurozone current account, UK CBI trends, and US existing home sales.AUDUSD – technical overview
There are signs of the potential formation of a longer-term base following the late 2022 surge back above 0.6500. Next key resistance comes in at 0.7284. Setbacks should continue to be well supported ahead of 0.6300. Only a monthly close below 0.6400 would give reason for rethink.AUDUSD – fundamental overview
Finally some relief for the Australian Dollar, with the currency finding demand on a bounce in the RMB, higher metals prices, and rally in US equities. Key standouts on Tuesday’s calendar come from the Eurozone current account, UK CBI trends, and US existing home sales.USDCAD – technical overview
Above 1.3000 signals an end to a period of longer-term bearish consolidation and suggests the market is in the process of carving out a more significant longer-term base. Next key resistance now comes in up into the 1.4000 area. Setbacks should be very well supported down into the 1.3000 area.USDCAD – fundamental overview
A worsening global macro condition, and softer Canada economic data have factored into the latest run of Canadian Dollar weakness. Key standouts on Tuesday’s calendar come from the Eurozone current account, UK CBI trends, and US existing home sales.NZDUSD – technical overview
Overall pressure remains on the downside with the market once again stalling out on a run up into the 0.6500 area. Ultimately, a break back above 0.6577 would be required to take the immediate pressure off the downside. A monthly close below 0.6000 would intensify bearish price action.NZDUSD – fundamental overview
The New Zealand Dollar sunk to another yearly low on Monday, with setbacks coming from a round of downbeat New Zealand trade data. Asia Pacific economies remain in trouble at the moment, which has only added to the downbeat sentiment. Key standouts on Tuesday’s calendar come from the Eurozone current account, UK CBI trends, and US existing home sales.US SPX 500 – technical overview
Longer-term technical studies are in the process of unwinding from extended readings off record highs. Look for rallies to be well capped in favor of lower tops and lower lows. A monthly close back above 4600 will be required to take the immediate pressure off the downside. Next key support comes in at 4328.US SPX 500 – fundamental overview
We've finally reached a point in the cycle where the Fed recognizes unanchored inflation expectations pose a greater downside risk than over-tightening. This is significant, as it means less investor friendly monetary policy. Overall, we expect inflation to continue to be a problem in 2023 that results in downside pressure into rallies despite market expectations that would argue otherwise.GOLD (SPOT) – technical overview
The 2019 breakout above the 2016 high at 1375 was a significant development, opening the door for fresh record highs. Setbacks should now be well supported above 1600 on a monthly close basis ahead of the next major upside extension. Next major resistance comes in at 2100, above which opens the next extension towards 2500.GOLD (SPOT) – fundamental overview
The yellow metal continues to be well supported on dips with solid demand from medium and longer-term accounts. These players are more concerned about inflation risk and a less upbeat global growth outlook. All of this should keep the commodity well supported, with many market participants also fleeing to the hard asset as the grand dichotomy of record high equities and record low yields comes to an unnerving climax.