


Next 24 hours: Yen hit hard despite broader price action
Today’s report: BOJ shakes things up on YCC tweak
Worry around spillover risk from the Middle East has calmed down, allowing for a mild wave of risk of flow, with stocks trading higher and the US Dollar lower. The big news into Tuesday comes out of Japan, after the BOJ said it will take a more flexible approach to controlling yields on 10-year government debt, with 1% a reference point.
Wake-up call
- German GDP
- soft housing
- YCC tweak
- retail sales
- rate repricing
- business confidence
- Geopolitical risk
- Global outlook
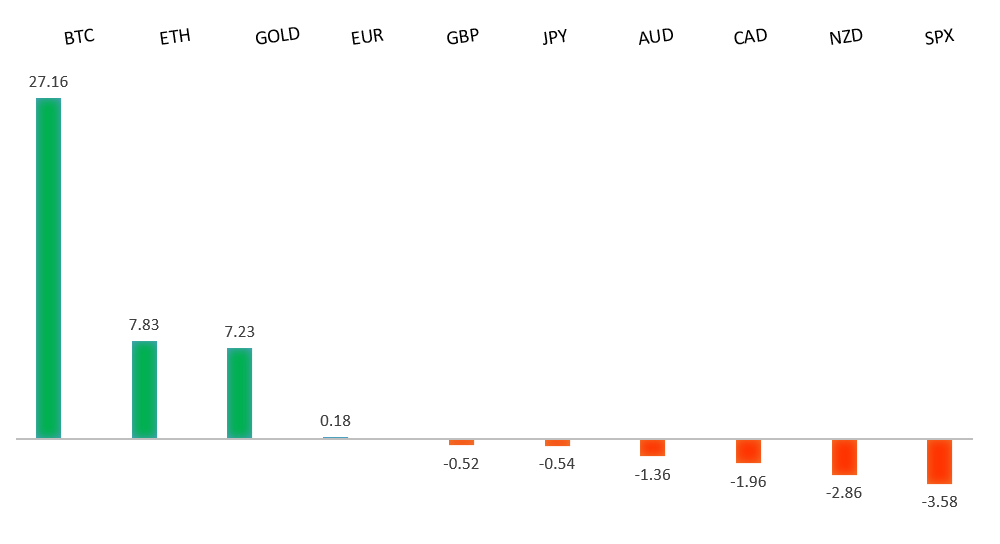
Peformance chart: 30 Day Performance vs. US dollar (%)
Suggested reading
- What Happens When Central Plan Monetarists Marry Keynes, J. Tamny, Forbes (October 29, 2023)
- Can the Steel Industry Go Green?, S. Pfeifer, Financial Times (October 31, 2023)
Chart talk: Technical & fundamental highlights
Choose pair:
EURUSD – technical overview
Any additional setbacks should be well supported on dips below 1.0500 in favor of the start to the next major upside extension. Ultimately, only a monthly close back below 1.0500 would give reason for concern. Back above 1.0770 will take the immediate pressure off the downside.EURUSD – fundamental overview
The Euro got a boost on Monday after German GDP wasn't as bad as feared. Key standouts on Tuesday’s calendar come from German retail sales, Eurozone GDP, Eurozone inflation, Canada GDP, US Case Shiller, Chicago PMIs, and US consumer confidence.EURUSD - Technical charts in detail
GBPUSD – technical overview
Signs have emerged of the market wanting to put in a longer-term base after collapsing to a record low in September 2022. The November 2022 monthly close back above 1.2000 strengthens this prospect. Any setbacks should now be well supported ahead of 1.2000. Next key resistance comes in at 1.2338.GBPUSD – fundamental overview
The Pound managed to shrug off a round of softer housing and lending data on Monday, getting help from broad based US Dollar selling. Key standouts on Tuesday’s calendar come from German retail sales, Eurozone GDP, Eurozone inflation, Canada GDP, US Case Shiller, Chicago PMIs, and US consumer confidence.USDJPY – technical overview
At this stage, it looks like the market is wanting to resume the bigger picture uptrend and head back towards a retest of that multi-year high from October 2022 up at 151.95. Look for any weakness to continue to be well supported on dips.USDJPY – fundamental overview
The Yen has fallen sharply in the aftermath of BOJ decision in which the central bank left interest rates unchanged, while tweaking the language on yield curve control, making 1% a reference cap. The tweak to make the conduct of YCC more flexible was said to be "appropriate" to help long-term interest rates form "smoothly in financial markets in response to future developments - a sentiment that somewhat throws into question the "control" portion of "Yield Curve Control." Key standouts on Tuesday’s calendar come from German retail sales, Eurozone GDP, Eurozone inflation, Canada GDP, US Case Shiller, Chicago PMIs, and US consumer confidence.AUDUSD – technical overview
There are signs of the potential formation of a longer-term base with the market trading down into a meaningful longer-term support zone. Only a monthly close below 0.6200 would give reason for rethink. Back above 0.6523 will take the immediate pressure off the downside and strengthen case for a bottom.AUDUSD – fundamental overview
The Australian Dollar has been able to standout in the early week as a mild outperformer on the back of Monday's much better than expected Aussie retail sales showing. Key standouts on Tuesday’s calendar come from German retail sales, Eurozone GDP, Eurozone inflation, Canada GDP, US Case Shiller, Chicago PMIs, and US consumer confidence.USDCAD – technical overview
Above 1.3000 signals an end to a period of longer-term bearish consolidation and suggests the market is in the process of carving out a more significant longer-term base. Next key resistance now comes in up into the 1.4000 area. Setbacks should be very well supported down into the 1.3000 area.USDCAD – fundamental overview
There has been a serious repricing of Bank of Canada expectations after last week's dovish central bank decision. We've since seen the Canadian Dollar trade to a fresh yearly low against the US Dollar. Key standouts on Tuesday’s calendar come from German retail sales, Eurozone GDP, Eurozone inflation, Canada GDP, US Case Shiller, Chicago PMIs, and US consumer confidence.NZDUSD – technical overview
Overall pressure remains on the downside with the market once again stalling out on a run up into the 0.6500 area. Ultimately, a break back above 0.6049 would be required to take the immediate pressure off the downside. A monthly close below 0.5800 will intensify bearish price action.NZDUSD – fundamental overview
The New Zealand Dollar has been getting help from a round of better than expected New Zealand business confidence reads, while trying to shrug off a third straight monthly decline in building permits. Key standouts on Tuesday’s calendar come from German retail sales, Eurozone GDP, Eurozone inflation, Canada GDP, US Case Shiller, Chicago PMIs, and US consumer confidence.US SPX 500 – technical overview
Longer-term technical studies are in the process of unwinding from extended readings off record highs. Look for rallies to be well capped in favor of lower tops and lower lows. A monthly close back above 4600 will be required to take the immediate pressure off the downside. Next key support comes in at 4200.US SPX 500 – fundamental overview
Investors continue to struggle with the reality of a higher for longer Fed policy track in the face of ongoing worry around inflation, while also contending with an escalation in geopolitical risk. Overall, we expect inflation to continue to be a problem in 2023 that results in downside pressure into rallies despite market expectations that would argue otherwise.GOLD (SPOT) – technical overview
The 2019 breakout above the 2016 high at 1375 was a significant development, opening the door for fresh record highs. Setbacks should now be well supported above 1600 on a monthly close basis ahead of the next major upside extension. Next major resistance comes in at 2100, above which opens the next extension towards 2500.GOLD (SPOT) – fundamental overview
The yellow metal continues to be well supported on dips with solid demand from medium and longer-term accounts. These players are more concerned about inflation risk and a less stable and upbeat global growth outlook. All of this should keep the commodity well supported, with many market participants also fleeing to the hard asset as the grand dichotomy of record high equities and record low yields comes to an unnerving climax.