


Today’s report: Fed rate cut pricing holds firm
Thursday’s run of impressive US economic data in the form of GDP and initial jobless claims could very well take any expectation for a 50 basis point Fed rate cut off the table. Nevertheless, despite the stronger showing, the rates market hasn’t really budged, still pricing another 100 basis points of cuts between now and year end.
Wake-up call
- German inflation
- higher taxes
- offsetting data
- shrugs off
- Canada GDP
- Building permits
- accommodative policy
- Macro themes
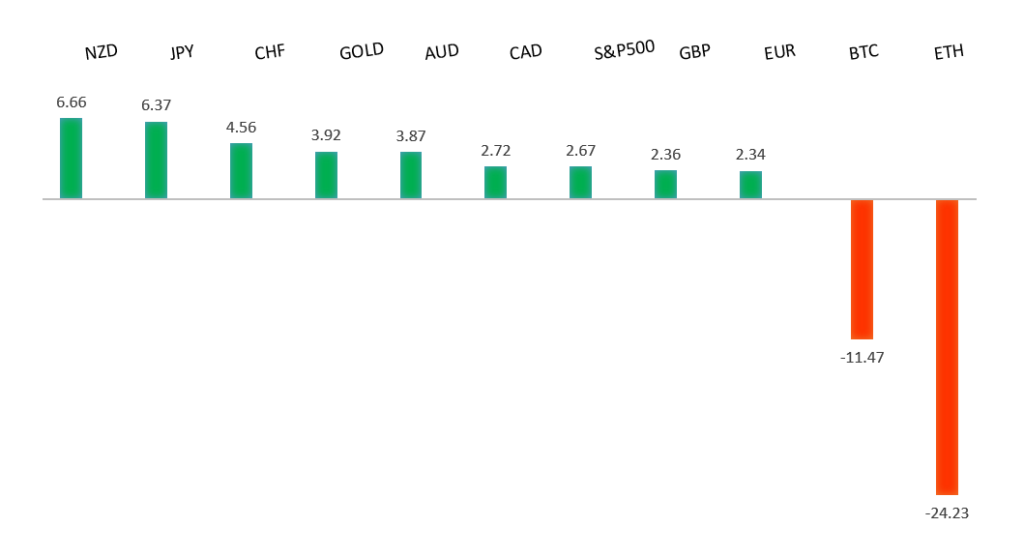
Peformance chart: 30-Day Performance vs. US dollar (%)
Suggested reading
- 3 Contrarian Investment Strategies Worth Considering, B. Armour, Morningstar (August 28, 2024)
- The Transformative Power of Musk Start-Up Neuralink, S. McBride, RiskHedge (August 28, 2024)
Chart talk: Technical & fundamental highlights
Choose pair:
EURUSD – technical overview
The Euro has been in a multi-month consolidation since bottoming out in 2022. Setbacks have since been exceptionally well supported on dips below 1.0500, with a higher platform sought out ahead of the next major upside extension. Look for a push through the 2023 high at 1.1276 to strengthen the constructive outlook and extend the recovery run towards 1.2000. Only back below 1.0400 negates.EURUSD – fundamental overview
German inflation fell below 2% for the first time since March 2021 and the Euro extended its recent correction lower as ECB rate cut odds pushed up. Key standouts on Friday’s calendar come from German retail sales and unemployment, UK BOE consumer credit and mortgage approvals, Eurozone inflation and unemployment, Canada GDP, US core PCE, Chicago PMIs, and Michigan sentiment.EURUSD - Technical charts in detail
GBPUSD – technical overview
Signs have emerged of the market wanting to put in a longer-term base after collapsing to a record low in September 2022. The door is now open for the next major upside extension towards the 2018 high at 1.4377. Any setbacks should be well supported ahead of 1.2500.GBPUSD – fundamental overview
There hasn't been a lot of news out of the UK this week, though the prospect of higher taxes has dented GBP sentiment for the second day in a row. Key standouts on Friday’s calendar come from German retail sales and unemployment, UK BOE consumer credit and mortgage approvals, Eurozone inflation and unemployment, Canada GDP, US core PCE, Chicago PMIs, and Michigan sentiment.USDJPY – technical overview
The market has entered a period of correction after extending the uptrend to a multi-year high through 160.00. Critical support comes in around 140.00, with only a monthly close below the barrier to compromise the bullish outlook. A higher low is ideally sought out above 140.00 in favor of a bullish continuation.USDJPY – fundamental overview
The Yen hasn't been able to do much with a hotter run of Tokyo CPI data given the offsetting, softer than expected industrial production and retail sales prints. Key standouts on Friday’s calendar come from German retail sales and unemployment, UK BOE consumer credit and mortgage approvals, Eurozone inflation and unemployment, Canada GDP, US core PCE, Chicago PMIs, and Michigan sentiment.AUDUSD – technical overview
There are signs of the potential formation of a longer-term base with the market trading down into a meaningful longer-term support zone. Only a monthly close below 0.6200 would give reason for rethink. Back above 0.6900 will take the big picture pressure off the downside and strengthen case for a bottom.AUDUSD – fundamental overview
Thursday's softer Aussie private capital expenditure data has been followed up be below forecast Aussie retail sales on Friday. Still, despite the softer round of data, the Australian Dollar has held up relatively well on bigger picture correlations with commodities and equities. Key standouts on Friday’s calendar come from German retail sales and unemployment, UK BOE consumer credit and mortgage approvals, Eurozone inflation and unemployment, Canada GDP, US core PCE, Chicago PMIs, and Michigan sentiment.USDCAD – technical overview
A sustained hold above 1.3000 over the past several months signals an end to a period of longer-term bearish consolidation and suggests the market is in the process of carving out a more significant longer-term base. Next key resistance now comes in up into the 1.4000 area, with a break to open a retest of the 2020 high just ahead of 1.4700. Setbacks should be very well supported down into the 1.3000 area.USDCAD – fundamental overview
The Canadian Dollar is looking tired after being unable to extend its recent recovery on a positive Canada business survey and higher energy prices. Key standouts on Friday’s calendar come from German retail sales and unemployment, UK BOE consumer credit and mortgage approvals, Eurozone inflation and unemployment, Canada GDP, US core PCE, Chicago PMIs, and Michigan sentiment.NZDUSD – technical overview
Overall pressure remains on the downside with the market continuing to stall out on runs up into the 0.6500 area. At the same time, there are some signs of the market wanting to put in a longer-term base. Ultimately, a break back above 0.6500 would be required to take the medium-term pressure off the downside and encourage this prospect. A monthly close below 0.5800 will intensify bearish price action.NZDUSD – fundamental overview
New Zealand building permits and consumer confidence reads have come in on the healthy side, already following up an explosive ANZ business confidence reading from the previous day. This has kept the New Zealand Dollar outperforming and well supported into the weekly close. Key standouts on Friday’s calendar come from German retail sales and unemployment, UK BOE consumer credit and mortgage approvals, Eurozone inflation and unemployment, Canada GDP, US core PCE, Chicago PMIs, and Michigan sentiment.US SPX 500 – technical overview
The longer term uptrend remains intact and dips continue to be exceptionally well supported. Critical support comes in at 5093, with only a break back below this level to compromise the structure and open the door for a more significant corrective decline. Until then, the focus remains on a retest and break back above the record high.US SPX 500 – fundamental overview
The US equities market remains exceptionally well supported in 2024 on the back of an ongoing expectation for more rate cuts than less going forward. Investors are feeling better about a soft landing in the US economy and this has also been accompanied by an accommodative adjustment of Fed policy. It will however be important to keep an eye on inflation, bigger picture economic data and geopolitical risk in the months ahead.GOLD (SPOT) – technical overview
The 2019 breakout above the 2016 high at 1375 was a significant development, opening the door for fresh record highs and this next major upside extension into the 2500-3000 area. Setbacks should now be well supported above 2200 on a monthly close basis.GOLD (SPOT) – fundamental overview
The yellow metal has pushed record highs in 2024 with solid demand from medium and longer-term accounts. These players are more concerned about inflation, geopolitical risk and a less upbeat global growth outlook. All of this should keep the commodity well supported over the coming months.