


 | ||
| 27th July 2026 | view in browser | ||
| Markets brace for a defining macro week | ||
| Markets head into a pivotal week dominated by the Fed, BoE and BoJ meetings, with investors focused on whether central banks reinforce a higher-for-longer policy outlook amid persistent inflation risks, while US GDP, Core PCE, major earnings and easing Middle East tensions combine to drive the next move across the dollar, equities and commodities. | ||
| Performance chart 30day v. USD (%) | ||
 | ||
| Technical & fundamental highlights | ||
| EURUSD: technical overview | ||
| The Euro outlook remains constructive with higher lows sought out on dips in favor of the next major upside extension targeting the 2021 high at 1.2350. Setbacks should be exceptionally well supported ahead of 1.1300. | ||
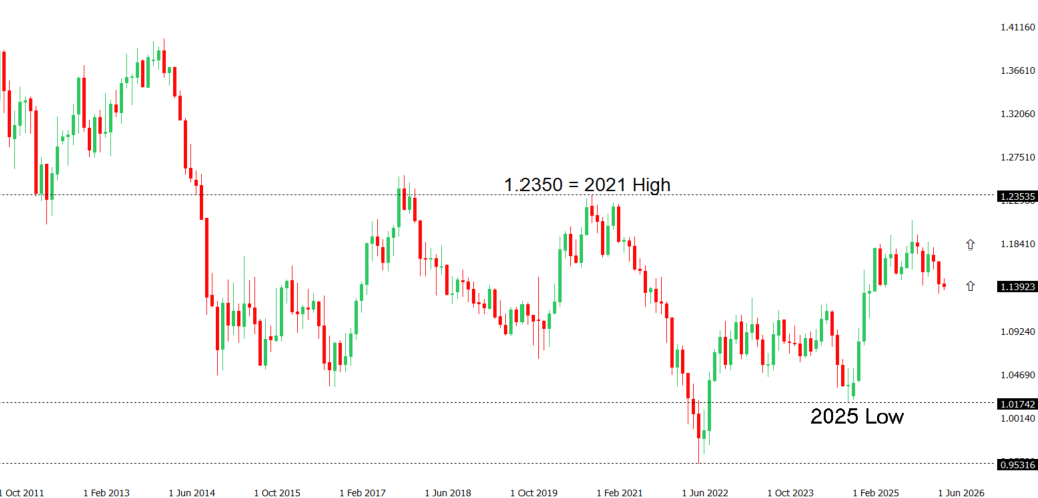 | ||
| R2 1.1529 - 18 June high - Medium R1 1.1483 - 15 July high - Medium S1 1.1325 - 24 June/2026 low - Medium S2 1.1300 - Figure - Medium | ||
| EURUSD: fundamental overview | ||
| The euro remains under pressure against the US dollar despite a surprisingly resilient set of Eurozone PMI data, as stronger-than-expected business activity has been overshadowed by broad US dollar strength and lingering geopolitical uncertainty. While Germany and the wider Eurozone both returned to stronger expansion in July, reinforcing signs of improving economic momentum, the ECB’s decision to leave rates unchanged after June’s hike and its cautious message that energy-related inflation risks remain highly uncertain has kept markets from becoming materially more bullish on the single currency. At the same time, the dollar continues to draw support from robust US services activity, elevated Treasury yields, and expectations that the Federal Reserve will keep policy restrictive, with markets still assigning meaningful odds of another rate hike later this year. Meanwhile, escalating tensions in the Middle East, renewed trade tariff concerns, and persistent inflation risks continue to underpin demand for the greenback, even as reports of possible diplomatic progress between Iran and Pakistan have helped ease oil prices and modestly improve risk sentiment. Attention now turns to this week’s Fed meeting, where the policy statement and Chair Kevin Warsh’s guidance are expected to be the primary catalysts for the next move in EURUSD. | ||
| GBPUSD: technical overview | ||
| The Pound remains exceptionally well supported on dips into the 1.3000 area, with the price largely consolidating above the psychological barrier and previous resistance turned support in the form of the 2023 high. Look for the market to continue be well supported on dips ahead of the next major upside extension through the yearly high at 1.3870 and towards a retest of the 2018 high at 1.4377 further up. Only a monthly close below 1.3000 negates. | ||
 | ||
| R2 1.3452 - 10 July high - Strong R1 1.3396 - 22 July high - Medium S1 1.3295 - 24 July low - Medium S2 1.3373 - 22 June high - Medium | ||
| GBPUSD: fundamental overview | ||
| Sterling remains under pressure against the US Dollar despite a modest late-week rebound, with stronger-than-expected UK Retail Sales and July PMI data helping to stabilize the Pound after Thursday’s sharp selloff. However, the broader backdrop continues to favor the Dollar as escalating US-Iran tensions, safe-haven demand, and renewed expectations that the Federal Reserve may need to keep policy tighter for longer outweigh the UK’s encouraging data. Markets continue to expect the Bank of England to leave rates unchanged at 3.75% next week, with policymakers likely to maintain a cautious but hawkish stance as they assess the inflationary implications of higher energy prices stemming from the Middle East conflict. While resilient UK economic data has reinforced expectations that UK rates will remain elevated into 2026, GBPUSD continues to trade primarily as a function of broad US Dollar strength and shifting Fed expectations, leaving further upside in the Pound dependent on either an easing in geopolitical tensions or a less hawkish US rate outlook. | ||
| USDJPY: technical overview | ||
| The major pair has extended its run to fresh multi-decade highs, with the latest push through 160.00 opening the door for further upside towards 165.00-170.00. At the same time, daily studies are looking quite stretched, suggesting we could see a healthy correction on the horizon. A break back below 160.48 would now strengthen the case for a larger pullback. Until then, the market will continue to be focused on additional gains. | ||
 | ||
| R2 165.00 - Psychological - Strong R1 163.99 - Multi-Year high/23 July 2026 - Medium S1 162.43 - 21 July low - Medium S2 161.28 - 10 July low - Medium | ||
| USDJPY: fundamental overview | ||
| The yen remains under pressure as the wide interest rate differential between Japan and the US continues to drive carry trade demand, even after the Bank of Japan raised rates to 1%. While the BoJ has signaled it remains open to further policy normalization, markets broadly expect it to leave rates unchanged at next week’s meeting, limiting support for the currency. Japan’s June national CPI accelerated to 1.7% year-over-year, reinforcing expectations that inflation remains on an upward path, while Finance Minister Katayama has again warned authorities stand ready to take decisive action against excessive currency moves, keeping intervention risk elevated with USDJPY near fresh 40-year highs. However, verbal intervention has so far done little to alter the broader trend, with resilient US economic data, expectations the Federal Reserve will keep policy restrictive for longer, and renewed Middle East tensions supporting higher US yields and reinforcing demand for the US dollar. Although a modest pullback in the dollar and profit-taking have capped USDJPY’s advance in the near term, the yen’s broader outlook continues to be dictated by the persistent US-Japan policy divergence and geopolitical developments ahead of this week’s Fed and BoJ meetings. | ||
| AUDUSD: technical overview | ||
| There are signs of the formation of a longer-term base with the market recovering out from a meaningful longer-term support zone. The latest monthly close back above 0.7000 takes the big picture pressure off the downside and strengthens the case for a bottom, with the focus now on a push towards 0.8000. Setbacks should now be well supported ahead of 0.6700. | ||
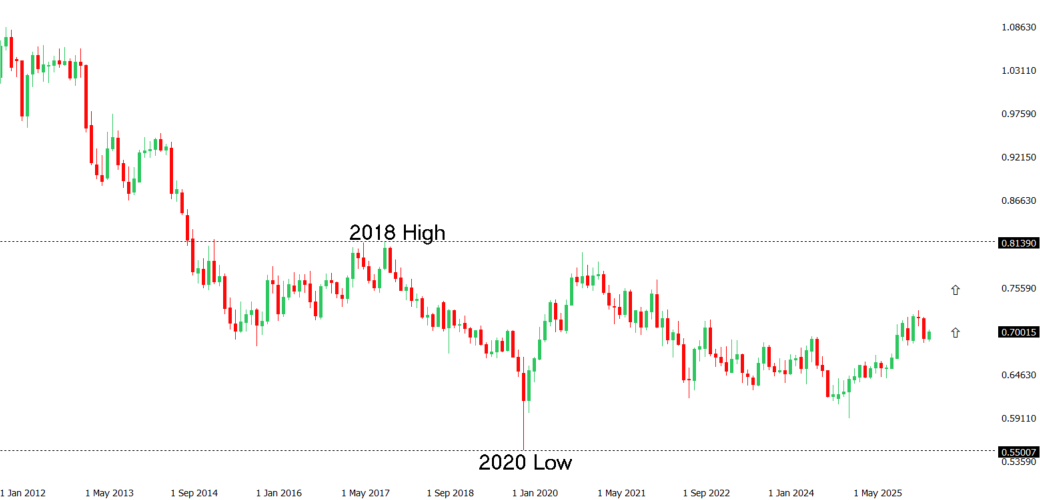 | ||
| R2 0.7089 - 15 June high - Strong R1 0.7027 - 21 July high - Medium S1 0.6912 - 14 July low - Medium S2 0.6865 - 30 June low - Strong | ||
| AUDUSD: fundamental overview | ||
| The Australian dollar remains caught between supportive domestic fundamentals and an increasingly resilient US dollar backdrop. Stronger-than-expected Australian data, including a 76.3K jump in June employment and firmer July flash PMIs, has reinforced expectations that the RBA will maintain its hawkish bias and pushed back against near-term easing expectations. However, those positives continue to be offset by broad US dollar strength as rising Treasury yields and renewed speculation that the Federal Reserve could still deliver another rate hike have weighed on global risk sentiment. Elevated oil prices, driven by Middle East supply disruption risks, have also lifted global inflation expectations, supporting higher US yields and the greenback while reducing demand for risk-sensitive currencies like the Aussie. Mixed US PMI data offered the Australian dollar only limited relief, with softer manufacturing activity offset by a much stronger services reading that reinforced the prospect of higher-for-longer US interest rates. Attention now turns to this week’s Fed meeting, where markets will closely scrutinize Chair Kevin Warsh’s guidance for clues on whether policymakers remain prepared to tighten further, a key determinant of whether AUDUSD can recover or remains under pressure. | ||
| Suggested reading | ||
| It’s Worrisome Bonds Haven’t Been This Calm Since ’01, M. Hulbert, Marketwatch (July 25, 2026) Valuations Are High – Should You Sell?, G. Engelbart, Carson Group (July 23, 2026) | ||