Day Image
10th October 2025 | view in browser
Dollar holds up as Germany slumps, Japan wavers

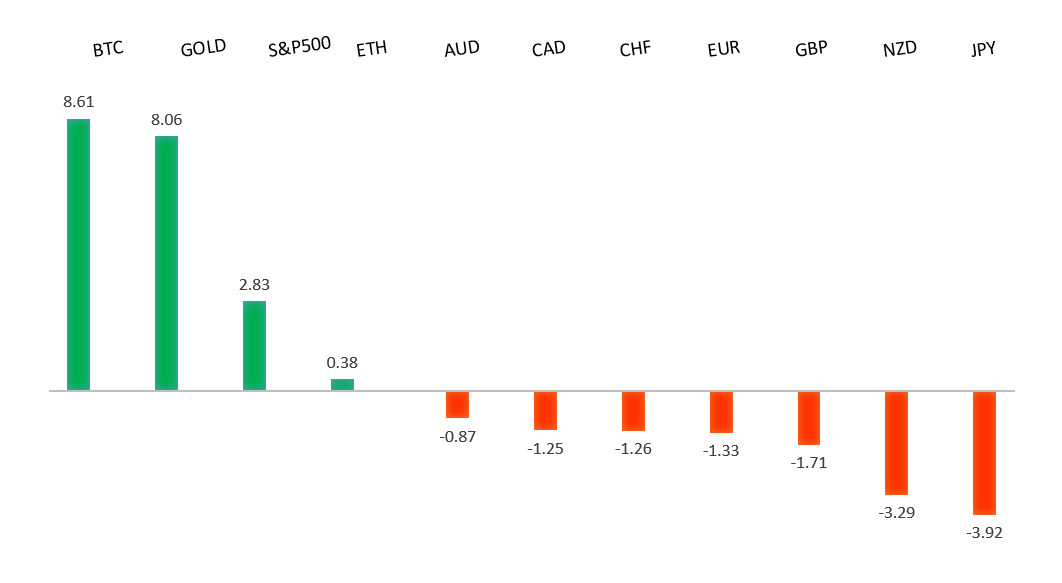
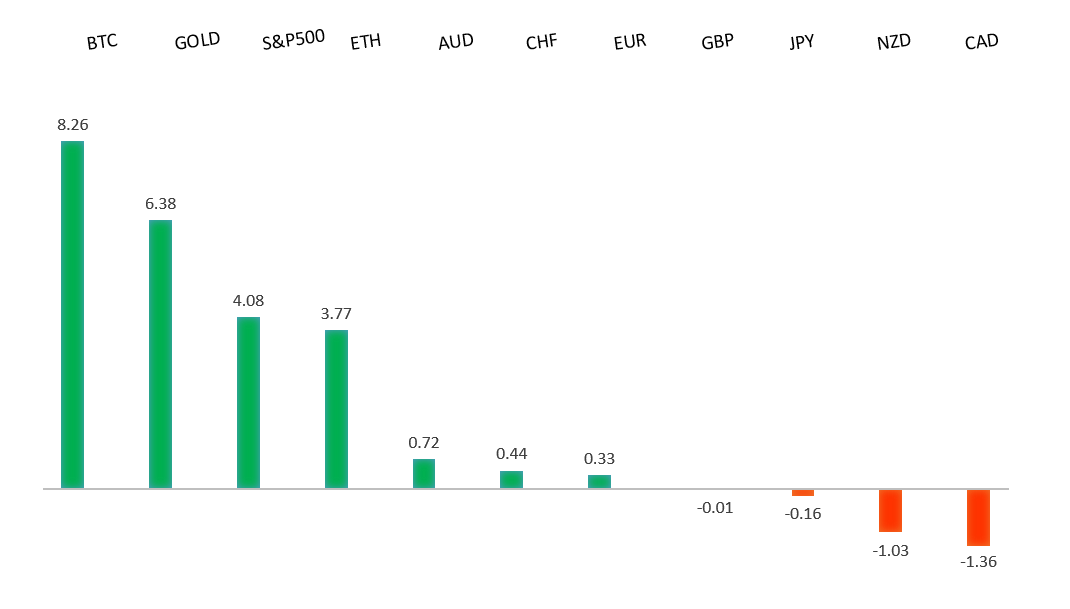
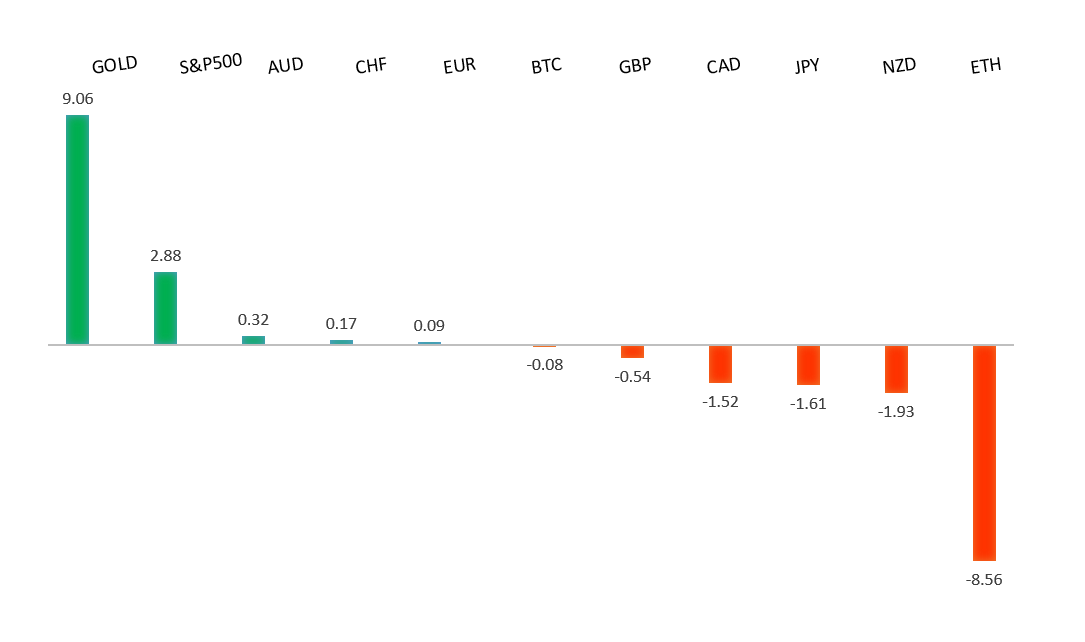
The U.S. dollar has been enjoying a nice run of positive momentum, supported by weak German economic data, which is pressuring the euro, and a faltering yen following Sanae Takaichi’s LDP election win in Japan, despite her recent moderate stance.


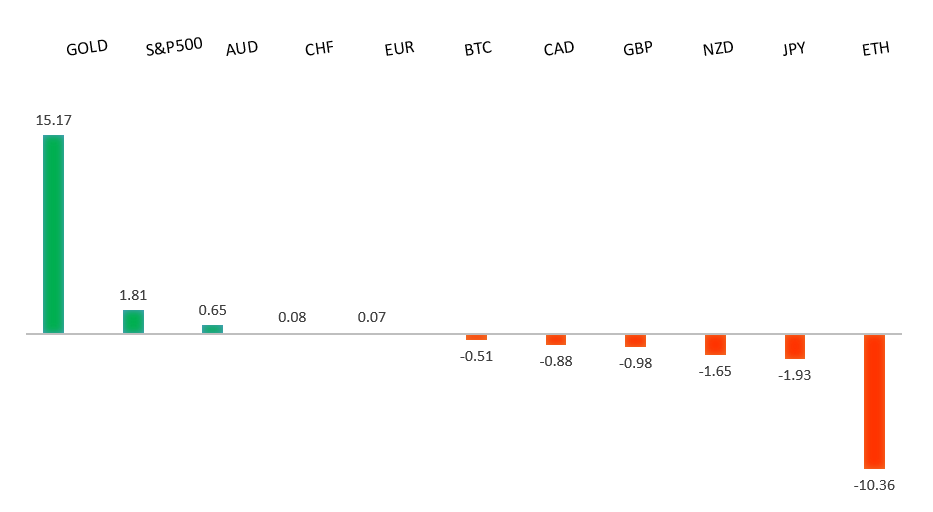
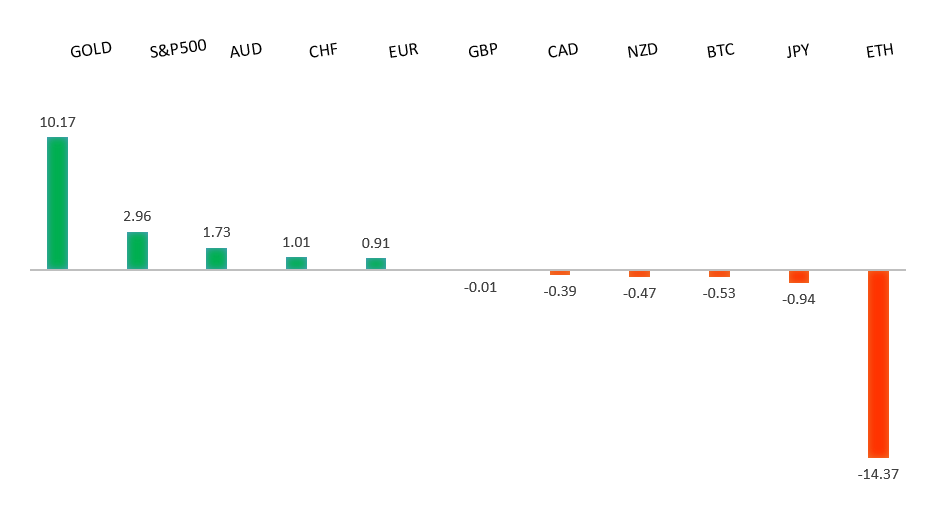
Performance chart 30day v. USD (%)
Performance Chart
 
 
Technical & fundamental highlights
EURUSD: technical overview

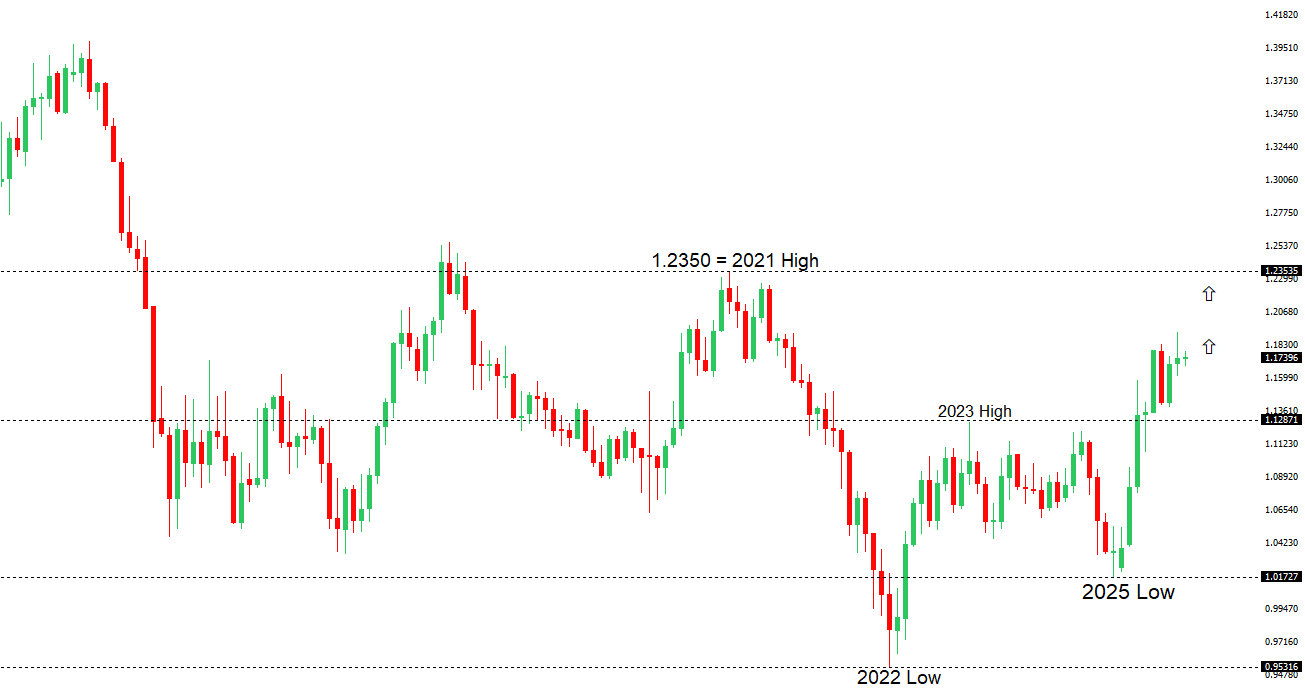
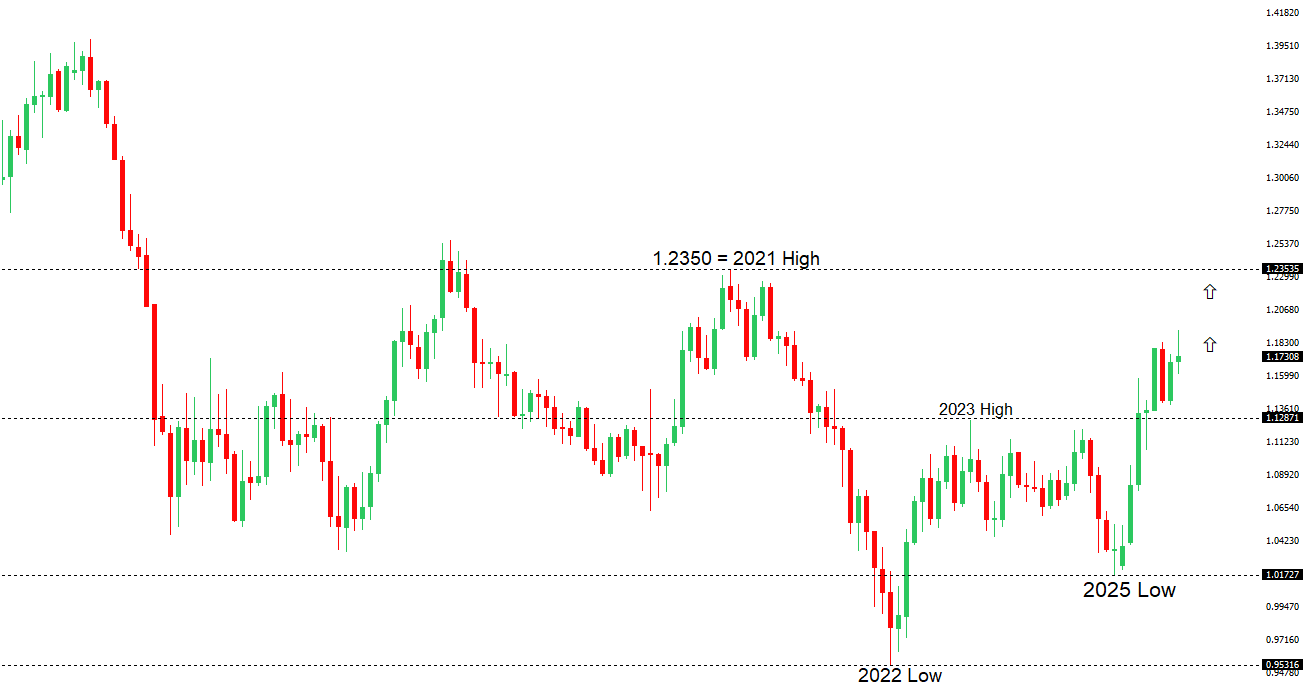
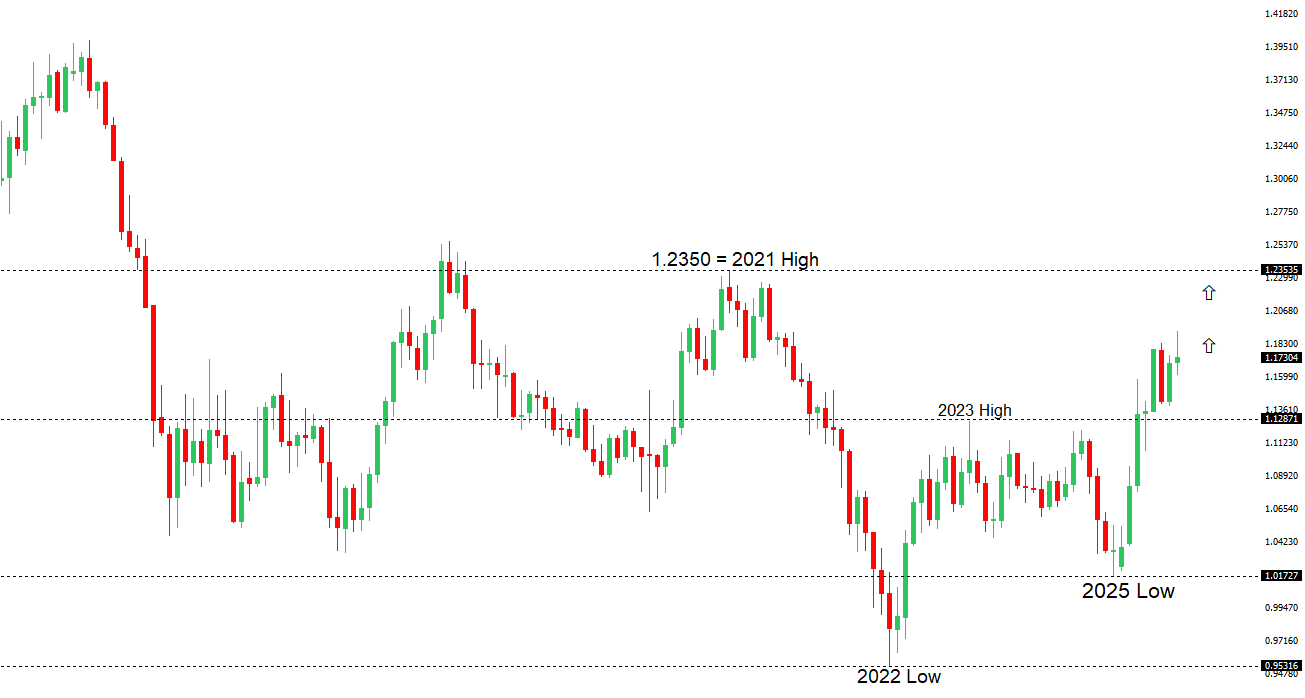
The Euro outlook remains constructive with higher lows sought out on dips in favor of the next major upside extension targeting the 2021 high at 1.2350. Setbacks should be exceptionally well supported ahead of 1.1300.

EURUSD Chart
R2 1.1779 - 1 October high -Strong
R1 1.1662 - 8 October high - Medium
S1 1.1542 - 9 October low - Medium
S2 1.1528 - 5 August low - Strong
EURUSD: fundamental overview

Germany’s economy, the largest in the Eurozone, is facing challenges as August trade data shows a wider-than-expected trade surplus of €17.2 billion, driven by a 0.5% drop in exports and a 1.3% decline in imports. Exports to the US fell sharply by 20% year-on-year, largely due to Trump’s 15% tariff on European goods, while manufacturing, particularly in the automotive sector, continues to weaken. With two years of economic contraction already and a projected GDP growth of just 0.2% for 2025, Germany risks a third recession, which could pressure the ECB to adopt a more dovish stance on interest rates within 6–12 months if economic conditions deteriorate further. Chancellor Merz’s fiscal expansion plans are delayed by administrative issues, with significant stimulus not expected until 2026, while the ECB remains cautious, maintaining steady rates as inflation nears 2% and Eurozone growth is forecasted at 0.9–1.2% through 2027.

 
USDJPY: technical overview

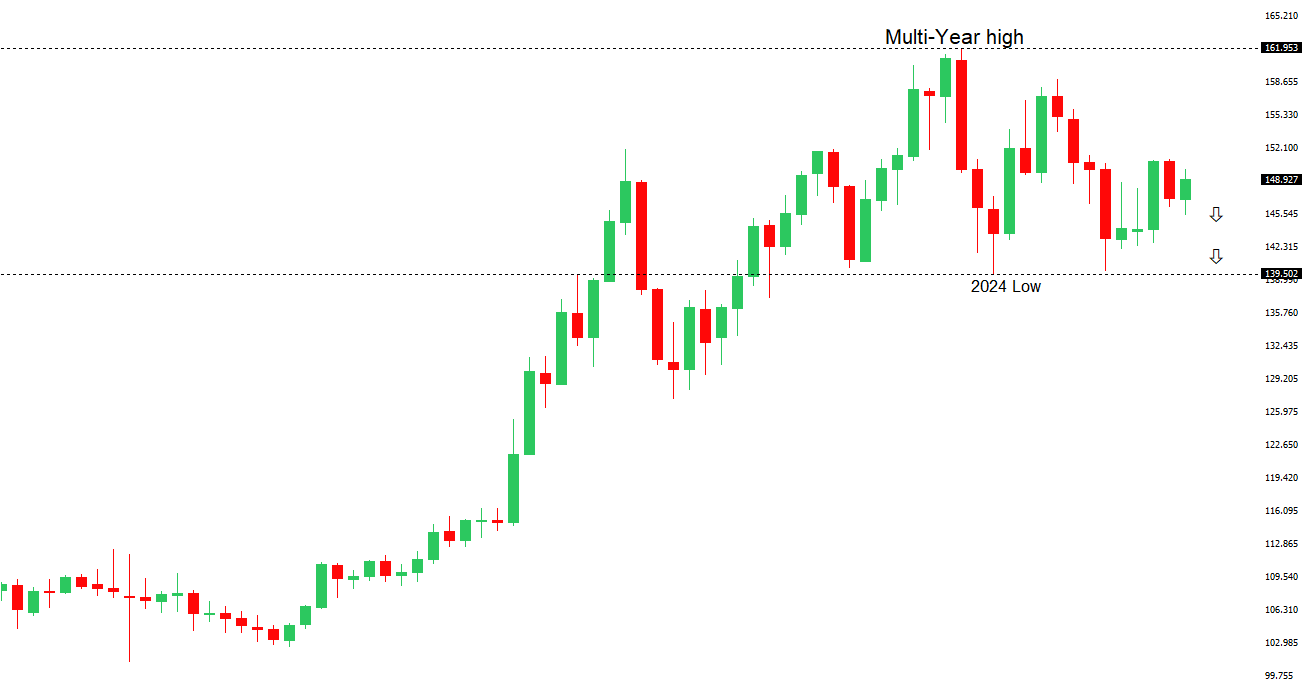
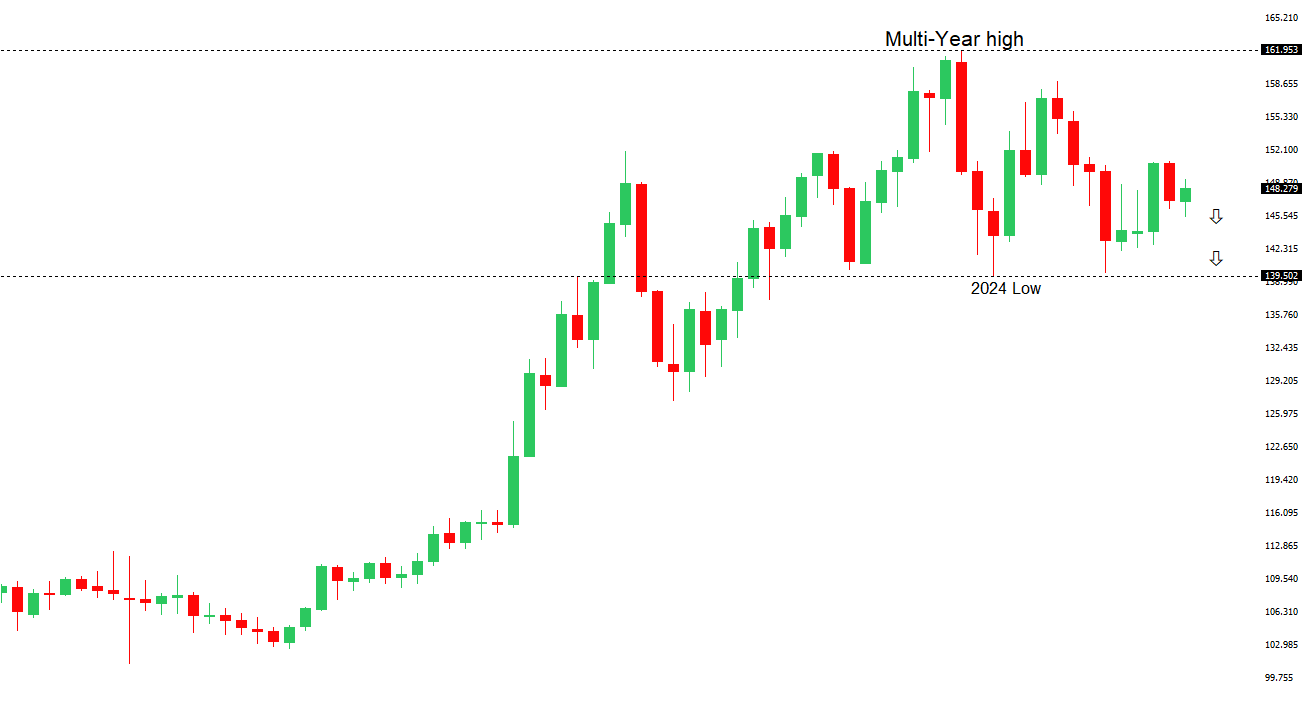
There are signs of a meaningful top in place after the market put in a multi-year high in 2024. At this point, the door is now open for a deeper setback below the 2024 low at 139.58, exposing a retest of the 2023 low. Rallies should be well capped below 155.00.

USDJPY Chart
R2 154.80 - 12 February high - Strong
R1 153.28 - 10 October high - Medium
S1 150.20 - 7 October low - Medium
S2 149.03 - 6 October low - Strong
USDJPY: fundamental overview

During a live TV broadcast, Japanese Finance Minister Sanae Takaichi stated she does not intend to weaken the yen excessively or revise the 2013 BOJ accord aimed at combating deflation, emphasizing collaboration between the government and the BOJ on economic policies while leaving monetary policy decisions to the BOJ. Market expectations for aggressive stimulus may fade due to practical challenges and international pressure, particularly from the US, which could view a weaker yen as currency manipulation, while domestic fatigue with bold political rhetoric grows. Political uncertainty surrounds the Liberal Democratic Party leadership, with speculation that Sanae Takaichi may replace Shigeru Ishiba as prime minister, and the Komeito party’s potential exit from the LDP coalition could lead to a non-LDP prime minister for the first time in years, as opposition groups unite around inflation control and political reform. Japan’s September economic data shows robust machine tool orders (+9.9% YoY) and persistent producer inflation (PPI +2.7% YoY), signaling strong manufacturing investment and ongoing cost pressures, which could push the BOJ toward further policy normalization.

 
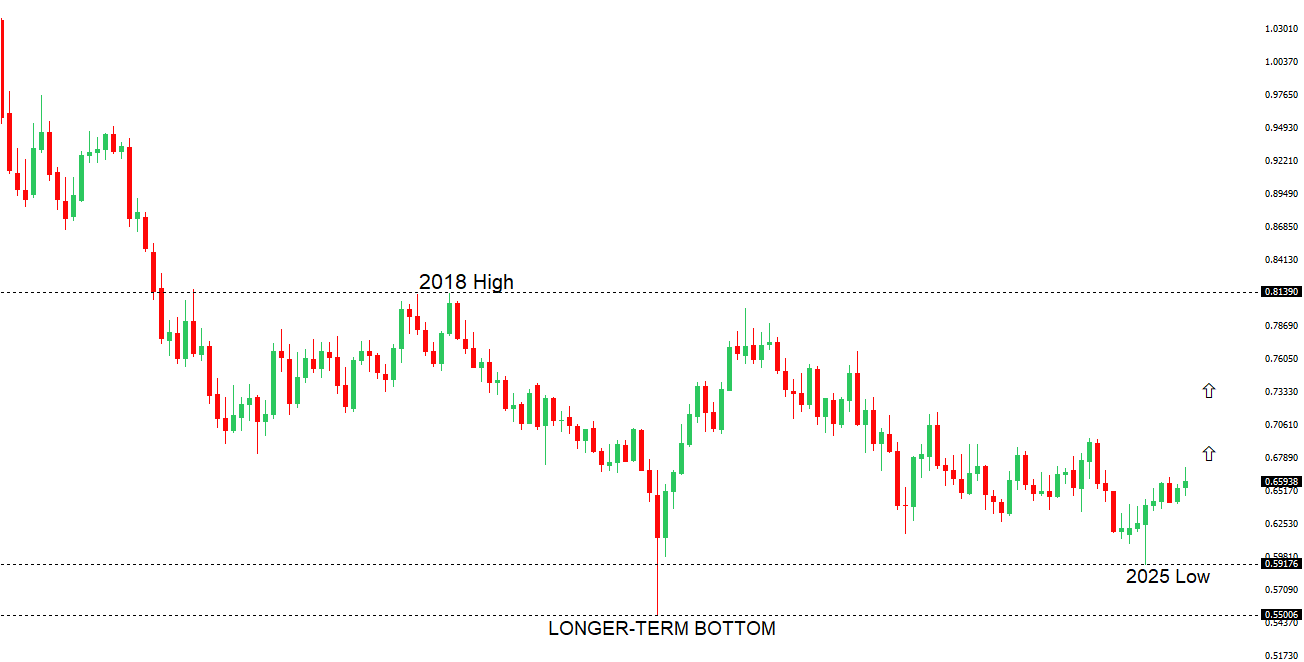
AUDUSD: technical overview

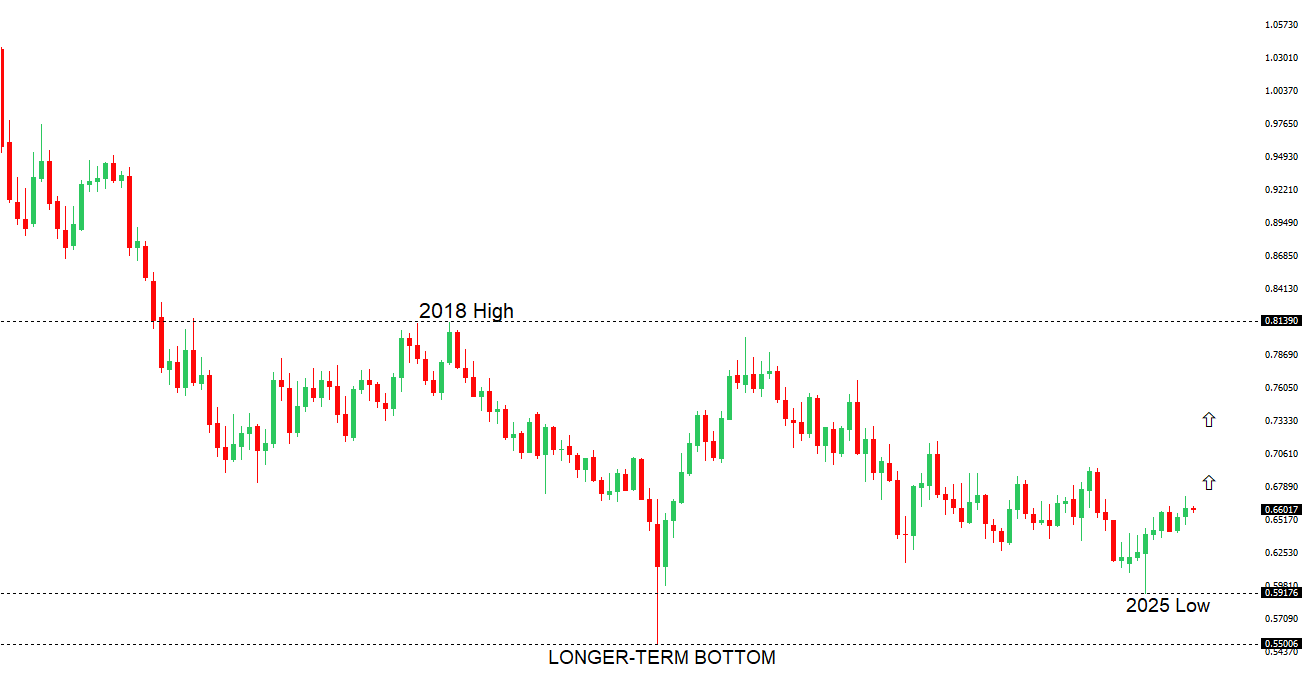
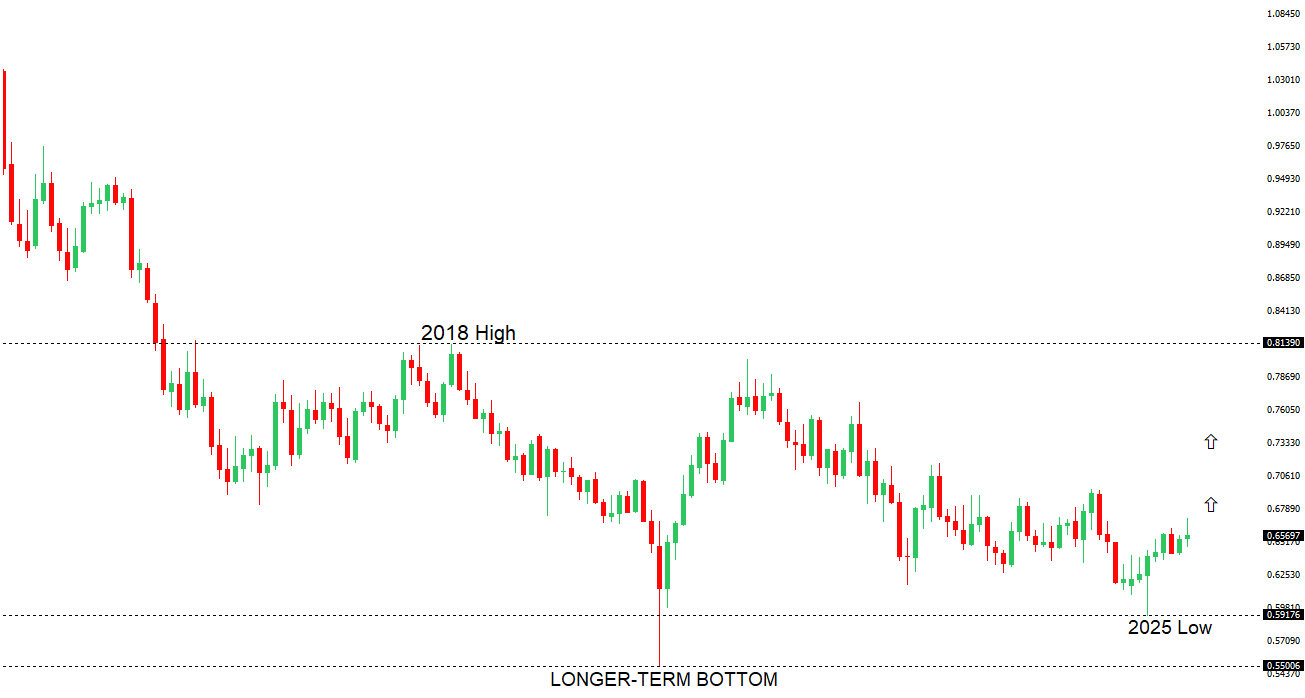
There are signs of the potential formation of a longer-term base with the market trading down into a meaningful longer-term support zone. Only a monthly close below 0.5500 would give reason for rethink. A monthly close back above 0.7000 will take the big picture pressure off the downside and strengthen case for a bottom.

AUDUSD Chart
R2 0.6707 - 17 September/2025 high - Strong
R1 0.6660 - 18 September high - Medium
S1 0.6540 - 9 October low - Medium
S1 0.6520 - 26 September low - Strong
AUDUSD: fundamental overview

The Reserve Bank of Australia is adopting a cautious approach to monetary easing, reducing expectations for rapid rate cuts and potentially strengthening the Australian dollar in the near term. Governor Bullock’s positive outlook on the economy and labor market, combined with recovering consumption, suggests a November rate cut is unlikely unless the Q3 CPI significantly underperforms. One notable Australian financial services company predicts the interest-rate gap with the US could favor Australia by mid-2026, potentially pushing the Australian dollar to 70 US cents if the RBA holds rates steady while the US Federal Reserve cuts rates further. Elevated consumer inflation expectations at 4.8%, driven by tight labor markets and rising costs, reinforce the RBA’s cautious stance.

 
Suggested reading

Careful What You Wish For: AI’s Downfall Would Hurt, A. Clark Estes, Vox (October 9, 2025)

Investors Don’t Fear The Shutdown. Maybe They Should, C. Smart, Barron’s (October 9, 2025)


Any opinions, news, research, analyses, prices or other information ("information") contained on this Blog, constitutes marketing communication and it has not been prepared in accordance with legal requirements designed to promote the independence of investment research. Further, the information contained within this Blog does not contain (and should not be construed as containing) investment advice or an investment recommendation, or an offer of, or solicitation for, a transaction in any financial instrument. LMAX Group has not verified the accuracy or basis-in-fact of any claim or statement made by any third parties as comments for every Blog entry.

LMAX Group will not accept liability for any loss or damage, including without limitation to, any loss of profit, which may arise directly or indirectly from use of or reliance on such information. No representation or warranty is given as to the accuracy or completeness of the above information. While the produced information was obtained from sources deemed to be reliable, LMAX Group does not provide any guarantees about the reliability of such sources. Consequently any person acting on it does so entirely at his or her own risk. It is not a place to slander, use unacceptable language or to promote LMAX Group or any other FX and CFD provider and any such postings, excessive or unjust comments and attacks will not be allowed and will be removed from the site immediately.

Day Image
9th October 2025 | view in browser
Gold outshines fading dollar

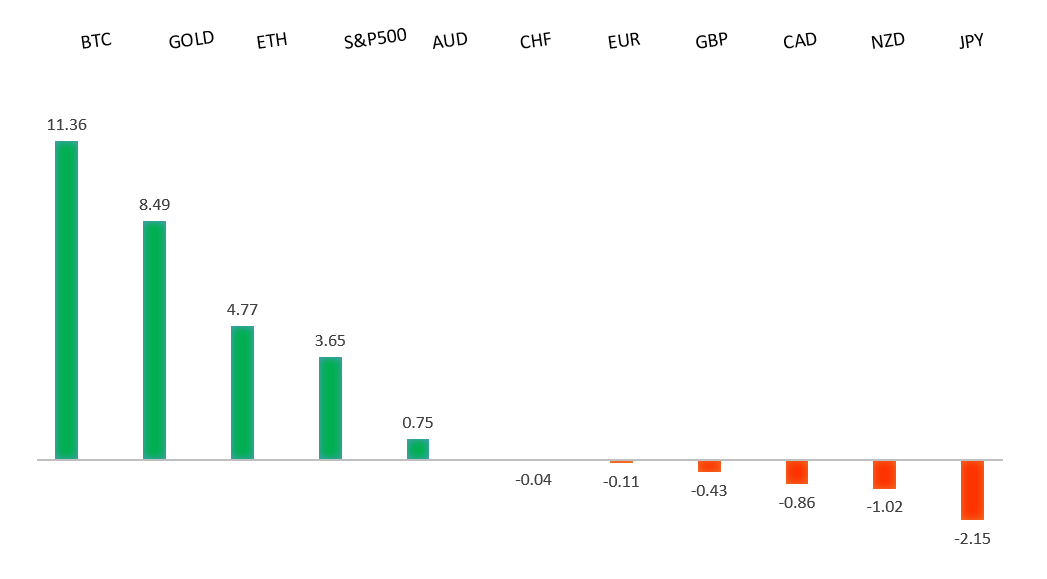
The U.S. dollar has experienced a significant decline of over 10% since the start of the year. Meanwhile, gold’s rise above $4,000 per ounce reflects growing investor preference for it over the dollar, while expectations of U.S. rate cuts and a Trump administration favoring a weaker dollar add uncertainty.


Performance chart 30day v. USD (%)
Performance Chart
 
 
Technical & fundamental highlights
EURUSD: technical overview

The Euro has broken out from a multi-month consolidation off a critical longer-term low. This latest push through the 2023 high (1.1276) lends further support to the case for a meaningful bottom, setting the stage for a bullish structural shift and the next major upside extension targeting the 2021 high at 1.2350. Setbacks should be exceptionally well supported ahead of 1.1300.

EURUSD Chart
R2 1.1919 - 16 September/2025 high -Strong
R1 1.1779 - 1 October high - Medium
S1 1.1600 - Figure - Medium
S2 1.1574 - 27 August low - Strong
EURUSD: fundamental overview

Germany’s industrial production dropped sharply by 4.3% in August, exceeding expectations of a 1.0% decline, driven by new U.S. tariffs, global uncertainty, and a significant 18.5% fall in automotive output. Factory orders hit a low not seen since 2012, and economists predict a bleak outlook for Europe’s largest economy due to weak demand and trade tensions, despite planned government investments. The European Central Bank is unlikely to cut rates soon, with policymakers like Escriva and Muller emphasizing flexibility and a stable 2% inflation target, while France’s political developments may help stabilize the euro.

 
USDJPY: technical overview

There are signs of a meaningful top in place after the market put in a multi-year high in 2024. At this point, the door is now open for a deeper setback below the 2024 low at 139.58, exposing a retest of the 2023 low. Rallies should be well capped below 155.00.

USDJPY Chart
R2 154.80 - 12 February high - Strong
R1 153.00 - 8 October high - Medium
S1 150.20 - 7 October low - Medium
S2 149.03 - 6 October low - Strong
USDJPY: fundamental overview

Markets are betting on aggressive monetary and fiscal policies from Sanae Takaichi, pushing USDJPY higher, but her need for coalition support from centrist parties like Komeito may lead to a more moderate approach than anticipated. Public concerns over inflation and her appointment of experienced finance ministers suggest restrained stimulus plans, with markets watching her upcoming meeting with BOJ Governor Ueda for clues on policy alignment. Despite expectations, Japan’s steady wage growth supports the BOJ’s cautious tightening path, and Takaichi’s ambitious promises may face challenges, potentially tempering market optimism and yen weakness, though failure to secure coalition deals could exacerbate yen depreciation.

 
AUDUSD: technical overview

There are signs of the potential formation of a longer-term base with the market trading down into a meaningful longer-term support zone. Only a monthly close below 0.5500 would give reason for rethink. A monthly close back above 0.7000 will take the big picture pressure off the downside and strengthen case for a bottom.

AUDUSD Chart
R2 0.6707 - 17 September/2025 high - Strong
R1 0.6660 - 18 September high - Medium
S1 0.6556 - 8 October low - Medium
S1 0.6520 - 26 September low - Strong
AUDUSD: fundamental overview

Markets have observed a shift toward a slower, more cautious monetary easing cycle from the Reserve Bank of Australia, reducing expectations for rapid rate cuts and supporting the Australian dollar in the near term. Most economists expect a 25-basis-point cut to 3.35% at the RBA’s November 4 meeting, though financial markets are less certain, with only a 37% chance priced in, reflecting concerns about rising inflation and a tight job market. Some economists and a hawkish minority even suggest a potential rate hike by mid-2026 if inflation persists. Meanwhile, Australia’s growing foreign reserves (A$107.1bn in September) and elevated consumer inflation expectations (4.8% in October) reinforce the RBA’s cautious stance, while a potential interest-rate gap with the U.S., where the Federal Reserve is expected to cut rates more aggressively, could push the Australian dollar to 70 US cents by mid-2026.

 
Suggested reading

Will Investors Need a Seatbelt This Month, or a Helmet?, M. Hulbert, MarketWatch (October 4, 2025)

How AMD’s Own Stock Will Finance OpenAI’s Chip Buys, J. Bort, TechCrunch (October 7, 2025)


Any opinions, news, research, analyses, prices or other information ("information") contained on this Blog, constitutes marketing communication and it has not been prepared in accordance with legal requirements designed to promote the independence of investment research. Further, the information contained within this Blog does not contain (and should not be construed as containing) investment advice or an investment recommendation, or an offer of, or solicitation for, a transaction in any financial instrument. LMAX Group has not verified the accuracy or basis-in-fact of any claim or statement made by any third parties as comments for every Blog entry.

LMAX Group will not accept liability for any loss or damage, including without limitation to, any loss of profit, which may arise directly or indirectly from use of or reliance on such information. No representation or warranty is given as to the accuracy or completeness of the above information. While the produced information was obtained from sources deemed to be reliable, LMAX Group does not provide any guarantees about the reliability of such sources. Consequently any person acting on it does so entirely at his or her own risk. It is not a place to slander, use unacceptable language or to promote LMAX Group or any other FX and CFD provider and any such postings, excessive or unjust comments and attacks will not be allowed and will be removed from the site immediately.

Day Image
8th October 2025 | view in browser
Fed’s next moves eyed amid shutdown

The global financial landscape is navigating a complex interplay of currency dynamics, political uncertainties, and monetary policy shifts. The U.S. dollar, despite a long-term bearish outlook, is showing signs of short-term strength, driven by technical support and a potential short squeeze as the yen and euro weaken due to political instability in Japan and France.


Performance chart 30day v. USD (%)
Performance Chart
 
 
Technical & fundamental highlights
EURUSD: technical overview

The Euro has broken out from a multi-month consolidation off a critical longer-term low. This latest push through the 2023 high (1.1276) lends further support to the case for a meaningful bottom, setting the stage for a bullish structural shift and the next major upside extension targeting the 2021 high at 1.2350. Setbacks should be exceptionally well supported ahead of 1.1300.

EURUSD Chart
R2 1.1919 - 16 September/2025 high -Strong
R1 1.1779 - 1 October high - Medium
S1 1.1600 - Figure - Medium
S2 1.1574 - 27 August low - Strong
EURUSD: fundamental overview

The euro may face short-term pressure if French parliamentary elections are called before year-end due to Prime Minister Lecornu’s resignation, potentially delaying its momentum, though analysts believe this won’t derail its overall uptrend. The European Central Bank is likely to maintain its current policy unless the crisis significantly impacts Eurozone-wide economic activity or financial stability. Historical data and analyst views from major US banks suggest that French political turmoil typically causes only temporary euro weakness, with broader economic factors quickly regaining influence. ECB President Christine Lagarde emphasizes the need for bold reforms to strengthen the euro’s global role, while recent German factory data highlights ongoing manufacturing challenges, with a surprise 0.8% drop in August orders despite resilient domestic demand.

 
USDJPY: technical overview

There are signs of a meaningful top in place after the market put in a multi-year high in 2024. At this point, the door is now open for a deeper setback below the 2024 low at 139.58, exposing a retest of the 2023 low. Rallies should be well capped below 155.00.

USDJPY Chart
R2 154.80 - 12 February high - Strong
R1 152.65 - 8 October high - Medium
S1 150.20 - 7 October low - Medium
S2 149.03 - 6 October low - Strong
USDJPY: fundamental overview

Despite market expectations of aggressive monetary and fiscal policies from Japan’s Sanae Takaichi, her lack of parliamentary majority and reliance on centrist coalition partners like Komeito may lead to more moderate policies than anticipated. Public concerns over inflation and pressure from international partners, particularly the U.S., could further temper her nationalist and reflationary agenda, potentially scaling back fiscal stimulus and monetary easing. Recent Japanese economic data shows a slowdown in wage growth to 1.5% in August, but steady base salary increases and a strong current account surplus signal resilience, supporting the Bank of Japan’s cautious policy normalization.

 
AUDUSD: technical overview

There are signs of the potential formation of a longer-term base with the market trading down into a meaningful longer-term support zone. Only a monthly close below 0.5500 would give reason for rethink. A monthly close back above 0.7000 will take the big picture pressure off the downside and strengthen case for a bottom.

AUDUSD Chart
R2 0.6707 - 17 September/2025 high - Strong
R1 0.6660 - 18 September high - Medium
S1 0.6520 - 26 September low - Medium
S1 0.6483 - 2 September low - Strong
AUDUSD: fundamental overview

Australian consumer confidence has hit a six-month low, with the Westpac Consumer Confidence Index dropping 3.5% to 92.1, driven by the Reserve Bank of Australia’s hawkish stance and renewed inflation concerns. Job advertisements fell 3.3% in September, but consumers remain optimistic about employment prospects. Markets expect a cautious RBA, reducing the likelihood of a November rate cut to 37%, while some economists predict a 25bps cut to 3.35% and another in 2026, though a hawkish minority warns of potential rate hikes if inflation persists. The Australian dollar is gaining strength due to a slower RBA easing cycle compared to expected U.S. Federal Reserve cuts, with forecasts suggesting it could reach 70 US cents by mid-2026.

 
Suggested reading

No BLS Report: Best News Investors Have Gotten, J. Calhoun, Alhambra (October 5, 2025)

What Are Circular AI Chip Deals? Should We Worry?, B. Colello, Morningstar (October 6, 2025)


Any opinions, news, research, analyses, prices or other information ("information") contained on this Blog, constitutes marketing communication and it has not been prepared in accordance with legal requirements designed to promote the independence of investment research. Further, the information contained within this Blog does not contain (and should not be construed as containing) investment advice or an investment recommendation, or an offer of, or solicitation for, a transaction in any financial instrument. LMAX Group has not verified the accuracy or basis-in-fact of any claim or statement made by any third parties as comments for every Blog entry.

LMAX Group will not accept liability for any loss or damage, including without limitation to, any loss of profit, which may arise directly or indirectly from use of or reliance on such information. No representation or warranty is given as to the accuracy or completeness of the above information. While the produced information was obtained from sources deemed to be reliable, LMAX Group does not provide any guarantees about the reliability of such sources. Consequently any person acting on it does so entirely at his or her own risk. It is not a place to slander, use unacceptable language or to promote LMAX Group or any other FX and CFD provider and any such postings, excessive or unjust comments and attacks will not be allowed and will be removed from the site immediately.

Day Image
6th October 2025 | view in browser
Global markets brace for fiscal strain

The U.S. economy faces uncertainty due to a government shutdown that has halted key data releases. Meanwhile, global markets are watching the Swiss National Bank’s increased euro purchases, Japan’s new leadership pushing for stimulus and low rates, and Australia’s cautiously optimistic outlook driven by a stronger yuan and a slower RBA easing cycle.


Performance chart 30day v. USD (%)
Performance Chart
 
 
Technical & fundamental highlights
EURUSD: technical overview

The Euro has broken out from a multi-month consolidation off a critical longer-term low. This latest push through the 2023 high (1.1276) lends further support to the case for a meaningful bottom, setting the stage for a bullish structural shift and the next major upside extension targeting the 2021 high at 1.2350. Setbacks should be exceptionally well supported ahead of 1.1300.

EURUSD Chart
R2 1.1919 - 16 September/2025 high -Strong
R1 1.1820 - 23 September high - Medium
S1 1.1646 - 25 September low - Medium
S2 1.1574 - 27 August low - Strong
EURUSD: fundamental overview

The euro remains above its 50-day moving average, driven by expectations of potential U.S. Federal Reserve rate cuts if economic data weakens, though a U.S. government shutdown has limited official data, stalling decisive movements. Private sector reports, like the ISM services and ADP employment data, suggest economic slowdown and persistent inflation concerns. Meanwhile, ECB President Christine Lagarde expressed confidence in the euro area’s stable inflation near 2%, indicating no immediate need for policy changes. The Swiss National Bank significantly increased euro purchases in Q2 2025 to counter Swiss franc appreciation, shifting reserves to favor the euro over the dollar, influenced by U.S. tariffs and trade tensions, potentially signaling a broader trend that could further weaken the dollar.

 
USDJPY: technical overview

There are signs of a meaningful top in place after the market put in a multi-year high in 2024. At this point, the door is now open for a deeper setback below the 2024 low at 139.58, exposing a retest of the 2023 low. Rallies should be well capped below 152.00.

USDJPY Chart
R2 151.21 - 28 March high - Strong
R1 150.92 - 1 August high - Strong
S1 149.00 - Figure - Medium
S2 147.46 - 23 September low - Medium
USDJPY: fundamental overview

Sanae Takaichi’s election as the leader of Japan’s Liberal Democratic Party positions her to become Japan’s first female prime minister, representing the party’s conservative wing and advocating for aggressive economic stimulus inspired by Abenomics. Her administration is expected to push for continued low interest rates and significant fiscal spending, potentially weakening the yen further and delaying Bank of Japan rate hikes, though some analysts believe the BOJ may still tighten policy due to persistent inflation above the 2% target and a weakening yen nearing 150 per dollar. Despite her preference for monetary easing, the BOJ’s independence and economic indicators like corporate profits and labor shortages could drive gradual rate increases, with a critical window for a hike in October or January, as later decisions may be complicated by budget planning and smaller wage hikes. Key economic data, including household spending, current account balance, and the Bloomberg Japan Economic survey, will be released this week, providing further insight.

 
AUDUSD: technical overview

There are signs of the potential formation of a longer-term base with the market trading down into a meaningful longer-term support zone. Only a monthly close below 0.5500 would give reason for rethink. A monthly close back above 0.7000 will take the big picture pressure off the downside and strengthen case for a bottom.

AUDUSD Chart
R2 0.6707 - 17 September/2025 high - Strong
R1 0.6660 - 18 September high - Medium
S1 0.6520 - 26 September low - Medium
S1 0.6483 - 2 September low - Strong
AUDUSD: fundamental overview

The Australian dollar is expected to start the week with a cautiously optimistic outlook due to recent U.S. economic data weakening the U.S. dollar, amid the ongoing U.S. government shutdown. Stronger Australian economic data and a slower, more cautious approach to monetary easing by the Reserve Bank of Australia have supported Aussie, with expectations of fewer Federal Reserve rate cuts in the U.S. further boosting its near-term prospects. However, risks like high domestic inflation, potential U.S. tariffs, and weaker Chinese demand could reverse these gains if economic momentum falters. Modest growth in August household spending (5.0% YoY vs. 5.2% forecast) suggests softening consumer demand, increasing the likelihood of an RBA rate cut in November. Meanwhile, a steadily strengthening Chinese yuan, seen as a strategic move in trade relations, supports Aussie as a yuan proxy. Key Australian data releases this week, including consumer confidence and inflation expectations, along with RBA officials’ testimony, will be closely watched.

 
Suggested reading

No Shutdown Ever Caused Bear Market, Recession, Fisher Investments (October 1, 2025)

Making a Case For Why The Market Will Keep Climbing, J. Remsburg, InvestorPlace (October 3, 2025)


Any opinions, news, research, analyses, prices or other information ("information") contained on this Blog, constitutes marketing communication and it has not been prepared in accordance with legal requirements designed to promote the independence of investment research. Further, the information contained within this Blog does not contain (and should not be construed as containing) investment advice or an investment recommendation, or an offer of, or solicitation for, a transaction in any financial instrument. LMAX Group has not verified the accuracy or basis-in-fact of any claim or statement made by any third parties as comments for every Blog entry.

LMAX Group will not accept liability for any loss or damage, including without limitation to, any loss of profit, which may arise directly or indirectly from use of or reliance on such information. No representation or warranty is given as to the accuracy or completeness of the above information. While the produced information was obtained from sources deemed to be reliable, LMAX Group does not provide any guarantees about the reliability of such sources. Consequently any person acting on it does so entirely at his or her own risk. It is not a place to slander, use unacceptable language or to promote LMAX Group or any other FX and CFD provider and any such postings, excessive or unjust comments and attacks will not be allowed and will be removed from the site immediately.

Day Image
3rd October 2025 | view in browser
Global markets cautious as US shutdown clouds data

The US government shutdown delayed key data like nonfarm payrolls and jobless claims, forcing reliance on private-sector data. The shutdown, combined with fiscal concerns and trade tensions, raises risks to economic growth.


Performance chart 30day v. USD (%)
Performance Chart
 
 
Technical & fundamental highlights
EURUSD: technical overview

The Euro has broken out from a multi-month consolidation off a critical longer-term low. This latest push through the 2023 high (1.1276) lends further support to the case for a meaningful bottom, setting the stage for a bullish structural shift and the next major upside extension targeting the 2021 high at 1.2350. Setbacks should be exceptionally well supported ahead of 1.1300.

EURUSD Chart
R2 1.1919 - 16 September/2025 high -Strong
R1 1.1820 - 23 September high - Medium
S1 1.1646 - 25 September low - Medium
S2 1.1574 - 27 August low - Strong
EURUSD: fundamental overview

ECB Governing Council member Martins Kazaks stated that the current 2% interest rate is suitable unless significant economic shocks occur, with the ECB ready to adjust policies based on inflation risks and new data. The eurozone unemployment rate rose slightly to 6.3% in August, but remains near historic lows, with resilience in southern countries like Spain and Italy contrasting with rising joblessness in Germany and France, highlighting the need for flexible ECB policies. Meanwhile, the Swiss National Bank increased foreign exchange interventions in Q2 2025, favoring euros over dollars to stabilize the Swiss franc amid U.S. tariffs and negative Swiss inflation, potentially signaling a broader shift in global currency reserve strategies. ECB’s Francois Villeroy de Galhau echoed calls for strengthening the euro’s global role through more euro-area safe assets, amid U.S. protectionism and stablecoin growth. Upcoming Eurozone PPI data for August 2025 is expected to show deflationary trends, with a forecasted year-on-year decline to -0.4%, reflecting weak industrial pricing power.

 
USDJPY: technical overview

There are signs of a meaningful top in place after the market put in a multi-year high in 2024. At this point, the door is now open for a deeper setback below the 2024 low at 139.58, exposing a retest of the 2023 low. Rallies should be well capped below 152.00.

USDJPY Chart
R2 149.96 - 26 September high - Strong
R1 148.85 - 30 September high - Medium
S1 146.58 - 1 October low - Medium
S2 145.48 - 17 September low - Strong
USDJPY: fundamental overview

The Bank of Japan is prepared to raise interest rates if economic growth and inflation align with projections, but has not set a specific timeline, according to Deputy Governor Shinichi Uchida and Governor Kazuo Ueda. Recent data, including the Q3 Tankan survey and revised PMI figures (Composite at 51.3, Services at 53.3), show improving business confidence and steady economic recovery, supporting potential policy tightening. However, global trade risks, domestic political uncertainty, and lack of clear guidance on rate hikes have left traders cautious, with USDJPY nearing key technical levels and the yen potentially strengthening if political stability emerges.

 
AUDUSD: technical overview

There are signs of the potential formation of a longer-term base with the market trading down into a meaningful longer-term support zone. Only a monthly close below 0.5500 would give reason for rethink. A monthly close back above 0.7000 will take the big picture pressure off the downside and strengthen case for a bottom.

AUDUSD Chart
R2 0.6707 - 17 September/2025 high - Strong
R1 0.6660 - 18 September high - Medium
S1 0.6520 - 26 September low - Medium
S1 0.6483 - 2 September low - Strong
AUDUSD: fundamental overview

The Australian dollar is gaining strength due to expectations of a slower, more cautious monetary easing cycle, supported by robust economic data and a potential rate divergence with the U.S., where more Federal Reserve rate cuts are anticipated. However, persistent domestic inflation and global risks, such as U.S. tariffs and weaker Chinese demand, could reverse these gains if economic momentum falters, possibly prompting the Reserve Bank of Australia to cut rates more decisively. Recent data shows modest household spending growth, suggesting the RBA might consider rate cuts in November, while steady Chinese yuan appreciation supports the Australian dollar as a yuan proxy. Australia’s September PMI data indicates continued economic expansion, with rising business activity, export orders, and employment, signaling a gradual recovery aided by easing inflation and lower interest rates.

 
Suggested reading

AI Isn’t Driving the Labor Market Slowdown, M. Leonhardt, Barron’s (October 2, 2025)

10 Cheap Wide-Moat Stocks For The Rest Of The Year, S. Dziubinski, Morningstar (October 1, 2025)


Any opinions, news, research, analyses, prices or other information ("information") contained on this Blog, constitutes marketing communication and it has not been prepared in accordance with legal requirements designed to promote the independence of investment research. Further, the information contained within this Blog does not contain (and should not be construed as containing) investment advice or an investment recommendation, or an offer of, or solicitation for, a transaction in any financial instrument. LMAX Group has not verified the accuracy or basis-in-fact of any claim or statement made by any third parties as comments for every Blog entry.

LMAX Group will not accept liability for any loss or damage, including without limitation to, any loss of profit, which may arise directly or indirectly from use of or reliance on such information. No representation or warranty is given as to the accuracy or completeness of the above information. While the produced information was obtained from sources deemed to be reliable, LMAX Group does not provide any guarantees about the reliability of such sources. Consequently any person acting on it does so entirely at his or her own risk. It is not a place to slander, use unacceptable language or to promote LMAX Group or any other FX and CFD provider and any such postings, excessive or unjust comments and attacks will not be allowed and will be removed from the site immediately.

Day Image
1st October 2025 | view in browser
Fed caution, jobs data key for dollar

Last week’s robust U.S. economic data and the Federal Reserve’s cautious approach to aggressive rate cuts supported a modest recovery in the U.S. dollar, though its broader bearish trend persists.


Performance chart 30day v. USD (%)
Performance Chart
 
 
Technical & fundamental highlights
EURUSD: technical overview

The Euro has broken out from a multi-month consolidation off a critical longer-term low. This latest push through the 2023 high (1.1276) lends further support to the case for a meaningful bottom, setting the stage for a bullish structural shift and the next major upside extension targeting the 2021 high at 1.2350. Setbacks should be exceptionally well supported ahead of 1.1300.

EURUSD Chart
R2 1.1919 - 16 September/2025 high -Strong
R1 1.1820 - 23 September high - Medium
S1 1.1646 - 25 September low - Medium
S2 1.1574 - 27 August low - Strong
EURUSD: fundamental overview

German inflation rose to 2.4% in September, surpassing expectations due to higher service costs and smaller energy price declines, contributing to a eurozone-wide trend where inflation hit 2.2%, above the ECB’s 2% target. ECB policymakers are divided, with some advocating for steady rates and others open to future easing, though decisions will remain data-driven. Despite short-term inflationary pressures from energy, Germany’s disinflation trend continues, with inflation expected to stabilize above 2%. The ECB remains cautious, while the eurozone benefits from a stronger euro and mitigated tariff impacts, though trade and geopolitical risks persist. Long-term, Germany’s reforms and infrastructure spending may boost eurozone growth, supporting a bullish euro against the dollar.

 
USDJPY: technical overview

There are signs of a meaningful top in place after the market put in a multi-year high in 2024. At this point, the door is now open for a deeper setback below the 2024 low at 139.58, exposing a retest of the 2023 low. Rallies should be well capped below 152.00.

USDJPY Chart
R2 150.92 - 1 August high - Strong
R1 149.96 - 26 September high - Medium
S1 147.46 - 23 September low - Medium
S2 145.48 - 17 September low - Strong
USDJPY: fundamental overview

The Bank of Japan is considering further interest rate hikes, with two of nine policy board members advocating for an immediate increase to address persistent inflation, while the majority prefers caution due to uncertainties around the U.S. economy. The BOJ plans to reduce its government bond purchases to ¥3.3 trillion monthly and offload some exchange-traded funds, signaling a gradual shift from ultra-loose monetary policy. Market expectations for an October rate hike have risen, with a 68% probability, supported by improving business confidence in Japan’s Tankan survey and comments from BOJ board member Asahi Noguchi, indicating stronger economic and price risks. These moves are expected to support the yen by tightening monetary policy and reducing bond market pressure.

 
AUDUSD: technical overview

There are signs of the potential formation of a longer-term base with the market trading down into a meaningful longer-term support zone. Only a monthly close below 0.5500 would give reason for rethink. A monthly close back above 0.7000 will take the big picture pressure off the downside and strengthen case for a bottom.

AUDUSD Chart
R2 0.6707 - 17 September/2025 high - Strong
R1 0.6660 - 18 September high - Medium
S1 0.6520 - 26 September low - Medium
S1 0.6483 - 2 September low - Strong
AUDUSD: fundamental overview

The Reserve Bank of Australia maintained the cash rate at 3.6%, as inflation, particularly in services, is not cooling as quickly as expected, with the 2.5% target still the priority. Despite resilient growth and a tight labor market, the RBA is adopting a cautious, data-driven approach, reducing expectations for near-term rate cuts, with markets now seeing less than a 40% chance of a cut in November and analysts predicting gradual easing into 2026. Rising labor costs and robust consumer spending support economic confidence, but softening job market trends and global risks like U.S. tariffs and weaker Chinese demand could prompt a policy shift if growth falters, while the Australian dollar strengthens due to slower easing expectations and potential rate divergence with the U.S.

 
Suggested reading

How First Brands Group collapsed, R. Smith, Financial Times (September 30, 2025)

Gold: The Most Interesting Chart In The World, J. Calhoun, Alhambra (September 28, 2025)


Any opinions, news, research, analyses, prices or other information ("information") contained on this Blog, constitutes marketing communication and it has not been prepared in accordance with legal requirements designed to promote the independence of investment research. Further, the information contained within this Blog does not contain (and should not be construed as containing) investment advice or an investment recommendation, or an offer of, or solicitation for, a transaction in any financial instrument. LMAX Group has not verified the accuracy or basis-in-fact of any claim or statement made by any third parties as comments for every Blog entry.

LMAX Group will not accept liability for any loss or damage, including without limitation to, any loss of profit, which may arise directly or indirectly from use of or reliance on such information. No representation or warranty is given as to the accuracy or completeness of the above information. While the produced information was obtained from sources deemed to be reliable, LMAX Group does not provide any guarantees about the reliability of such sources. Consequently any person acting on it does so entirely at his or her own risk. It is not a place to slander, use unacceptable language or to promote LMAX Group or any other FX and CFD provider and any such postings, excessive or unjust comments and attacks will not be allowed and will be removed from the site immediately.

Day Image
30th September 2025 | view in browser
Jobs report, tariffs, and shutdown fears pressure dollar

The U.S. dollar has shown signs of recovery due to resilient economic data and the Federal Reserve’s cautious approach to further rate cuts, but its broader downward trend persists, with technical indicators suggesting limited upward momentum.


Performance chart 30day v. USD (%)
Performance Chart
 
 
Technical & fundamental highlights
EURUSD: technical overview

The Euro has broken out from a multi-month consolidation off a critical longer-term low. This latest push through the 2023 high (1.1276) lends further support to the case for a meaningful bottom, setting the stage for a bullish structural shift and the next major upside extension targeting the 2021 high at 1.2350. Setbacks should be exceptionally well supported ahead of 1.1300.

EURUSD Chart
R2 1.1919 - 16 September/2025 high -Strong
R1 1.1820 - 23 September high - Medium
S1 1.1646 - 25 September low - Medium
S2 1.1574 - 27 August low - Strong
EURUSD: fundamental overview

This week, key Eurozone data includes September’s flash CPI, August’s unemployment rate, and August’s PPI numbers, with Germany’s inflation and unemployment figures also in focus. The Euro has risen after Spanish inflation increased to 3.0% in September, hinting at broader Eurozone inflation rising to 2.2%, which may discourage further ECB interest rate cuts and support euro bulls. ECB Chief Economist Philip Lane sees no major inflation risks, suggesting stable rates, while some economists predict the ECB will maintain its 2.00% deposit rate through 2026, though a small cut remains possible. Despite hawkish ECB views, potential trade uncertainties and economic weaknesses could revive dovish policies. Germany’s stable 6.3% unemployment and 2.2%-2.3% inflation rates reflect persistent price pressures, driven by food prices and easing energy deflation. Long-term, ECB caution contrasts with expected aggressive Fed rate cuts, supporting EUR strength, alongside Germany’s reforms boosting Eurozone growth prospects.

 
USDJPY: technical overview

There are signs of a meaningful top in place after the market put in a multi-year high in 2024. At this point, the door is now open for a deeper setback below the 2024 low at 139.58, exposing a retest of the 2023 low. Rallies should be well capped below 152.00.

USDJPY Chart
R2 150.92 - 1 August high - Strong
R1 149.96 - 26 September high - Medium
S1 147.46 - 23 September low - Medium
S2 145.48 - 17 September low - Strong
USDJPY: fundamental overview

The Bank of Japan is under increasing pressure to raise interest rates, with two board members advocating for a quarter-point hike at the September meeting, signaling a hawkish shift despite Governor Kazuo Ueda’s cautious stance. Rising inflation, particularly in food and daily goods, and a potential yen drop are fueling calls for a rate hike as early as October, especially if economic data remains strong and the U.S. avoids a downturn. The upcoming Tankan survey and Deputy Governor Uchida’s speech this week could provide further clues on BOJ’s policy direction, while Japan’s industrial production and retail sales weakened in August, though manufacturers expect a rebound in September. The Liberal Democratic Party’s leadership race, with Shinjiro Koizumi as a frontrunner, may influence BOJ’s confidence in raising rates, potentially strengthening the yen if Koizumi wins.

 
AUDUSD: technical overview

There are signs of the potential formation of a longer-term base with the market trading down into a meaningful longer-term support zone. Only a monthly close below 0.5500 would give reason for rethink. A monthly close back above 0.7000 will take the big picture pressure off the downside and strengthen case for a bottom.

AUDUSD Chart
R2 0.6707 - 17 September/2025 high - Strong
R1 0.6660 - 18 September high - Medium
S1 0.6520 - 26 September low - Medium
S1 0.6483 - 2 September low - Strong
AUDUSD: fundamental overview

The Reserve Bank of Australia maintained the cash rate at 3.60%, citing stable labor markets, recovering demand, and persistent inflation, signaling a cautious, data-driven approach with no immediate rate cuts expected. Despite recent rate cuts still impacting the economy, the RBA remains vigilant about inflation and global risks, suggesting a hawkish stance that may prolong restrictive monetary policy. Recent data shows a sharp decline in building approvals and private sector housing, highlighting weakness in construction and housing demand, while private sector credit growth remains steady but shows no significant acceleration.

 
Suggested reading

There’s No Dollar ‘Demand’ & ‘Supply’: There’s Only Production, J. Tamny, Forbes (September 28, 2025)

Companies You Least Expect Will Become AI Stocks, S. McBride, RiskHedge (September 26, 2025)


Any opinions, news, research, analyses, prices or other information ("information") contained on this Blog, constitutes marketing communication and it has not been prepared in accordance with legal requirements designed to promote the independence of investment research. Further, the information contained within this Blog does not contain (and should not be construed as containing) investment advice or an investment recommendation, or an offer of, or solicitation for, a transaction in any financial instrument. LMAX Group has not verified the accuracy or basis-in-fact of any claim or statement made by any third parties as comments for every Blog entry.

LMAX Group will not accept liability for any loss or damage, including without limitation to, any loss of profit, which may arise directly or indirectly from use of or reliance on such information. No representation or warranty is given as to the accuracy or completeness of the above information. While the produced information was obtained from sources deemed to be reliable, LMAX Group does not provide any guarantees about the reliability of such sources. Consequently any person acting on it does so entirely at his or her own risk. It is not a place to slander, use unacceptable language or to promote LMAX Group or any other FX and CFD provider and any such postings, excessive or unjust comments and attacks will not be allowed and will be removed from the site immediately.

Day Image
29th September 2025 | view in browser
US economy stays hot, Fed faces tough call

Last Friday’s stronger-than-expected US economic data, including personal income, personal spending, and a Core PCE Price Index increase, signaled robust consumer activity and persistent inflation above the Federal Reserve’s 2% target. This resilience complicates expectations for rapid Fed rate cuts, as markets anticipate a cautious, data-dependent approach.


Performance chart 30day v. USD (%)
Performance Chart
 
 
Technical & fundamental highlights
EURUSD: technical overview

The Euro has broken out from a multi-month consolidation off a critical longer-term low. This latest push through the 2023 high (1.1276) lends further support to the case for a meaningful bottom, setting the stage for a bullish structural shift and the next major upside extension targeting the 2021 high at 1.2350. Setbacks should be exceptionally well supported ahead of 1.1300.

EURUSD Chart
R2 1.1919 - 16 September/2025 high -Strong
R1 1.1820 - 23 September high - Medium
S1 1.1646 - 25 September low - Medium
S2 1.1574 - 27 August low - Strong
EURUSD: fundamental overview

Last week’s US data, including a revised Q2 GDP of 3.8% and strong durable goods orders, signals a robust economy, reducing expectations for Federal Reserve rate cuts from over 50bps to about 40bps by year-end, supporting the dollar. This week’s Eurozone data, such as September flash CPI, August unemployment, and PPI, along with US labor data, will influence the short-term EURUSD trend. Despite stable ECB rates at 2% and controlled inflation, rising consumer inflation expectations and potential trade uncertainties, like US tariffs, could prompt dovish ECB shifts, while long-term EURUSD bullishness persists due to divergent Fed and ECB policies and Germany’s economic reforms.

 
USDJPY: technical overview

There are signs of a meaningful top in place after the market put in a multi-year high in 2024. At this point, the door is now open for a deeper setback below the 2024 low at 139.58, exposing a retest of the 2023 low. Rallies should be well capped below 152.00.

USDJPY Chart
R2 150.92 - 1 August high - Strong
R1 149.96 - 26 September high - Medium
S1 147.46 - 23 September low - Medium
S2 145.48 - 17 September low - Strong
USDJPY: fundamental overview

Last week’s softer U.S. economic data and Tokyo CPI figures, which indicated cooling inflation in Japan, have tempered expectations for aggressive Federal Reserve rate cuts and supported USDJPY’s rise above its 200-day moving average. Despite inflation remaining above the Bank of Japan’s 2% target, weaker domestic demand and wage growth suggest limited sustained inflationary pressure, reducing the urgency for immediate BOJ rate hikes. However, internal pressure is mounting within the BOJ, with a 50% chance of a 25 basis point rate hike in October, driven by hawkish board members and concerns over yen depreciation fueling import-driven inflation. Key upcoming data, including the 3Q Tankan survey and BOJ Deputy Governor Uchida’s speech, will provide further clues on the BOJ’s policy direction, while USDJPY may struggle to break the 150 level without stronger fundamental catalysts.

 
AUDUSD: technical overview

There are signs of the potential formation of a longer-term base with the market trading down into a meaningful longer-term support zone. Only a monthly close below 0.5500 would give reason for rethink. A monthly close back above 0.7000 will take the big picture pressure off the downside and strengthen case for a bottom.

AUDUSD Chart
R2 0.6707 - 17 September/2025 high - Strong
R1 0.6660 - 18 September high - Medium
S1 0.6520 - 26 September low - Medium
S1 0.6483 - 2 September low - Strong
AUDUSD: fundamental overview

Market expectations suggest RBA Governor Michele Bullock will adopt a cautious tone at this week’s press conference, reflecting uncertainty about rate changes due to persistent inflation and a strong labor market. The RBA is likely to maintain its 3.6% cash rate, with the probability of a November rate cut dropping to 44% from near certainty. Analysts anticipate delayed rate cuts, possibly into 2026, as the RBA focuses on inflation risks, while investors monitor upcoming trade, household spending, and US jobs data for further cues.

 
Suggested reading

The graduate ‘jobpocalypse’: Where have all the entry-level jobs gone?, I. Berwick, FT (September 29, 2025)

Controversy creates stock market bargains, D. Lefkovitz, Morningstar (September 24, 2025)


Any opinions, news, research, analyses, prices or other information ("information") contained on this Blog, constitutes marketing communication and it has not been prepared in accordance with legal requirements designed to promote the independence of investment research. Further, the information contained within this Blog does not contain (and should not be construed as containing) investment advice or an investment recommendation, or an offer of, or solicitation for, a transaction in any financial instrument. LMAX Group has not verified the accuracy or basis-in-fact of any claim or statement made by any third parties as comments for every Blog entry.

LMAX Group will not accept liability for any loss or damage, including without limitation to, any loss of profit, which may arise directly or indirectly from use of or reliance on such information. No representation or warranty is given as to the accuracy or completeness of the above information. While the produced information was obtained from sources deemed to be reliable, LMAX Group does not provide any guarantees about the reliability of such sources. Consequently any person acting on it does so entirely at his or her own risk. It is not a place to slander, use unacceptable language or to promote LMAX Group or any other FX and CFD provider and any such postings, excessive or unjust comments and attacks will not be allowed and will be removed from the site immediately.

Day Image
26th September 2025 | view in browser
Strong U.S. data challenges rate cut hopes

Recent U.S. economic data, including a robust 3.8% GDP growth in Q2, a surprising 2.9% rise in durable goods orders, and lower-than-expected jobless claims at 218,000, indicate a strong economy, reducing the urgency for rapid Federal Reserve rate cuts.


Performance chart 30day v. USD (%)
Performance Chart
 
 
Technical & fundamental highlights
EURUSD: technical overview

The Euro has broken out from a multi-month consolidation off a critical longer-term low. This latest push through the 2023 high (1.1276) lends further support to the case for a meaningful bottom, setting the stage for a bullish structural shift and the next major upside extension targeting the 2021 high at 1.2350. Setbacks should be exceptionally well supported ahead of 1.1300.

EURUSD Chart
R2 1.1919 - 16 September/2025 high -Strong
R1 1.1820 - 23 September high - Medium
S1 1.1646 - 25 September low - Medium
S2 1.1574 - 27 August low - Strong
EURUSD: fundamental overview

Some economists now predict the European Central Bank will likely maintain its 2.00% deposit rate through 2025 and 2026, as inflation remains under control, though a small rate cut is possible. Bloomberg Economics notes that while hawkish views currently dominate, trade uncertainties, potential U.S. tariffs, and signs of economic weakness could shift ECB policy toward a rate cut, with timing being the main uncertainty. Recent German consumer confidence data shows slight improvement (-22.3 vs. forecast -23.3), driven by rising income expectations, but ongoing concerns about jobs and inflation keep sentiment fragile, impacting the broader eurozone outlook. Upcoming ECB data suggests inflation expectations are stabilizing near the 2% target, with 1-year CPI at 2.50% and 3-year at 2.40%, reflecting effective monetary policy and easing inflation pressures.

 
USDJPY: technical overview

There are signs of a meaningful top in place after the market put in a multi-year high in 2024. At this point, the door is now open for a deeper setback below the 2024 low at 139.58, exposing a retest of the 2023 low. Rallies should be well capped below 152.00.

USDJPY Chart
R2 150.92 - 1 August high - Strong
R1 149.96 - 26 September high - Medium
S1 147.46 - 23 September low - Medium
S2 145.48 - 17 September low - Strong
USDJPY: fundamental overview

Tokyo’s September CPI held steady at 2.5% year-on-year, below the expected 2.8%, with core inflation measures also at 2.5%, down from 3.0% previously, signaling a slowdown in inflationary pressure. Despite inflation remaining above the Bank of Japan’s 2% target, the softening data reduces expectations for immediate rate hikes, though a 25 basis point increase by year-end remains possible. Japan’s 40-year bond auction saw strong demand, lowering yields to 3.31%, reflecting market stability amid political transitions and reduced volatility. The BOJ’s next moves may hinge on global economic trends, particularly U.S. jobs data, which could influence USDJPY, currently testing but struggling to break the 150 level.

 
AUDUSD: technical overview

There are signs of the potential formation of a longer-term base with the market trading down into a meaningful longer-term support zone. Only a monthly close below 0.5500 would give reason for rethink. A monthly close back above 0.7000 will take the big picture pressure off the downside and strengthen case for a bottom.

AUDUSD Chart
R2 0.6707 - 17 September/2025 high - Strong
R1 0.6660 - 18 September high - Medium
S1 0.6526 - 25 September low - Medium
S1 0.6483 - 2 September low - Strong
AUDUSD: fundamental overview

Australia’s job vacancies fell by 2.7% quarter-on-quarter, a sharp contrast to the previous 2.8% rise, signaling a cooling labor market. August data showed a net loss of 5,400 jobs, with full-time jobs dropping significantly while part-time roles increased. Despite this, the Reserve Bank of Australia views the labor market as near full employment and is likely to maintain a cautious approach, balancing employment support with inflation, which is now at 3.6% within the target range. Economists predict limited rate cuts, possibly 50 basis points, but the upcoming RBA meeting will be key for hints on faster monetary easing.

 
Suggested reading

The Bond Market Isn’t Buying The AI Hype, M. Hulbert, MarketWatch (September 25, 2025)

Five Pearls of Wisdom From a Legend of Financial Writing, R. Lieber, NY Times (September 23, 2025)


Any opinions, news, research, analyses, prices or other information ("information") contained on this Blog, constitutes marketing communication and it has not been prepared in accordance with legal requirements designed to promote the independence of investment research. Further, the information contained within this Blog does not contain (and should not be construed as containing) investment advice or an investment recommendation, or an offer of, or solicitation for, a transaction in any financial instrument. LMAX Group has not verified the accuracy or basis-in-fact of any claim or statement made by any third parties as comments for every Blog entry.

LMAX Group will not accept liability for any loss or damage, including without limitation to, any loss of profit, which may arise directly or indirectly from use of or reliance on such information. No representation or warranty is given as to the accuracy or completeness of the above information. While the produced information was obtained from sources deemed to be reliable, LMAX Group does not provide any guarantees about the reliability of such sources. Consequently any person acting on it does so entirely at his or her own risk. It is not a place to slander, use unacceptable language or to promote LMAX Group or any other FX and CFD provider and any such postings, excessive or unjust comments and attacks will not be allowed and will be removed from the site immediately.

Day Image
25th September 2025 | view in browser
Powell stays cautious on rate cuts

Federal Reserve Chair Jerome Powell, in a recent speech, expressed caution about aggressively cutting interest rates, citing persistent inflation concerns and a need for a data-dependent approach, despite acknowledging a slowing labor market.


Performance chart 30day v. USD (%)
Performance Chart
 
 
Technical & fundamental highlights
EURUSD: technical overview

The Euro has broken out from a multi-month consolidation off a critical longer-term low. This latest push through the 2023 high (1.1276) lends further support to the case for a meaningful bottom, setting the stage for a bullish structural shift and the next major upside extension targeting the 2021 high at 1.2350. Setbacks should be exceptionally well supported ahead of 1.1300.

EURUSD Chart
R2 1.1919 - 16 September/2025 high -Strong
R1 1.1849 - 18 September high - Medium
S1 1.1700 - Figure - Medium
S2 1.1660 - 11 September low - Medium
EURUSD: fundamental overview

German business confidence unexpectedly declined in September 2025, with the Ifo expectations index dropping to 89.7, reflecting skepticism about Chancellor Friedrich Merz’s economic recovery plans, as borrowed funds were directed more toward consumption than modernization. The manufacturing sector faces challenges from external pressures like U.S. tariffs on EU goods, while structural issues such as pension reform and bureaucracy remain unaddressed, dimming hopes for a robust recovery. Meanwhile, German consumer confidence is expected to slightly improve to -23.3 in October but remains low due to concerns over the economy, job security, and inflation. The European Central Bank is advancing plans for a digital euro by 2029 to enhance payment sovereignty, though legislative hurdles and member-state agreements are still needed.

 
USDJPY: technical overview

There are signs of a meaningful top in place after the market put in a multi-year high in 2024. At this point, the door is now open for a deeper setback below the 2024 low at 139.58, exposing a retest of the 2023 low. Rallies should be well capped below 152.00.

USDJPY Chart
R2 150.92 - 1 August high - Strong
R1 149.14 - 3 September high - Medium
S1 146.28 - 16 September low - Medium
S2 145.48 - 17 September low - Strong
USDJPY: fundamental overview

Sanae Takaichi, a key contender in Japan’s LDP leadership race, has softened her previously dovish stance on monetary policy, emphasizing that while the government sets broad economic goals, the Bank of Japan should independently determine policy details. She cautions against rapid rate hikes due to potential harm to corporate investment but acknowledges Japan’s stable bond market, driven by strong domestic ownership. Despite her shift, analysts expect the BOJ to proceed with rate hikes as early as October, supported by persistent inflation above the 2% target and solid wage growth, with upcoming Tokyo CPI data likely to reinforce this outlook. Meanwhile, Japan’s Finance Ministry will cut super-long bond issuance to ease market pressure, a move seen as slightly positive for bond market stability and the yen, though broader fiscal credibility remains a concern amid political uncertainty.

 
AUDUSD: technical overview

There are signs of the potential formation of a longer-term base with the market trading down into a meaningful longer-term support zone. Only a monthly close below 0.5500 would give reason for rethink. A monthly close back above 0.7000 will take the big picture pressure off the downside and strengthen case for a bottom.

AUDUSD Chart
R2 0.6707 - 17 September/2025 high - Strong
R1 0.6660 - 18 September high - Medium
S1 0.6546 - 8 September low - Medium
S1 0.6483 - 2 September low - Strong
AUDUSD: fundamental overview

RBA Governor Michele Bullock indicated that Australia’s economy is performing as expected or slightly better, with inflation within the 2–3% target and unemployment near full employment. The RBA remains focused on controlling inflation, leading to a cautious market outlook, though a November rate cut is still anticipated. A recent “productive” Xi-Trump call has improved US-China relations, potentially boosting high-beta currencies like the Australian dollar if tensions continue to ease. Despite a 2.7% decline in job vacancies and a net job loss in August, the RBA is likely to maintain a balanced approach, with economists expecting only a modest 50 basis point rate cut due to limited labor market slack.

 
Suggested reading

Bangladesh’s missing billions, stolen in plain sight, Financial Times (September 11, 2025)

Amid Divide Within the FOMC, Making Sense of ‘Dot Plot’, N. Goodkind, Barron’s (September 19, 2025)


Any opinions, news, research, analyses, prices or other information ("information") contained on this Blog, constitutes marketing communication and it has not been prepared in accordance with legal requirements designed to promote the independence of investment research. Further, the information contained within this Blog does not contain (and should not be construed as containing) investment advice or an investment recommendation, or an offer of, or solicitation for, a transaction in any financial instrument. LMAX Group has not verified the accuracy or basis-in-fact of any claim or statement made by any third parties as comments for every Blog entry.

LMAX Group will not accept liability for any loss or damage, including without limitation to, any loss of profit, which may arise directly or indirectly from use of or reliance on such information. No representation or warranty is given as to the accuracy or completeness of the above information. While the produced information was obtained from sources deemed to be reliable, LMAX Group does not provide any guarantees about the reliability of such sources. Consequently any person acting on it does so entirely at his or her own risk. It is not a place to slander, use unacceptable language or to promote LMAX Group or any other FX and CFD provider and any such postings, excessive or unjust comments and attacks will not be allowed and will be removed from the site immediately.