Day Image
25th August 2025 | view in browser
Powell hints at rate cuts as economy cools

Federal Reserve Chair Jerome Powell’s recent Jackson Hole speech signaled a dovish shift, strongly suggesting a potential rate cut at the September FOMC meeting.


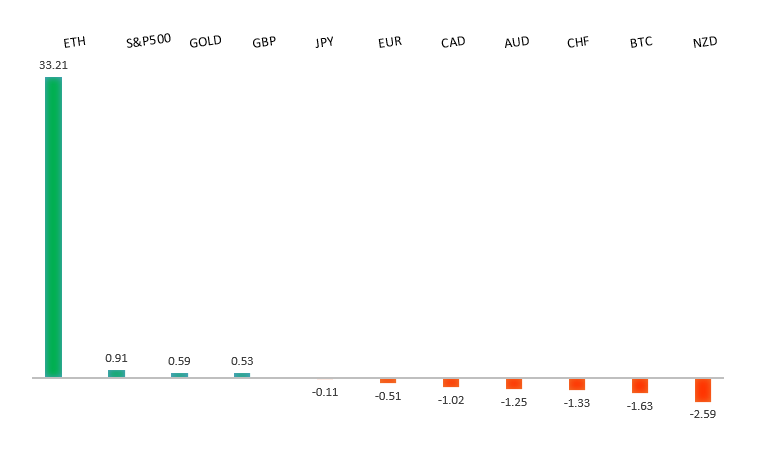
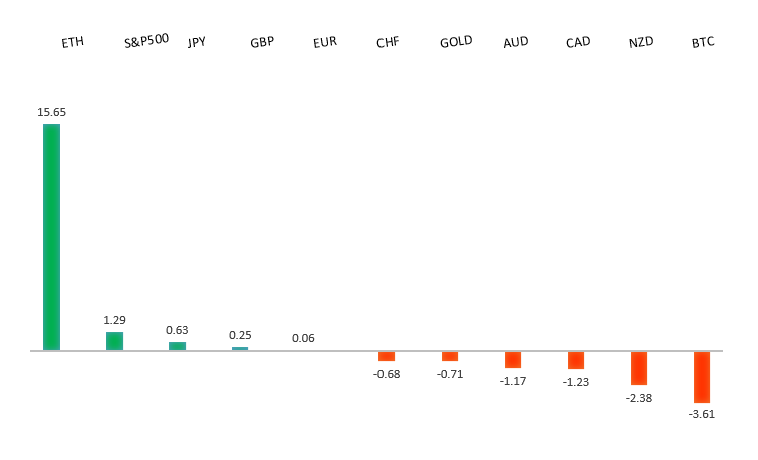
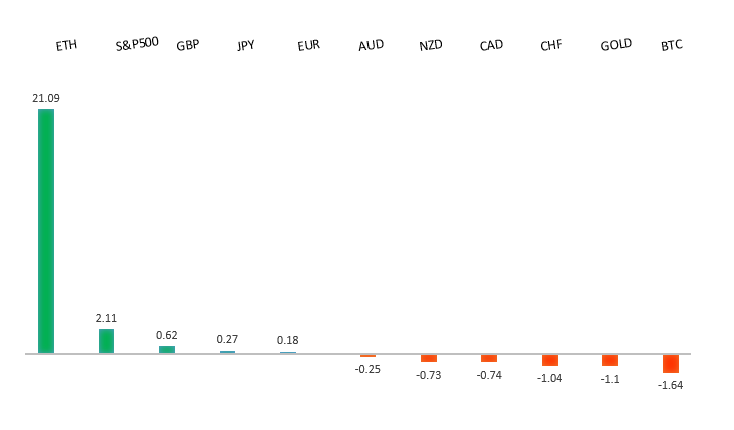
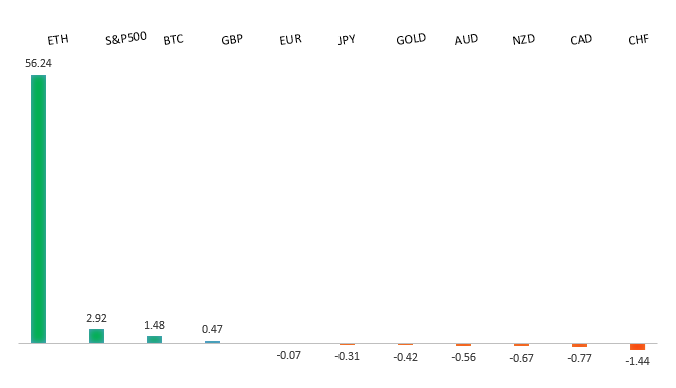
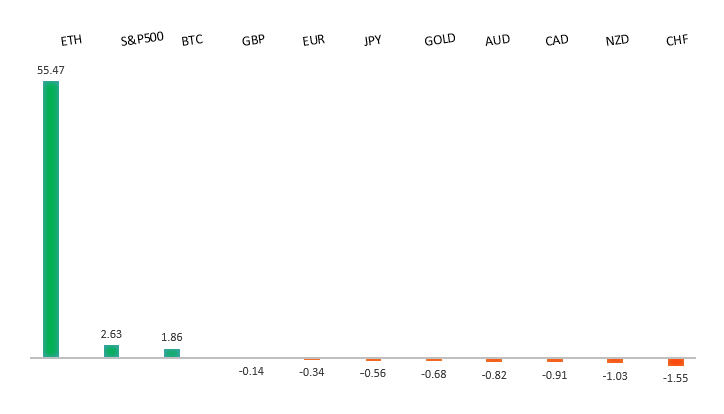
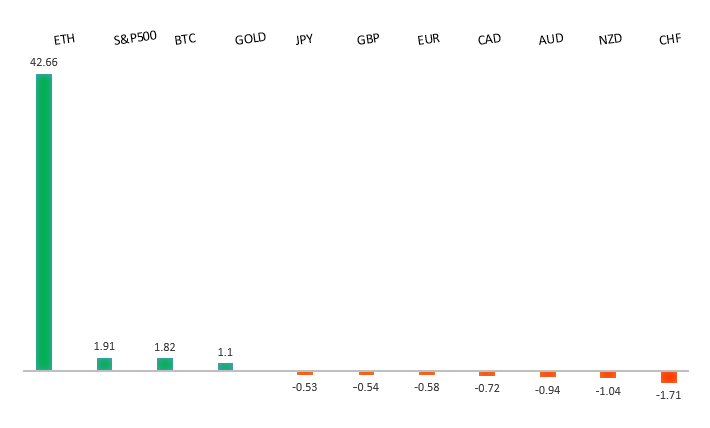
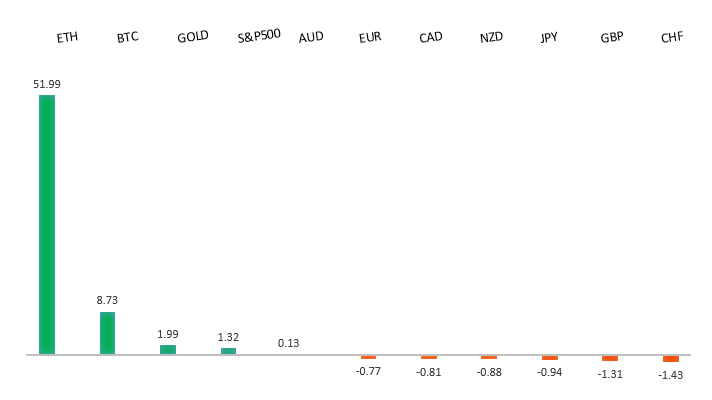
Performance chart 30day v. USD (%)
Performance Chart
 
 
Technical & fundamental highlights
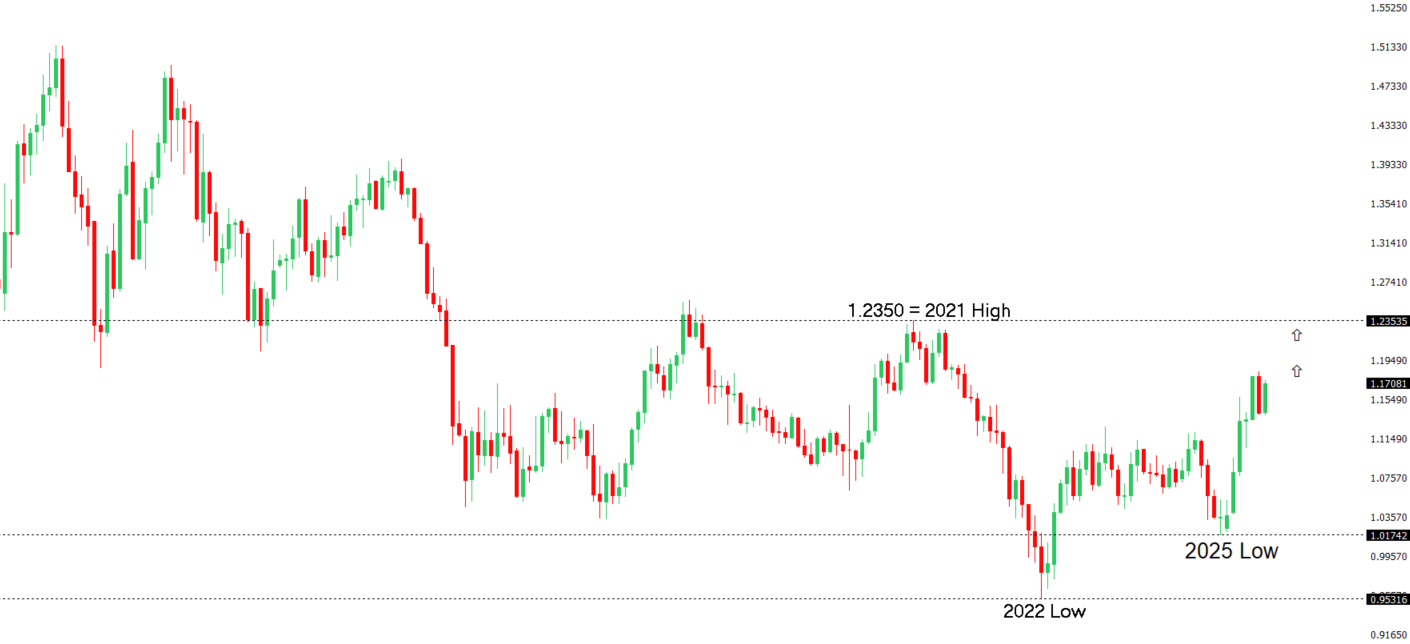
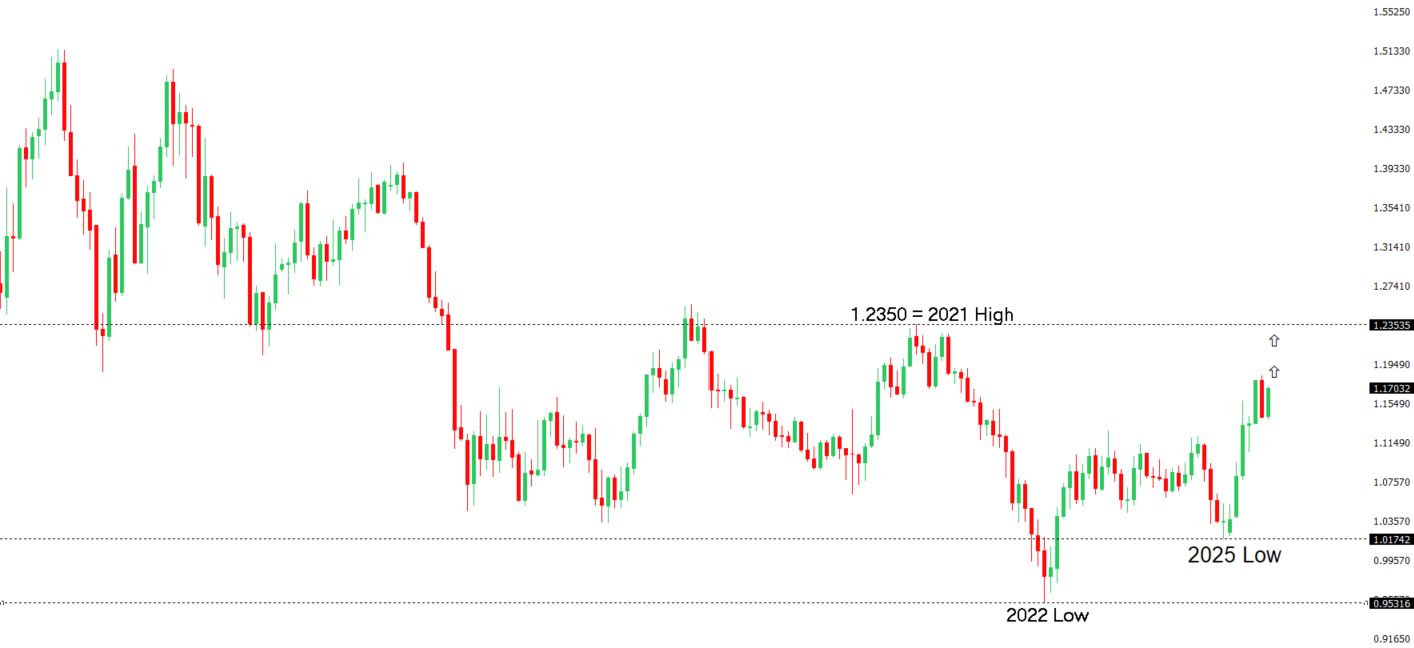
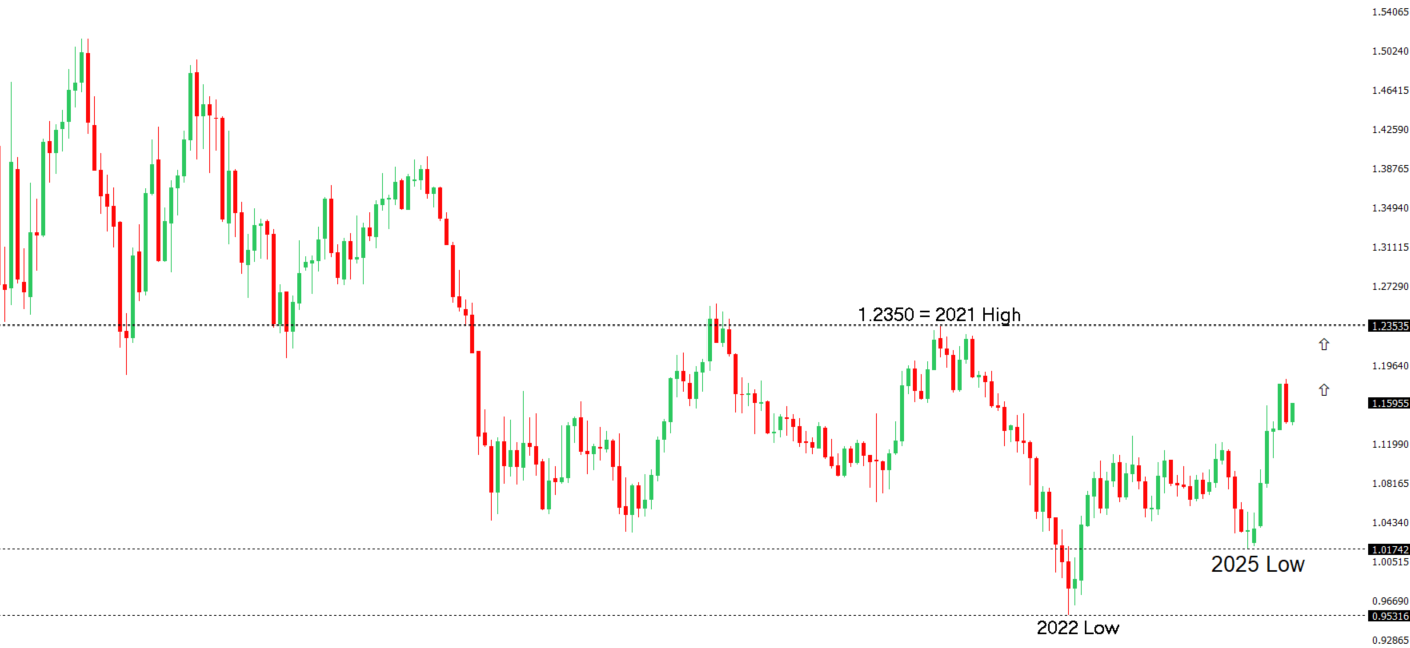
EURUSD: technical overview

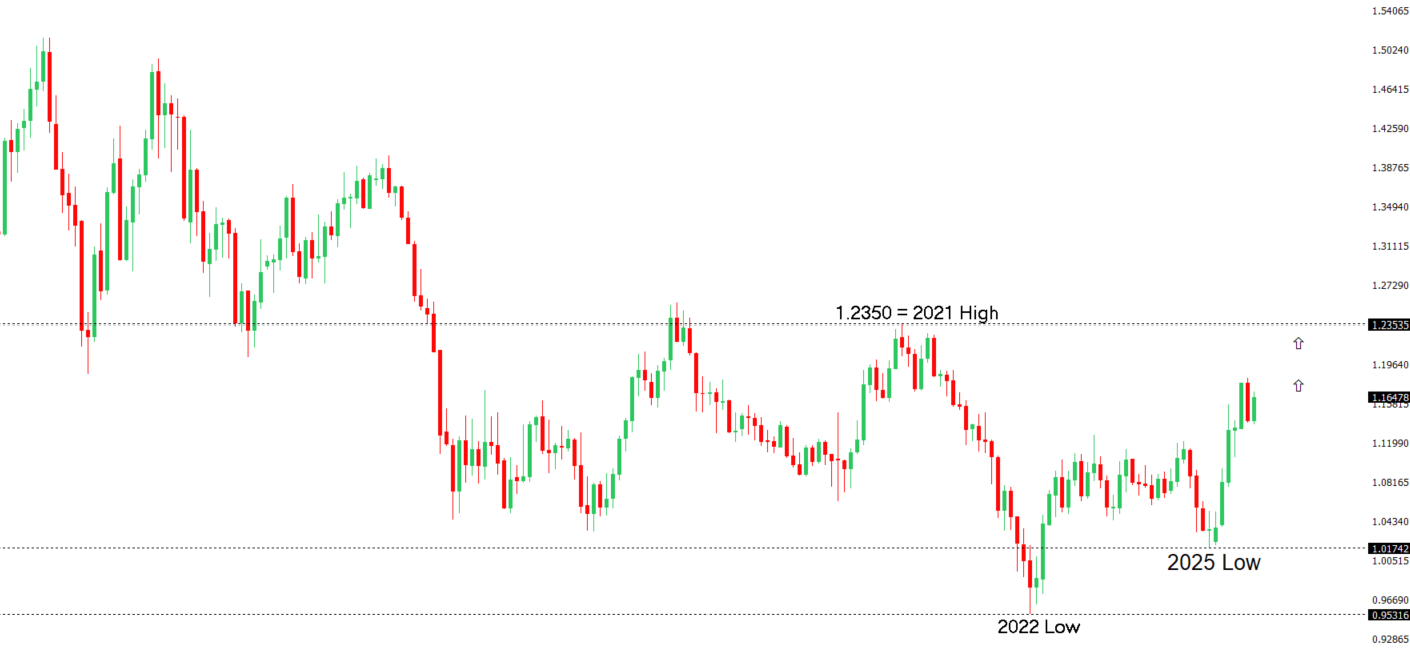
The Euro has broken out from a multi-month consolidation off a critical longer-term low. This latest push through the 2023 high (1.1276) lends further support to the case for a meaningful bottom, setting the stage for a bullish structural shift and the next major upside extension targeting the 2021 high at 1.2350. Setbacks should be exceptionally well supported ahead of 1.1000.

EURUSD Chart
R2 1.1789 - 24 July high - Medium
R1 1.1743 - 22 August high - Medium
S1 1.1583 - 22 August low - Medium
S2 1.1392 - 1 August low - Strong
EURUSD: fundamental overview

Federal Reserve Chair Powell is leaning toward rate cuts to support employment, with markets expecting an 84% chance of a cut in September and three by early 2026, while the European Central Bank remains cautious, holding rates at 2.15% and 2% with a “wait-and-see” approach due to stable 2% inflation and steady growth. Eurozone wage growth at 3.95% year-on-year exceeds ECB forecasts, but officials anticipate moderation and see no urgent need for further cuts, supported by a resilient labor market that grew 4.1% since 2021. ECB President Lagarde emphasized labor market strength but noted uncertainties from automation and AI, while warning against political interference in central bank decisions. Upcoming Eurozone data, including economic confidence and German business and consumer surveys, will provide further insights.

 
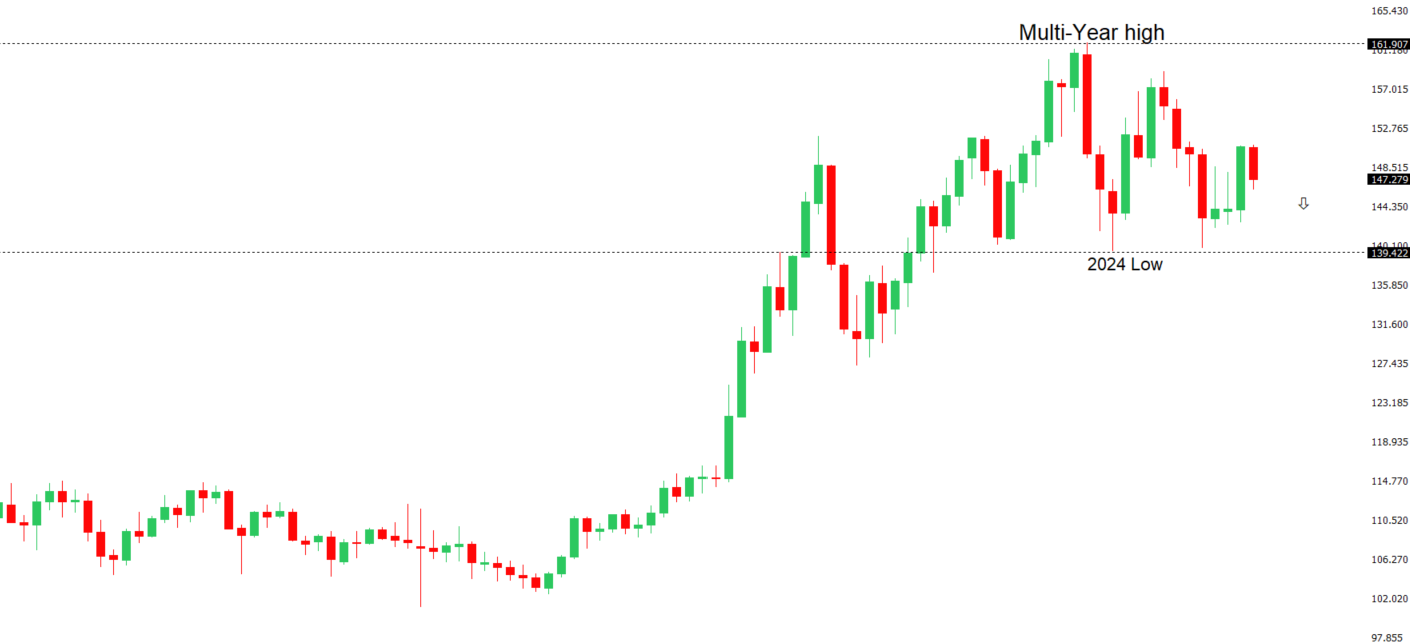
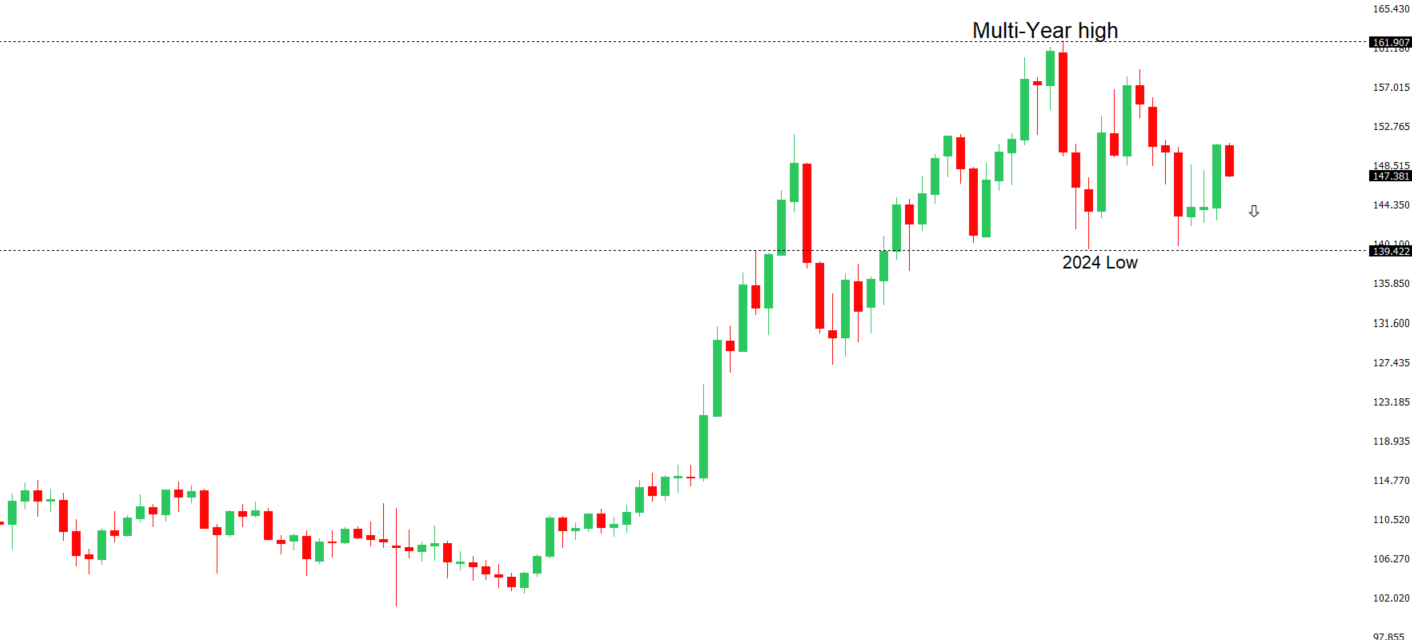
USDJPY: technical overview

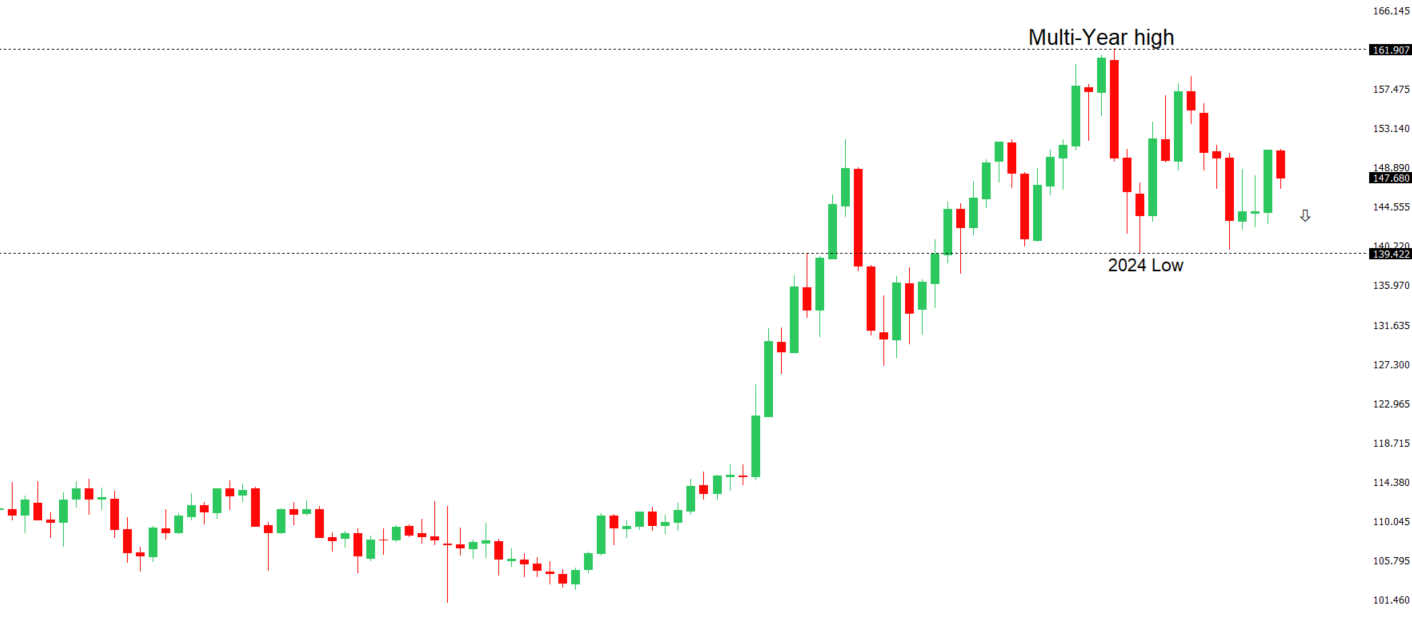
There are signs of a meaningful top in place after the market put in a multi-year high in 2024. At this point, the door is now open for a deeper setback below the 2024 low at 139.58, exposing a retest of the 2023 low. Rallies should be well capped below 152.00.

USDJPY Chart
R2 150.92 - 1 August high - Strong
R1 148.52 - 12 August high - Medium
S1 146.21 - 14 August low - Medium
S2 145.85 - 24 July low - Strong
USDJPY: fundamental overview

Strong U.S. economic data recently lowered expectations for a Federal Reserve rate cut in September, dropping from a near-certain 100% to 72%, though Fed Chair Powell’s Jackson Hole speech surprised markets by supporting rate cuts due to labor market concerns, weakening the dollar against G10 currencies. Meanwhile, Japan’s persistent inflation and tight labor market, with core inflation at 3.1%, have fueled speculation of a Bank of Japan rate hike by October, as Governor Kazuo Ueda highlighted wage growth and structural inflation drivers. Markets anticipate gradual BOJ policy tightening, boosting Japanese yields and the yen, while upcoming U.S. rate cuts may drive capital flows to Japan. Key Japanese data this week, including unemployment, Tokyo inflation, industrial production, retail sales, and consumer confidence, will provide further insight.

 
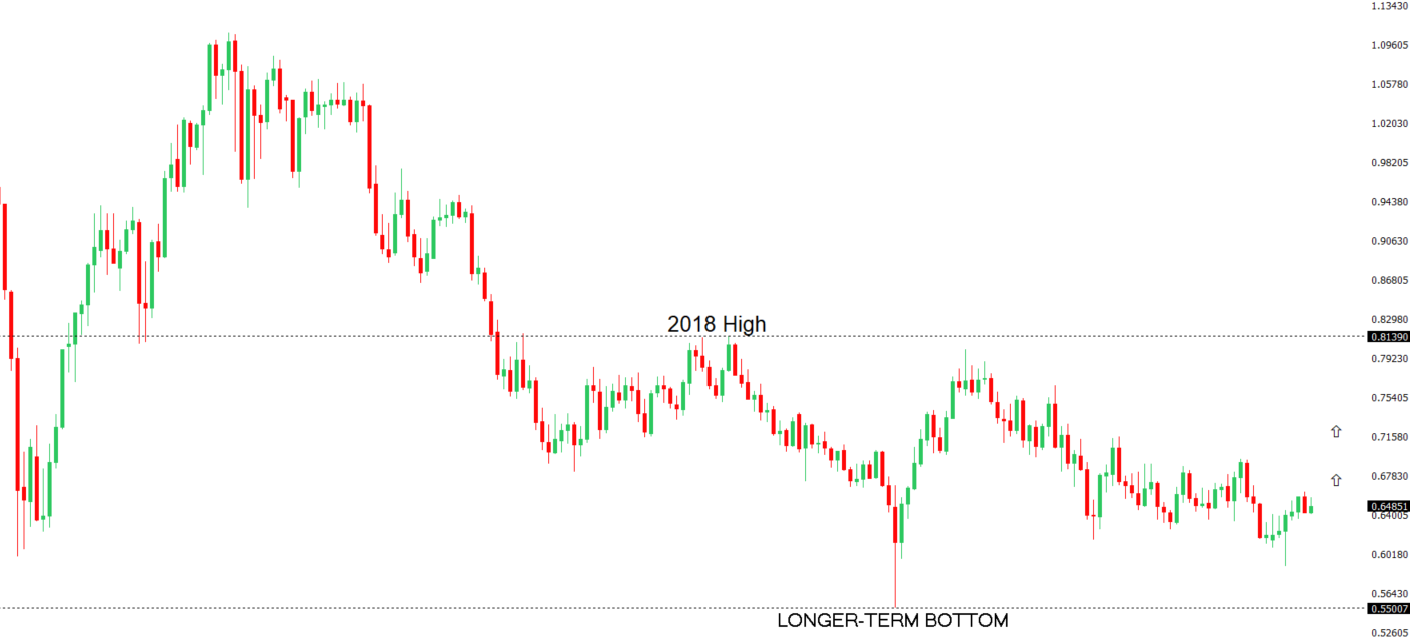
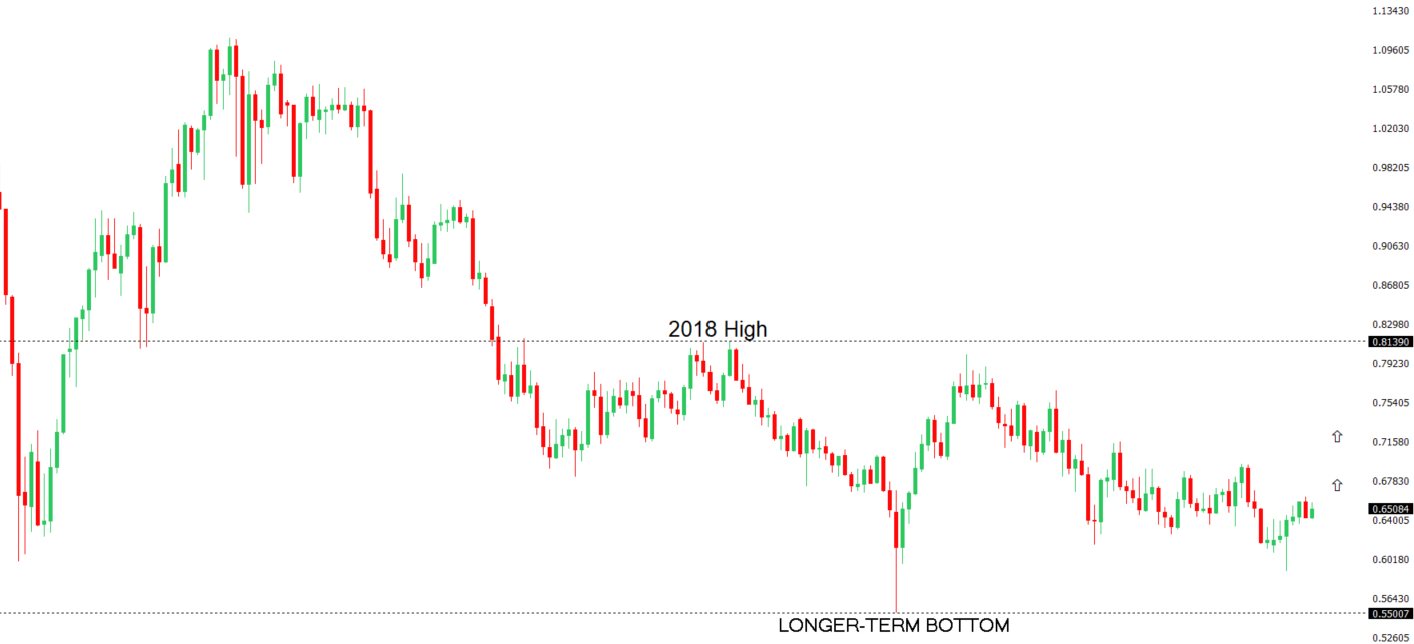
AUDUSD: technical overview

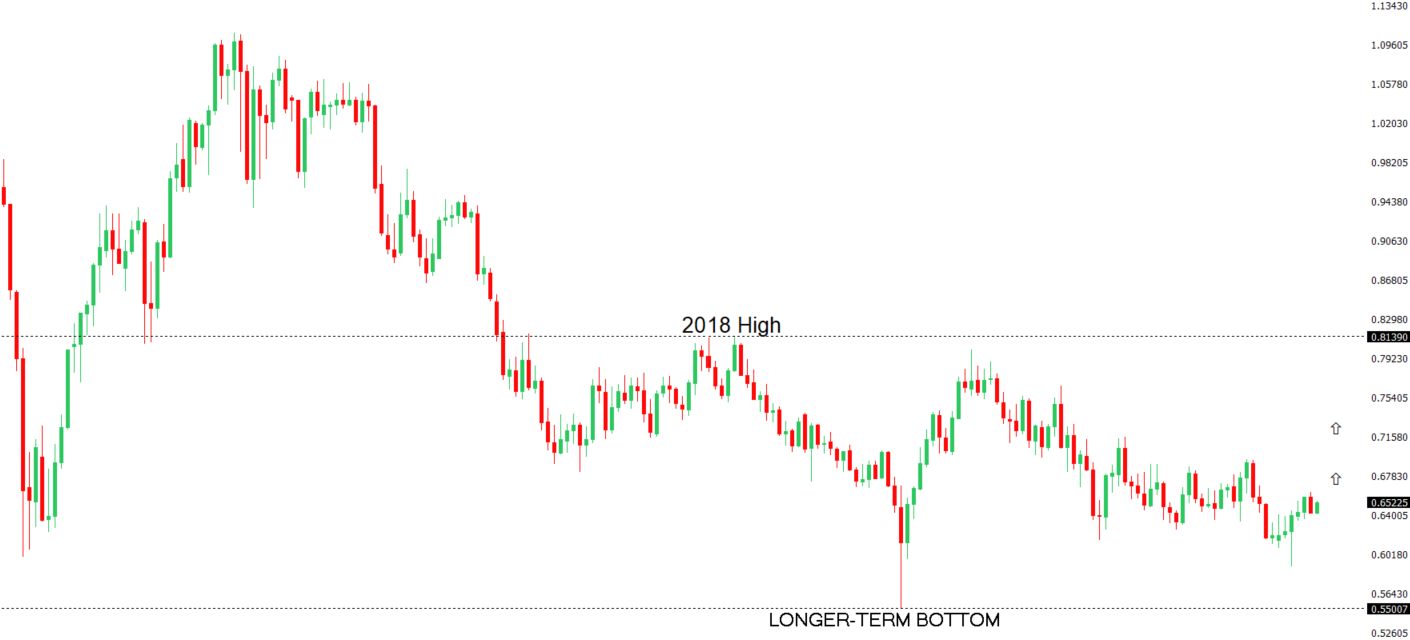
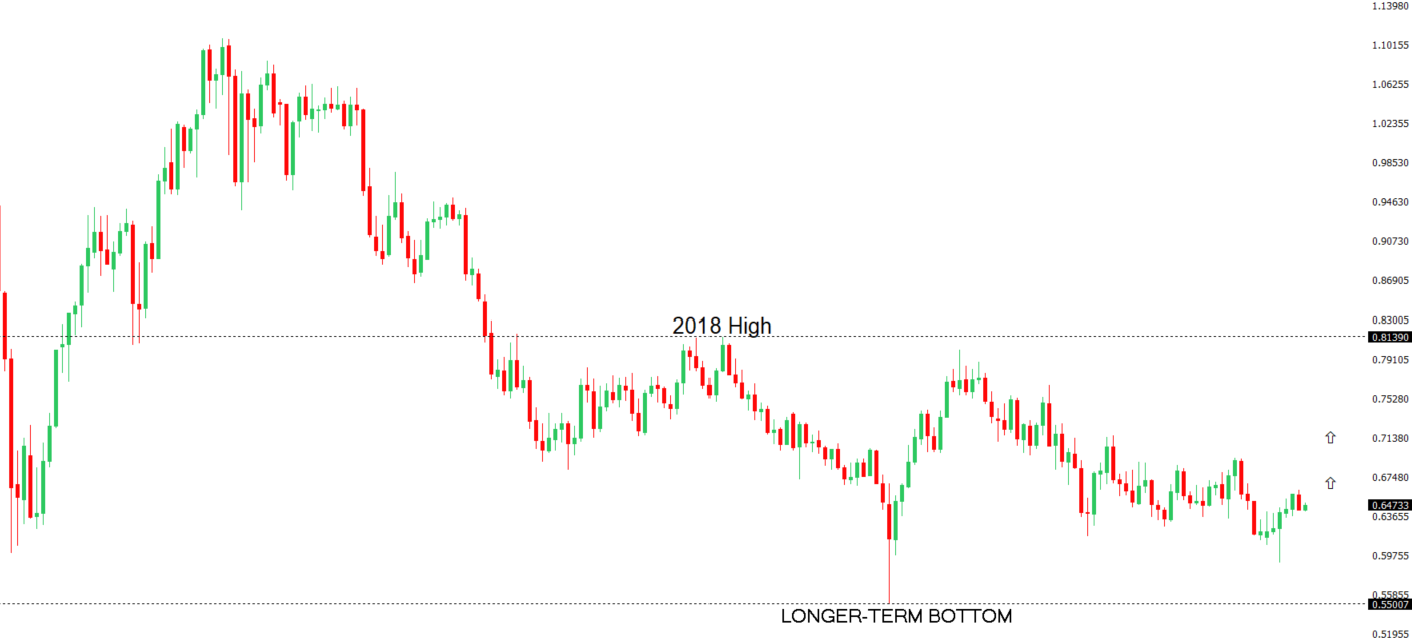
There are signs of the potential formation of a longer-term base with the market trading down into a meaningful longer-term support zone. Only a monthly close below 0.5500 would give reason for rethink. A monthly close back above 0.7000 will take the big picture pressure off the downside and strengthen case for a bottom.

AUDUSD Chart
R2 0.6600 - Figure - Medium
R1 0.6569 - 14 August high - Medium
S1 0.6414 - 22 August low - Medium
S1 0.6373 - 23 June low - Strong
AUDUSD: fundamental overview

Federal Reserve Chair Powell’s dovish comments at the Jackson Hole symposium, emphasizing employment risks and potential rate cuts, led to a drop in Treasury yields and a risk-on market sentiment, boosting the Australian dollar as AUD-US yield spreads widened. Markets have largely priced in the Reserve Bank of Australia’s recent dovish stance, limiting further downside for the Australian Dollar unless new surprises emerge. Attention now turns to Australia’s July CPI report on August 27, which could influence near-term Aussie movements, though the RBA is likely to hold rates steady in September, with a potential cut in November, while U.S. data will play a bigger role in Aussie trends.

 
Suggested reading

AI Is Providing Disruption That Education Really Needs, S. McBride, RiskHedge (August 22, 2025)

Markets Are Pleased Powell Didn’t Ignite a Fire In the ‘Hole’, P. O’Hare, Briefing (August 22, 2025)


Any opinions, news, research, analyses, prices or other information ("information") contained on this Blog, constitutes marketing communication and it has not been prepared in accordance with legal requirements designed to promote the independence of investment research. Further, the information contained within this Blog does not contain (and should not be construed as containing) investment advice or an investment recommendation, or an offer of, or solicitation for, a transaction in any financial instrument. LMAX Group has not verified the accuracy or basis-in-fact of any claim or statement made by any third parties as comments for every Blog entry.

LMAX Group will not accept liability for any loss or damage, including without limitation to, any loss of profit, which may arise directly or indirectly from use of or reliance on such information. No representation or warranty is given as to the accuracy or completeness of the above information. While the produced information was obtained from sources deemed to be reliable, LMAX Group does not provide any guarantees about the reliability of such sources. Consequently any person acting on it does so entirely at his or her own risk. It is not a place to slander, use unacceptable language or to promote LMAX Group or any other FX and CFD provider and any such postings, excessive or unjust comments and attacks will not be allowed and will be removed from the site immediately.

Day Image
21st August 2025 | view in browser
Powell’s neutral stance lifts dollar pre-Jackson Hole

The U.S. dollar ended Wednesday mid-range as markets digested the Federal Reserve’s latest minutes and speculation about a potential Trump-appointed replacement for Governor Cook.


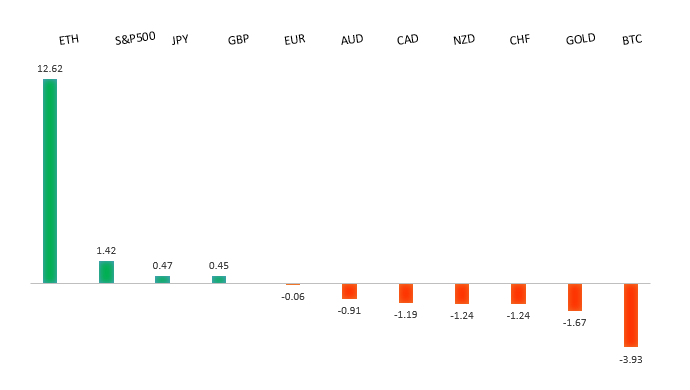
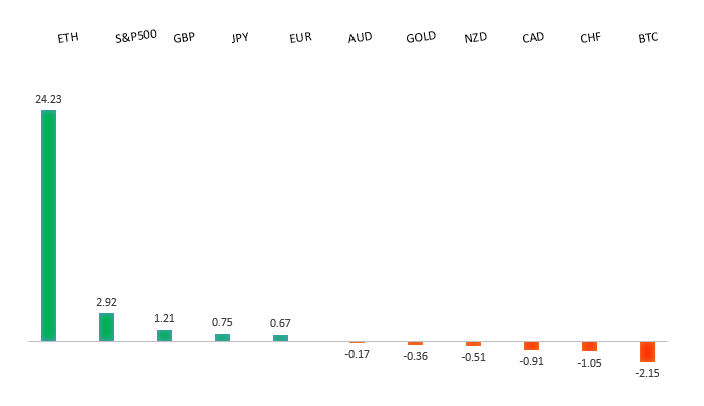
Performance chart 30day v. USD (%)
Performance Chart
 
 
Technical & fundamental highlights
EURUSD: technical overview

The Euro has broken out from a multi-month consolidation off a critical longer-term low. This latest push through the 2023 high (1.1276) lends further support to the case for a meaningful bottom, setting the stage for a bullish structural shift and the next major upside extension targeting the 2021 high at 1.2350. Setbacks should be exceptionally well supported ahead of 1.1000.

EURUSD Chart
R2 1.1789 - 24 July high - Medium
R1 1.1731 - 13 August high - Medium
S1 1.1528 - 5 August low - Medium
S2 1.1392 - 1 August low - Strong
EURUSD: fundamental overview

The Eurozone’s July inflation remained stable, with headline CPI at 2.0% and core CPI at 2.3%, aligning with the ECB’s target. Services inflation eased slightly to 3.2%, and contained wage growth suggests further moderation. Despite trade tensions with the US, including a 15% tariff on European goods, the ECB is likely to pause rate adjustments in September, awaiting clearer impacts from tariffs and trade deals. ECB President Christine Lagarde noted slower growth this quarter but highlighted reduced uncertainty from recent US trade agreements. Geopolitical tensions persist, with conflicting reports on Russia-Ukraine talks complicating peace prospects.

 
USDJPY: technical overview

There are signs of a meaningful top in place after the market put in a multi-year high in 2024. At this point, the door is now open for a deeper setback below the 2024 low at 139.58, exposing a retest of the 2023 low. Rallies should be well capped below 152.00.

USDJPY Chart
R2 150.92 - 1 August high - Strong
R1 148.52 - 12 August high - Medium
S1 146.21 - 14 August low - Medium
S2 145.85 - 24 July low - Strong
USDJPY: fundamental overview

Long-term Japanese government bond yields surged due to fiscal concerns, with 10-year yields reaching 1.62%, the highest since 2008, and 20- and 30-year yields hitting 2.64% and 3.20%, respectively. Overseas investors continued buying ultra-long JGBs for the seventh consecutive month, stabilizing the market and supporting the yen, with domestic demand expected to limit aggressive selling. Japan’s July CPI, due on August 21, is projected to stay high at 3.1%-3.3%, potentially fueling expectations of a Bank of Japan rate hike in October if inflation persists, though weak export data due to U.S. tariffs and global trade issues may complicate this decision. Meanwhile, markets are cautious about the yen-dollar exchange rate ahead of Fed Chair Powell’s upcoming Jackson Hole speech, which could influence the current trading range.

 
AUDUSD: technical overview

There are signs of the potential formation of a longer-term base with the market trading down into a meaningful longer-term support zone. Only a monthly close below 0.5500 would give reason for rethink. A monthly close back above 0.7000 will take the big picture pressure off the downside and strengthen case for a bottom.

AUDUSD Chart
R2 0.6600 - Figure - Medium
R1 0.6569 - 14 August high - Medium
S1 0.6419 - 1 August low - Medium
S1 0.6373 - 23 June low - Strong
AUDUSD: fundamental overview

A sharp Nasdaq selloff triggered risk-averse sentiment, weakening high-beta G10 currencies like the Australian dollar against the US dollar, with markets cautious ahead of Fed Chair Powell’s Jackson Hole speech, which could challenge expectations for a September rate cut. Australia’s economy is projected to grow steadily, with GDP forecasts holding at 0.5% for Q2 and Q3 2025, and annual growth expected at 1.6% in 2025, 2.2% in 2026, and 2.5% in 2027, while inflation remains stable at 2.5% in 2025 and 2.7% in 2026, according to Bloomberg’s August survey. The RBA’s cash rate is expected to stay at 3.60% through Q3 2025, though some economists predict stickier inflation and potential rate hikes by late 2026. Recent PMI data shows robust economic activity, with the composite index rising to 54.9 in August, driven by strong services sector growth and a notable manufacturing uptick, signaling resilience and benefits from recent RBA rate cuts.

 
Suggested reading

Why 2025 Is the Year to Invest in International Stocks, D. Lefkovitz, Morningstar (August 20, 2025)

The Downside Of Index Funds & ETFs, B. Arends, MarketWatch (August 20, 2025)


Any opinions, news, research, analyses, prices or other information ("information") contained on this Blog, constitutes marketing communication and it has not been prepared in accordance with legal requirements designed to promote the independence of investment research. Further, the information contained within this Blog does not contain (and should not be construed as containing) investment advice or an investment recommendation, or an offer of, or solicitation for, a transaction in any financial instrument. LMAX Group has not verified the accuracy or basis-in-fact of any claim or statement made by any third parties as comments for every Blog entry.

LMAX Group will not accept liability for any loss or damage, including without limitation to, any loss of profit, which may arise directly or indirectly from use of or reliance on such information. No representation or warranty is given as to the accuracy or completeness of the above information. While the produced information was obtained from sources deemed to be reliable, LMAX Group does not provide any guarantees about the reliability of such sources. Consequently any person acting on it does so entirely at his or her own risk. It is not a place to slander, use unacceptable language or to promote LMAX Group or any other FX and CFD provider and any such postings, excessive or unjust comments and attacks will not be allowed and will be removed from the site immediately.

Day Image
20th August 2025 | view in browser
Dollar gains as markets brace for Powell’s speech

Markets have pulled back from bets on aggressive Federal Reserve rate cuts as fears grow that Fed Chair Powell might resist dovish expectations at the Jackson Hole symposium.


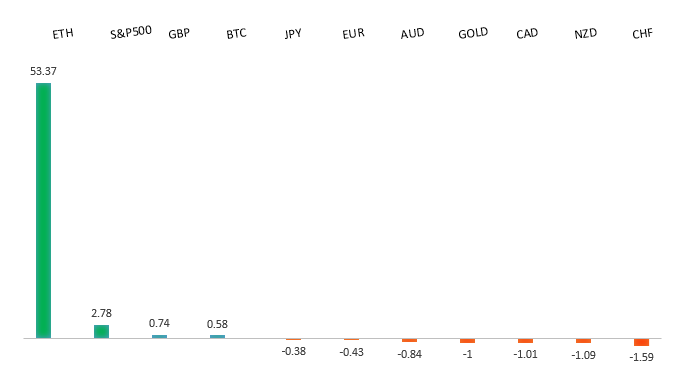
Performance chart 30day v. USD (%)
Performance Chart
 
 
Technical & fundamental highlights
EURUSD: technical overview

The Euro has broken out from a multi-month consolidation off a critical longer-term low. This latest push through the 2023 high (1.1276) lends further support to the case for a meaningful bottom, setting the stage for a bullish structural shift and the next major upside extension targeting the 2021 high at 1.2350. Setbacks should be exceptionally well supported ahead of 1.1000.

EURUSD Chart
R2 1.1789 - 24 July high - Medium
R1 1.1731 - 13 August high - Medium
S1 1.1528 - 5 August low - Medium
S2 1.1392 - 1 August low - Strong
EURUSD: fundamental overview

European leaders remain cautiously hopeful after a White House summit, but note Russia’s lack of clear commitment to peace in Ukraine. Analysts see a full peace deal as unlikely, as Trump’s push for a comprehensive settlement aligns more with Russia, creating tension with Ukraine and Europe, while security guarantees could face Russian resistance. A potential Trump-Putin-Zelensky meeting could pave the way for a peace framework if common ground is found. Meanwhile, markets are cautious ahead of Fed Chair Powell’s Jackson Hole speech, with focus on today’s U.S. PMI data and FOMC minutes for insights into growth, inflation, and potential rate cuts.

 
USDJPY: technical overview

There are signs of a meaningful top in place after the market put in a multi-year high in 2024. At this point, the door is now open for a deeper setback below the 2024 low at 139.58, exposing a retest of the 2023 low. Rallies should be well capped below 152.00.

USDJPY Chart
R2 150.92 - 1 August high - Strong
R1 148.52 - 12 August high - Medium
S1 146.21 - 14 August low - Medium
S2 145.85 - 24 July low - Strong
USDJPY: fundamental overview

Japan’s July CPI, due August 21, is expected to stay high at 3.1%-3.3%, with core measures above the Bank of Japan’s 2% target, driven by rising food and household costs. The BOJ’s upward revision of inflation forecasts and discussions of potential rate hikes bolster expectations for an October rate increase, as the upcoming Outlook Report could justify policy shifts. Recent data shows Japan’s exports fell sharply by 2.6% year-on-year in July, with a trade deficit of ¥117.5 billion, raising concerns about economic growth amid U.S. tariffs, despite strong domestic investment indicated by robust machine orders.

 
AUDUSD: technical overview

There are signs of the potential formation of a longer-term base with the market trading down into a meaningful longer-term support zone. Only a monthly close below 0.5500 would give reason for rethink. A monthly close back above 0.7000 will take the big picture pressure off the downside and strengthen case for a bottom.

AUDUSD Chart
R2 0.6600 - Figure - Medium
R1 0.6569 - 14 August high - Medium
S1 0.6419 - 1 August low - Medium
S1 0.6373 - 23 June low - Strong
AUDUSD: fundamental overview

High-beta G10 currencies, including the Australian dollar, weakened against the U.S. dollar after a Nasdaq selloff dampened risk appetite, though traders are likely to avoid bold moves before Fed Chair Powell’s Jackson Hole speech. Australia’s Westpac Consumer Confidence Index hit a three-and-a-half-year high of 98.5 in August, driven by the Reserve Bank’s third rate cut of 2025 and optimism about lower mortgage rates, with broad-based gains in family finances, economic outlook, and reduced unemployment fears. Despite this, AUDUSD remained subdued as markets await U.S. PMI data and FOMC minutes for clues on Federal Reserve rate cut plans, which could significantly influence the currency’s direction.

 
Suggested reading

Dollar Is Not Going To Save Your Savings: You Must Invest C. Reilly, RiskHedge (August 18, 2025)

Trump Admin Fed Demands Not Evidence Based, J. Calhoun, Alhambra (August 17, 2025)


Any opinions, news, research, analyses, prices or other information ("information") contained on this Blog, constitutes marketing communication and it has not been prepared in accordance with legal requirements designed to promote the independence of investment research. Further, the information contained within this Blog does not contain (and should not be construed as containing) investment advice or an investment recommendation, or an offer of, or solicitation for, a transaction in any financial instrument. LMAX Group has not verified the accuracy or basis-in-fact of any claim or statement made by any third parties as comments for every Blog entry.

LMAX Group will not accept liability for any loss or damage, including without limitation to, any loss of profit, which may arise directly or indirectly from use of or reliance on such information. No representation or warranty is given as to the accuracy or completeness of the above information. While the produced information was obtained from sources deemed to be reliable, LMAX Group does not provide any guarantees about the reliability of such sources. Consequently any person acting on it does so entirely at his or her own risk. It is not a place to slander, use unacceptable language or to promote LMAX Group or any other FX and CFD provider and any such postings, excessive or unjust comments and attacks will not be allowed and will be removed from the site immediately.

Day Image
18th August 2025 | view in browser
Geopolitics jolt markets

The U.S. dollar climbed to session highs late Monday after a key White House meeting involving President Trump, Ukrainian President Zelensky, and European leaders.


Performance chart 30day v. USD (%)
Performance Chart
 
 
Technical & fundamental highlights
EURUSD: technical overview

The Euro has broken out from a multi-month consolidation off a critical longer-term low. This latest push through the 2023 high (1.1276) lends further support to the case for a meaningful bottom, setting the stage for a bullish structural shift and the next major upside extension targeting the 2021 high at 1.2350. Setbacks should be exceptionally well supported ahead of 1.1000.

EURUSD Chart
R2 1.1789 - 24 July high - Medium
R1 1.1731 - 13 August high - Medium
S1 1.1528 - 5 August low - Medium
S2 1.1392 - 1 August low - Strong
EURUSD: fundamental overview

Former President Trump has shifted toward Russia’s position in the Ukraine conflict, urging President Zelensky to accept a peace deal that involves conceding Crimea and abandoning NATO aspirations, while placing the burden of failed talks on Ukraine. With the U.S. holding key leverage through military aid, Ukraine faces pressure to agree to terms favoring Russia, which could set a precedent that might makes right but may also lower energy prices, benefiting the euro in the short term. Meanwhile, disappointing Eurozone trade data signals potential economic challenges, though recovery is expected, and divergent monetary policies between the ECB and the Fed could support a stronger euro through 2026.

 
USDJPY: technical overview

There are signs of a meaningful top in place after the market put in a multi-year high in 2024. At this point, the door is now open for a deeper setback below the 2024 low at 139.58, exposing a retest of the 2023 low. Rallies should be well capped below 152.00.

USDJPY Chart
R2 150.92 - 1 August high - Strong
R1 148.52 - 12 August high - Medium
S1 146.21 - 14 August low - Medium
S2 145.85 - 24 July low - Strong
USDJPY: fundamental overview

Japan’s Q2 GDP growth bolsters its economic recovery and supports the Bank of Japan’s cautious move toward tighter monetary policy, with markets anticipating a potential rate hike in October if inflation remains high. Prime Minister Shigeru Ishiba, despite political setbacks, aims to leverage the positive economic data to strengthen his position. Rising US-Japan yield spreads and comments from US Treasury Secretary Bessent urging Japan to control inflation are supporting the yen, while upcoming July CPI data, expected to show inflation above 2%, could further fuel expectations for a BOJ rate hike.

 
AUDUSD: technical overview

There are signs of the potential formation of a longer-term base with the market trading down into a meaningful longer-term support zone. Only a monthly close below 0.5500 would give reason for rethink. A monthly close back above 0.7000 will take the big picture pressure off the downside and strengthen case for a bottom.

AUDUSD Chart
R2 0.6600 - Figure - Medium
R1 0.6569 - 14 August high - Medium
S1 0.6419 - 1 August low - Medium
S1 0.6373 - 23 June low - Strong
AUDUSD: fundamental overview

Analysts expect the Reserve Bank of Australia to cautiously continue its gradual rate-cutting cycle, with the big four banks forecasting the Official Cash Rate to drop to 3.35% by the end of 2025, likely starting in November 2024 and possibly followed by another cut in early 2026, depending on inflation (2%-3%) and unemployment (4.3%-4.5%). The RBA’s cautious approach contrasts with a more dovish outlook for the U.S. Federal Reserve, which markets expect to cut rates by 53 basis points by year-end, compared to 36 basis points for the RBA, potentially supporting the Australian Dollar. Federal Reserve Chair Powell’s upcoming Jackson Hole speech and U.S. PMI data on August 21 could significantly influence Aussie, alongside Australian consumer confidence data.

 
Suggested reading

How bots came for our workflows and drudgery, I. Berwick, Financial Times (August 18, 2025)

Powell’s Legacy and Fed Independence On the Line, N. Goodkind, Barron’s (August 15, 2025)


Any opinions, news, research, analyses, prices or other information ("information") contained on this Blog, constitutes marketing communication and it has not been prepared in accordance with legal requirements designed to promote the independence of investment research. Further, the information contained within this Blog does not contain (and should not be construed as containing) investment advice or an investment recommendation, or an offer of, or solicitation for, a transaction in any financial instrument. LMAX Group has not verified the accuracy or basis-in-fact of any claim or statement made by any third parties as comments for every Blog entry.

LMAX Group will not accept liability for any loss or damage, including without limitation to, any loss of profit, which may arise directly or indirectly from use of or reliance on such information. No representation or warranty is given as to the accuracy or completeness of the above information. While the produced information was obtained from sources deemed to be reliable, LMAX Group does not provide any guarantees about the reliability of such sources. Consequently any person acting on it does so entirely at his or her own risk. It is not a place to slander, use unacceptable language or to promote LMAX Group or any other FX and CFD provider and any such postings, excessive or unjust comments and attacks will not be allowed and will be removed from the site immediately.

Day Image
18th August 2025 | view in browser
Tariffs and labor woes cloud outlook

Last week’s U.S. retail sales for July rose by 0.5% month-over-month, signaling robust consumer activity and easing some concerns, though analysts warn that a softening labor market and potential tariff impacts could weaken spending later in 2025.


Performance chart 30day v. USD (%)
Performance Chart
 
 
Technical & fundamental highlights
EURUSD: technical overview

The Euro has broken out from a multi-month consolidation off a critical longer-term low. This latest push through the 2023 high (1.1276) lends further support to the case for a meaningful bottom, setting the stage for a bullish structural shift and the next major upside extension targeting the 2021 high at 1.2350. Setbacks should be exceptionally well supported ahead of 1.1000.

EURUSD Chart
R2 1.1789 - 24 July high - Medium
R1 1.1731 - 13 August high - Medium
S1 1.1528 - 5 August low - Medium
S2 1.1392 - 1 August low - Strong
EURUSD: fundamental overview

Markets expect the Federal Reserve to cut rates at least three times by Q1 2026, while the ECB is likely to hold rates steady in September, awaiting updated projections. Some analysts suggest the ECB might hike rates later, driven by Germany’s fiscal stimulus, contrasting with the Fed’s easing path, which could boost the euro against the dollar. Key upcoming data, including Eurozone PMI and US PMI figures, along with the Jackson Hole symposium, will influence EURUSD movements. Two major US banks are bullish on the euro, targeting $1.20 by year-end and $1.22 by mid-2026, citing US inflation risks and growth moderation. Geopolitical developments, particularly from the Trump-Putin summit and follow-up talks with European leaders, could impact the dollar’s strength, with potential peace deals favoring the euro unless significant Ukrainian territorial losses raise long-term concerns.

 
USDJPY: technical overview

There are signs of a meaningful top in place after the market put in a multi-year high in 2024. At this point, the door is now open for a deeper setback below the 2024 low at 139.58, exposing a retest of the 2023 low. Rallies should be well capped below 152.00.

USDJPY Chart
R2 150.92 - 1 August high - Strong
R1 148.52 - 12 August high - Medium
S1 146.21 - 14 August low - Medium
S2 145.85 - 24 July low - Strong
USDJPY: fundamental overview

Japan’s strong Q2 GDP growth supports the Bank of Japan’s cautious move toward gradual rate hikes, likely in October, if inflation remains high, with July’s CPI expected to stay elevated at 3.1%-3.3%. Prime Minister Ishiba, despite political setbacks, aims to leverage the positive economic outlook to stabilize his leadership. The narrowing yield spread between US and Japanese bonds, along with US Treasury Secretary Bessent’s comments urging Japan to manage inflation, supports the yen, though concerns linger about potential market volatility from rapid BOJ policy shifts. Additionally, Japan’s approval of a yen-backed stablecoin is expected to boost demand for government bonds and strengthen the yen’s role in the digital economy.

 
AUDUSD: technical overview

There are signs of the potential formation of a longer-term base with the market trading down into a meaningful longer-term support zone. Only a monthly close below 0.5500 would give reason for rethink. A monthly close back above 0.7000 will take the big picture pressure off the downside and strengthen case for a bottom.

AUDUSD Chart
R2 0.6600 - Figure - Medium
R1 0.6569 - 14 August high - Medium
S1 0.6419 - 1 August low - Medium
S1 0.6373 - 23 June low - Strong
AUDUSD: fundamental overview

Recent strong Australian labor data suggests the Reserve Bank of Australia will continue a cautious, gradual rate-cutting cycle, with the big four banks predicting the Official Cash Rate will drop to 3.35% by the end of 2025, likely starting in November. The RBA’s moves depend on inflation staying within 2%-3% and unemployment between 4.3%-4.5%, while markets expect a more aggressive U.S. Federal Reserve cutting 55 basis points compared to 37 for the RBA, potentially supporting AUDUSD strength. China’s slowing economy, with weaker-than-expected industrial output, retail sales, and rising joblessness, may accelerate its consumer subsidy program, potentially boosting the Australian dollar through economic spillovers. Key upcoming Australian data, including consumer confidence, PMIs, and inflation expectations, alongside Fed Chair Powell’s Jackson Hole speech and U.S. PMI data, could significantly influence AUDUSD trends and RBA policy expectations.

 
Suggested reading

Jerome Powell’s Last Stand, N. Goodkind, Barron’s (August 15, 2025)

The Dark Side Of The Artificial Intelligence Revolution, J. Horwitz, Reuters (August 14, 2025)


Any opinions, news, research, analyses, prices or other information ("information") contained on this Blog, constitutes marketing communication and it has not been prepared in accordance with legal requirements designed to promote the independence of investment research. Further, the information contained within this Blog does not contain (and should not be construed as containing) investment advice or an investment recommendation, or an offer of, or solicitation for, a transaction in any financial instrument. LMAX Group has not verified the accuracy or basis-in-fact of any claim or statement made by any third parties as comments for every Blog entry.

LMAX Group will not accept liability for any loss or damage, including without limitation to, any loss of profit, which may arise directly or indirectly from use of or reliance on such information. No representation or warranty is given as to the accuracy or completeness of the above information. While the produced information was obtained from sources deemed to be reliable, LMAX Group does not provide any guarantees about the reliability of such sources. Consequently any person acting on it does so entirely at his or her own risk. It is not a place to slander, use unacceptable language or to promote LMAX Group or any other FX and CFD provider and any such postings, excessive or unjust comments and attacks will not be allowed and will be removed from the site immediately.

Day Image
15th August 2025 | view in browser
PPI shock boosts US Dollar

The U.S. dollar gained strength on Thursday following a surprisingly high July Producer Price Index, which rose 0.9% month-over-month, far exceeding the expected 0.2%.


Performance chart 30day v. USD (%)
Performance Chart
 
 
Technical & fundamental highlights
EURUSD: technical overview

The Euro has broken out from a multi-month consolidation off a critical longer-term low. This latest push through the 2023 high (1.1276) lends further support to the case for a meaningful bottom, setting the stage for a bullish structural shift and the next major upside extension targeting the 2021 high at 1.2350. Setbacks should be exceptionally well supported ahead of 1.1000.

EURUSD Chart
R2 1.1789 - 24 July high - Medium
R1 1.1731 - 13 August high - Medium
S1 1.1528 - 5 August low - Medium
S2 1.1392 - 1 August low - Strong
EURUSD: fundamental overview
The euro’s strength against the dollar has eased slightly after US PPI data raised doubts about aggressive Federal Reserve rate cuts, though markets still expect at least three Fed cuts by Q1 2026. The ECB is likely to hold rates steady in September, with some anticipating a future hike as Germany’s fiscal stimulus grows, supporting a bullish euro outlook due to diverging Fed and ECB policies. Hedge funds are increasing euro exposure via short-term call options, while two major US banks predict euro gains to $1.20-$1.22 by mid-2026, citing US stagflation risks and growth moderation. Eurozone data showed weaker-than-expected industrial production, and markets are monitoring the Trump-Putin summit for potential impacts on Russian oil sanctions, which could influence volatility.
 
USDJPY: technical overview

There are signs of a meaningful top in place after the market put in a multi-year high in 2024. At this point, the door is now open for a deeper setback below the 2024 low at 139.58, exposing a retest of the 2023 low. Rallies should be well capped below 152.00.

USDJPY Chart
R2 150.92 - 1 August high - Strong
R1 148.52 - 12 August high - Medium
S1 146.21 - 14 August low - Medium
S2 145.85 - 24 July low - Strong
USDJPY: fundamental overview
U.S. Treasury Secretary Bessent, in a Bloomberg interview, urged Japan to control inflation and hinted at tighter monetary policy to avoid disruptive global yield spikes and market volatility, possibly signaling a U.S. preference for a weaker dollar. Japan’s Q2 2025 GDP grew at a stronger-than-expected 1% annualized rate, driven by robust business investment (1.3%) and modest private consumption growth (0.2%), avoiding a recession. Despite U.S. tariffs impacting trade, domestic demand bolstered Japan’s economy, offering political relief to Prime Minister Ishiba’s government amid calls for his resignation after a recent electoral loss.
 
AUDUSD: technical overview

There are signs of the potential formation of a longer-term base with the market trading down into a meaningful longer-term support zone. Only a monthly close below 0.5500 would give reason for rethink. A monthly close back above 0.7000 will take the big picture pressure off the downside and strengthen case for a bottom.

AUDUSD Chart
R2 0.6600 - Figure - Medium
R1 0.6569 - 14 August high - Medium
S1 0.6419 - 1 August low - Medium
S1 0.6373 - 23 June low - Strong
AUDUSD: fundamental overview
Australia’s labor market remains robust, with employment rising by 24,500 in July and the unemployment rate dropping to 4.2%, surpassing the Reserve Bank of Australia’s expectations. A significant shift from part-time to full-time jobs, with 60,500 new full-time positions, signals stronger job security and consumer spending potential, supporting economic growth. Despite stable wage growth at 3.4%, the RBA is cautious, with no immediate rate cuts planned, while China’s contracting bank lending may boost the Australian dollar through anticipated stimulus measures.
 
Suggested reading

Do Consumers Really Benefit From Cheap Imports, M. Pettis, FT Alphaville (August 13, 2025)

Tariffs Don’t Fuel Scorching Inflation, Fisher Investments (August 12, 2025)


Any opinions, news, research, analyses, prices or other information ("information") contained on this Blog, constitutes marketing communication and it has not been prepared in accordance with legal requirements designed to promote the independence of investment research. Further, the information contained within this Blog does not contain (and should not be construed as containing) investment advice or an investment recommendation, or an offer of, or solicitation for, a transaction in any financial instrument. LMAX Group has not verified the accuracy or basis-in-fact of any claim or statement made by any third parties as comments for every Blog entry.

LMAX Group will not accept liability for any loss or damage, including without limitation to, any loss of profit, which may arise directly or indirectly from use of or reliance on such information. No representation or warranty is given as to the accuracy or completeness of the above information. While the produced information was obtained from sources deemed to be reliable, LMAX Group does not provide any guarantees about the reliability of such sources. Consequently any person acting on it does so entirely at his or her own risk. It is not a place to slander, use unacceptable language or to promote LMAX Group or any other FX and CFD provider and any such postings, excessive or unjust comments and attacks will not be allowed and will be removed from the site immediately.

Day Image
13th August 2025 | view in browser
Markets brace for Trump-Putin summit

On Wednesday, the U.S. dollar ended lower, still influenced by Tuesday’s mild CPI data. Markets are now looking ahead to Friday’s Trump-Putin summit in Alaska.


Performance chart 30day v. USD (%)
Performance Chart
 
 
Technical & fundamental highlights
EURUSD: technical overview

The Euro has broken out from a multi-month consolidation off a critical longer-term low. This latest push through the 2023 high (1.1276) lends further support to the case for a meaningful bottom, setting the stage for a bullish structural shift and the next major upside extension targeting the 2021 high at 1.2350. Setbacks should be exceptionally well supported ahead of 1.1000.

EURUSD Chart
R2 1.1789 - 24 July high - Medium
R1 1.1731 - 13 August high - Medium
S1 1.1528 - 5 August low - Medium
S2 1.1392 - 1 August low - Strong
EURUSD: fundamental overview

The U.S. July CPI data, aligning with expectations, supports predictions of a Federal Reserve rate cut in September, with markets anticipating three cuts by January 2026. Treasury Secretary Bessent urged a significant rate reduction, suggesting the Fed would have acted sooner with earlier access to revised jobs data. Meanwhile, the ECB is likely to hold rates steady in September, with some speculation of a future hike as Germany’s fiscal stimulus grows, highlighting divergent Fed and ECB policies that favor the euro. Hedge funds are increasing bets on the Euro via call options, focusing on upcoming U.S. economic events. ECB officials, including Bundesbank President Nagel, see current rates as appropriate and are cautious about further cuts unless the economy worsens, while also monitoring the impact of new EU-U.S. trade tariffs. The Trump-Putin summit’s outcome could sway the euro, with a peace deal potentially boosting it, but significant concessions or a breakdown in talks could weaken the currency and eurozone markets.

 
USDJPY: technical overview

There are signs of a meaningful top in place after the market put in a multi-year high in 2024. At this point, the door is now open for a deeper setback below the 2024 low at 139.58, exposing a retest of the 2023 low. Rallies should be well capped below 152.00.

USDJPY Chart
R2 150.92 - 1 August high - Strong
R1 148.52 - 12 August high - Medium
S1 146.62 - 5 August low - Medium
S2 145.85 - 24 July low - Strong
USDJPY: fundamental overview

Expectations of a U.S. Federal Reserve rate cut in September, fueled by the July CPI data and comments from U.S. Treasury Secretary Bessent urging Japan to tighten monetary policy, have narrowed the yield gap between U.S. and Japanese 2-year bonds, causing USDJPY to fall from its August 12 high. Japan’s upcoming Q2 GDP data, expected to show a rebound to 0.4% growth driven by strong wage growth, tourism spending, and private investment, could further strengthen the yen and support the Bank of Japan’s confidence in raising rates. Despite political uncertainty and low demand for Japanese government bonds signaling investor caution, the BOJ’s hawkish stance on inflation risks suggests a potential rate hike by year-end, though political instability and calls for continued fiscal stimulus may delay policy changes.

 
AUDUSD: technical overview

There are signs of the potential formation of a longer-term base with the market trading down into a meaningful longer-term support zone. Only a monthly close below 0.5500 would give reason for rethink. A monthly close back above 0.7000 will take the big picture pressure off the downside and strengthen case for a bottom.

AUDUSD Chart
R2 0.6600 - Figure - Medium
R1 0.6563 - 13 August high - Medium
S1 0.6419 - 1 August low - Medium
S1 0.6373 - 23 June low - Strong
AUDUSD: fundamental overview

The Reserve Bank of Australia recently cut its cash rate by 25 basis points to 3.60%, expressing optimism about inflation and economic stability, though some analysts are skeptical due to weak productivity and strong wage growth, which could sustain inflation and limit further cuts. While markets expect 1-2 more RBA rate cuts by early 2026, persistent inflation or rising asset prices might force a pause, and the Australian dollar could maintain strength against the US dollar, as markets anticipate more aggressive US Federal Reserve cuts (65bps) compared to the RBA (40bps). Meanwhile, China’s unexpected contraction in lending may accelerate its consumer subsidy program, potentially boosting the AUD through economic spillovers, and upcoming Australian labor data could reinforce expectations of only one more rate cut in 2025, supporting the AUD’s upward trend.

 
Suggested reading

Trump, tariffs and the battle for blue-collar America, J. Sinclair, Financial Times (August 13, 2025)

We Are Bullish, But Not Because the Fed Might Cut, Fisher Investments (August 11, 2025)


Any opinions, news, research, analyses, prices or other information ("information") contained on this Blog, constitutes marketing communication and it has not been prepared in accordance with legal requirements designed to promote the independence of investment research. Further, the information contained within this Blog does not contain (and should not be construed as containing) investment advice or an investment recommendation, or an offer of, or solicitation for, a transaction in any financial instrument. LMAX Group has not verified the accuracy or basis-in-fact of any claim or statement made by any third parties as comments for every Blog entry.

LMAX Group will not accept liability for any loss or damage, including without limitation to, any loss of profit, which may arise directly or indirectly from use of or reliance on such information. No representation or warranty is given as to the accuracy or completeness of the above information. While the produced information was obtained from sources deemed to be reliable, LMAX Group does not provide any guarantees about the reliability of such sources. Consequently any person acting on it does so entirely at his or her own risk. It is not a place to slander, use unacceptable language or to promote LMAX Group or any other FX and CFD provider and any such postings, excessive or unjust comments and attacks will not be allowed and will be removed from the site immediately.

Day Image
13th August 2025 | view in browser
Dollar dives as CPI fuels rate cut bets

Heading into Wednesday’s trading session, the U.S. dollar remains under pressure after a sharp decline on Tuesday, driven by a softer-than-expected headline CPI report that solidified expectations for a September Federal Reserve rate cut, with market odds now exceeding 95%.


Performance chart 30day v. USD (%)
Performance Chart
 
 
Technical & fundamental highlights
EURUSD: technical overview

The Euro has broken out from a multi-month consolidation off a critical longer-term low. This latest push through the 2023 high (1.1276) lends further support to the case for a meaningful bottom, setting the stage for a bullish structural shift and the next major upside extension targeting the 2021 high at 1.2350. Setbacks should be exceptionally well supported ahead of 1.1000.

EURUSD Chart
R2 1.1789 - 24 July high - Medium
R1 1.1700 - 7 August high - Medium
S1 1.1528 - 5 August low - Medium
S2 1.1392 - 1 August low - Strong
EURUSD: fundamental overview

The U.S. July CPI data, aligning with expectations, supports market predictions for a Federal Reserve rate cut in September, with three cuts priced in by Q1 2026, while the ECB is likely to hold rates steady in September as it nears the end of its cutting cycle, potentially strengthening the euro due to diverging central bank policies. ECB official Joachim Nagel indicated that current eurozone borrowing costs are appropriate, with inflation at 2% and not a primary concern, though caution persists due to unresolved EU-U.S. trade tariffs and their potential economic impact. Germany’s economic confidence dropped sharply, with the August ZEW Economic Sentiment Index falling to 34.7 from 52.7, driven by weak Q2 growth and concerns over U.S. tariffs impacting export industries, with the Bundesbank forecasting no growth for 2025.

 
USDJPY: technical overview

There are signs of a meaningful top in place after the market put in a multi-year high in 2024. At this point, the door is now open for a deeper setback below the 2024 low at 139.58, exposing a retest of the 2023 low. Rallies should be well capped below 152.00.

USDJPY Chart
R2 150.92 - 1 August high - Strong
R1 148.52 - 12 August high - Medium
S1 146.62 - 5 August low - Medium
S2 145.85 - 24 July low - Strong
USDJPY: fundamental overview

Expectations of a U.S. Federal Reserve rate cut in September, following the July CPI data, have paused a run of yen declines, though the yen remains weak. Political uncertainty in Japan, driven by Prime Minister Ishiba’s coalition setbacks in recent elections, has fueled yen depreciation and raised concerns about increased government spending and fiscal challenges. Despite internal LDP pressure for Ishiba’s resignation, he remains in place, with a party review set for late August, likely sustaining market volatility and yen weakness. Meanwhile, the Bank of Japan’s July meeting summary indicates a hawkish tilt, with growing inflation concerns potentially leading to a rate hike by year-end if U.S. tariffs have minimal impact and domestic inflation persists. Recent Japanese data showed July PPI slightly above forecasts at 2.6% year-on-year and 0.2% month-on-month.

 
AUDUSD: technical overview

There are signs of the potential formation of a longer-term base with the market trading down into a meaningful longer-term support zone. Only a monthly close below 0.5500 would give reason for rethink. A monthly close back above 0.7000 will take the big picture pressure off the downside and strengthen case for a bottom.

AUDUSD Chart
R2 0.6600 - Figure - Medium
R1 0.6542 - 7 August high - Medium
S1 0.6419 - 1 August low - Medium
S1 0.6373 - 23 June low - Strong
AUDUSD: fundamental overview

The Reserve Bank of Australia lowered its cash rate by 25 basis points to 3.60%, marking the third rate cut this year and bringing rates to a two-year low. The RBA adopted a more dovish stance, citing weaker economic growth forecasts, with GDP growth for 2025 reduced to 1.7% from 2.1%. Inflation is expected to peak at 3.1% in mid-2026 before settling at 2.5% by late 2027, within the target range, while unemployment holds steady at 4.3%. Economists anticipate further rate cuts, potentially reaching 3.35% by year-end and 3.10% in early 2026, as growth slows and inflation remains manageable.

 
Suggested reading

Does CPI Represent True Inflation? R. Forsyth, Barron’s (August 8, 2025)

Five Possible Ways to Stop the National Debt Disaster, G. Will, Washington Post (August 8, 2025)


Any opinions, news, research, analyses, prices or other information ("information") contained on this Blog, constitutes marketing communication and it has not been prepared in accordance with legal requirements designed to promote the independence of investment research. Further, the information contained within this Blog does not contain (and should not be construed as containing) investment advice or an investment recommendation, or an offer of, or solicitation for, a transaction in any financial instrument. LMAX Group has not verified the accuracy or basis-in-fact of any claim or statement made by any third parties as comments for every Blog entry.

LMAX Group will not accept liability for any loss or damage, including without limitation to, any loss of profit, which may arise directly or indirectly from use of or reliance on such information. No representation or warranty is given as to the accuracy or completeness of the above information. While the produced information was obtained from sources deemed to be reliable, LMAX Group does not provide any guarantees about the reliability of such sources. Consequently any person acting on it does so entirely at his or her own risk. It is not a place to slander, use unacceptable language or to promote LMAX Group or any other FX and CFD provider and any such postings, excessive or unjust comments and attacks will not be allowed and will be removed from the site immediately.

Day Image
11th August 2025 | view in browser
Speculation swirls over Fed appointments

Recent reports indicate that President Trump’s team has expanded the candidate list for the Federal Reserve Chair, adding James Bullard, former St. Louis Fed President, and Marc Sumerlin, a former Bush economic adviser, in what major media described as a late-stage “shake-up” to broaden options and address concerns about Fed independence.


Performance chart 30day v. USD (%)
Performance Chart
 
 
Technical & fundamental highlights
EURUSD: technical overview

The Euro has broken out from a multi-month consolidation off a critical longer-term low. This latest push through the 2023 high (1.1276) lends further support to the case for a meaningful bottom, setting the stage for a bullish structural shift and the next major upside extension targeting the 2021 high at 1.2350. Setbacks should be exceptionally well supported ahead of 1.1000.

EURUSD Chart
R2 1.1789 - 24 July high - Medium
R1 1.1700 - 7 August high - Medium
S1 1.1528 - 5 August low - Medium
S2 1.1392 - 1 August low - Strong
EURUSD: fundamental overview

The Euro paused its upward trend against the USD after weak German data raised concerns about the Eurozone’s largest economy, though it remains above the 50-day moving average. Expectations lean toward the ECB holding rates steady in September, while the Fed is increasingly likely to cut rates, potentially supporting Euro bulls due to diverging central bank policies. Meanwhile, President Trump’s proposed US-Russia summit to discuss a peace deal could push European nations, especially those near Russia, to increase defense spending, possibly via joint bonds, which may raise Eurozone bond yields. The ECB’s recent bulletin suggests stable inflation but slower growth, with risks from tariffs and geopolitics, and upcoming data on employment, industrial production, and GDP will provide further economic insights.

 
USDJPY: technical overview

There are signs of a meaningful top in place after the market put in a multi-year high in 2024. At this point, the door is now open for a deeper setback below the 2024 low at 139.58, exposing a retest of the 2023 low. Rallies should be well capped below 152.00.

USDJPY Chart
R2 150.92 - 1 August high - Strong
R1 149.00 - Figure - Medium
S1 146.62 - 5 August low - Medium
S2 145.85 - 24 July low - Strong
USDJPY: fundamental overview

The Bank of Japan’s July meeting summary revealed a hawkish tilt among board members, with growing concerns about inflation risks over growth, potentially setting the stage for a rate hike before year-end if U.S. tariffs have minimal impact and domestic inflation remains steady. Uncertainty persists around U.S. tariff policies, as Japan awaits a timeline for ending tariff stacking and reducing auto tariffs, which could ease conditions for BOJ rate hikes but keeps Japanese markets cautious. Political instability in Japan, with calls for Prime Minister Ishiba’s resignation after the LDP’s election losses, may heighten market volatility and weaken the yen. Key upcoming data, including the U.S. CPI report and Japan’s Q2 GDP, could influence USDJPY movements by shaping expectations for the Federal Reserve and BOJ policy directions.

 
AUDUSD: technical overview

There are signs of the potential formation of a longer-term base with the market trading down into a meaningful longer-term support zone. Only a monthly close below 0.5500 would give reason for rethink. A monthly close back above 0.7000 will take the big picture pressure off the downside and strengthen case for a bottom.

AUDUSD Chart
R2 0.6600 - Figure - Medium
R1 0.6542 - 7 August high - Medium
S1 0.6419 - 1 August low - Medium
S1 0.6373 - 23 June low - Strong
AUDUSD: fundamental overview

One major Australian bank predicts the Reserve Bank of Australia will cut the cash rate from 3.85% to 3.60% at its next meeting, supported by recent inflation and labor data showing the economy is on track. The bank expects minimal changes to RBA’s forecasts, though economic growth might be slightly higher due to stronger housing investment. Markets anticipate at least two rate cuts this year, with a terminal rate just above 3%, and global uncertainties, like tariffs, are less likely to affect RBA’s outlook. Upcoming Chinese economic data could influence Australia’s economy.

 
Suggested reading

More Meetings Means Less Thinking, J. Wiggins,  Behavioral Investment (August 6, 2025)

What Corporations Do To Work Around Tariffs, E. Dellinger, Fisher Investments (August 6, 2025)


Any opinions, news, research, analyses, prices or other information ("information") contained on this Blog, constitutes marketing communication and it has not been prepared in accordance with legal requirements designed to promote the independence of investment research. Further, the information contained within this Blog does not contain (and should not be construed as containing) investment advice or an investment recommendation, or an offer of, or solicitation for, a transaction in any financial instrument. LMAX Group has not verified the accuracy or basis-in-fact of any claim or statement made by any third parties as comments for every Blog entry.

LMAX Group will not accept liability for any loss or damage, including without limitation to, any loss of profit, which may arise directly or indirectly from use of or reliance on such information. No representation or warranty is given as to the accuracy or completeness of the above information. While the produced information was obtained from sources deemed to be reliable, LMAX Group does not provide any guarantees about the reliability of such sources. Consequently any person acting on it does so entirely at his or her own risk. It is not a place to slander, use unacceptable language or to promote LMAX Group or any other FX and CFD provider and any such postings, excessive or unjust comments and attacks will not be allowed and will be removed from the site immediately.

Day Image
8th August 2025 | view in browser
Pound shines, Dollar dips on Fed news

Thursday’s financial markets saw notable activity, driven primarily by news surrounding the Federal Reserve and currency movements. News broke of the White House’s top pick to replace Chair Powell, boosting market confidence due to Waller’s strong track record and tariff-related economic insights.


Performance chart 30day v. USD (%)
Performance Chart
 
 
Technical & fundamental highlights
EURUSD: technical overview

The Euro has broken out from a multi-month consolidation off a critical longer-term low. This latest push through the 2023 high (1.1276) lends further support to the case for a meaningful bottom, setting the stage for a bullish structural shift and the next major upside extension targeting the 2021 high at 1.2350. Setbacks should be exceptionally well supported ahead of 1.1000.

EURUSD Chart
R2 1.1789 - 24 July high - Medium
R1 1.1703 - 25 July low - Medium
S1 1.1528 - 5 August low - Medium
S2 1.1392 - 1 August low - Strong
EURUSD: fundamental overview

The Euro paused its recent gains against the US dollar after disappointing German economic data raised concerns about the Eurozone’s largest economy. Weak industrial production and a shrinking trade surplus suggest Germany’s manufacturing sector faces structural challenges, potentially keeping the economy near recession through Q3 2025. While the ECB is expected to hold rates steady in September, markets anticipate a Federal Reserve rate cut, which could support the Euro due to diverging central bank policies. Analysts warn that Germany’s economic struggles may lead to downward GDP revisions and increased calls for fiscal support, with markets closely watching upcoming data for signs of recovery.

 
USDJPY: technical overview

There are signs of a meaningful top in place after the market put in a multi-year high in 2024. At this point, the door is now open for a deeper setback below the 2024 low at 139.58, exposing a retest of the 2023 low. Rallies should be well capped below 152.00.

USDJPY Chart
R2 150.92 - 1 August high - Strong
R1 149.00 - Figure - Medium
S1 146.62 - 5 August low - Medium
S2 145.85 - 24 July low - Strong
USDJPY: fundamental overview

The recent auction of 30-year Japanese Government Bonds showed average demand, easing concerns about long-term debt and giving the Bank of Japan room to continue reducing bond purchases, which may support the yen. However, new U.S. tariffs, stacked on top of existing ones, have raised trade uncertainties, particularly impacting Japan’s beef exports, now facing a 41.4% tariff rate, and potentially affecting automobiles. Japan’s Chief Negotiator Ryosei Akazawa is seeking clarification from the U.S. to resolve the tariff issue, which the BOJ cites as a barrier to policy normalization, with a potential rate hike expected in October. Prime Minister Ishiba faces criticism for the trade deal’s implementation, and while he resists resignation, internal Liberal Democratic Party tensions and a pending election review could lead to leadership changes by late August.

 
AUDUSD: technical overview

There are signs of the potential formation of a longer-term base with the market trading down into a meaningful longer-term support zone. Only a monthly close below 0.5500 would give reason for rethink. A monthly close back above 0.7000 will take the big picture pressure off the downside and strengthen case for a bottom.

AUDUSD Chart
R2 0.6600 - Figure - Medium
R1 0.6542 - 7 August high - Medium
S1 0.6419 - 1 August low - Medium
S1 0.6373 - 23 June low - Strong
AUDUSD: fundamental overview

The Chinese yuan strengthened to its highest level since November 2024, boosting the Australian Dollar. China’s July trade data showed robust export growth of 12.4%, despite weaker U.S. shipments, as exporters diversified to non-U.S. markets. In Australia, a strong trade surplus of A$5.365 billion in June, driven by a 6% export surge, supports economic growth despite softer domestic demand. The Reserve Bank of Australia is expected to cut rates in August, with inflation at 2.1% and unemployment rising to 4.3%, signaling room for easing, though the RBA will likely remain cautious, with further cuts depending on weaker economic data.

 
Suggested reading

Stock Buybacks Are Surging And That Is…Bearish?, M. Hulbert,  MarketWatch (August 7, 2025)

Investors Have Big Data That Markets Pre-Price, Fisher Investments (August 4, 2025)


Any opinions, news, research, analyses, prices or other information ("information") contained on this Blog, constitutes marketing communication and it has not been prepared in accordance with legal requirements designed to promote the independence of investment research. Further, the information contained within this Blog does not contain (and should not be construed as containing) investment advice or an investment recommendation, or an offer of, or solicitation for, a transaction in any financial instrument. LMAX Group has not verified the accuracy or basis-in-fact of any claim or statement made by any third parties as comments for every Blog entry.

LMAX Group will not accept liability for any loss or damage, including without limitation to, any loss of profit, which may arise directly or indirectly from use of or reliance on such information. No representation or warranty is given as to the accuracy or completeness of the above information. While the produced information was obtained from sources deemed to be reliable, LMAX Group does not provide any guarantees about the reliability of such sources. Consequently any person acting on it does so entirely at his or her own risk. It is not a place to slander, use unacceptable language or to promote LMAX Group or any other FX and CFD provider and any such postings, excessive or unjust comments and attacks will not be allowed and will be removed from the site immediately.