


Today’s report: Takeaways into the end of the week
As we head into Friday, there are two important takeaways from developments this week. The first is that higher for longer Fed policy is something investors need to consider more seriously. The second is that while the Fed has been talking about a solid economy and higher for longer, we haven’t exactly been getting the same messages out from the other major central banks.
Wake-up call
- business confidence
- surprise hold
- Profit taking
- sentiment slides
- outperforms peers
- strong GDP
- Policy outlook
- Dealers report
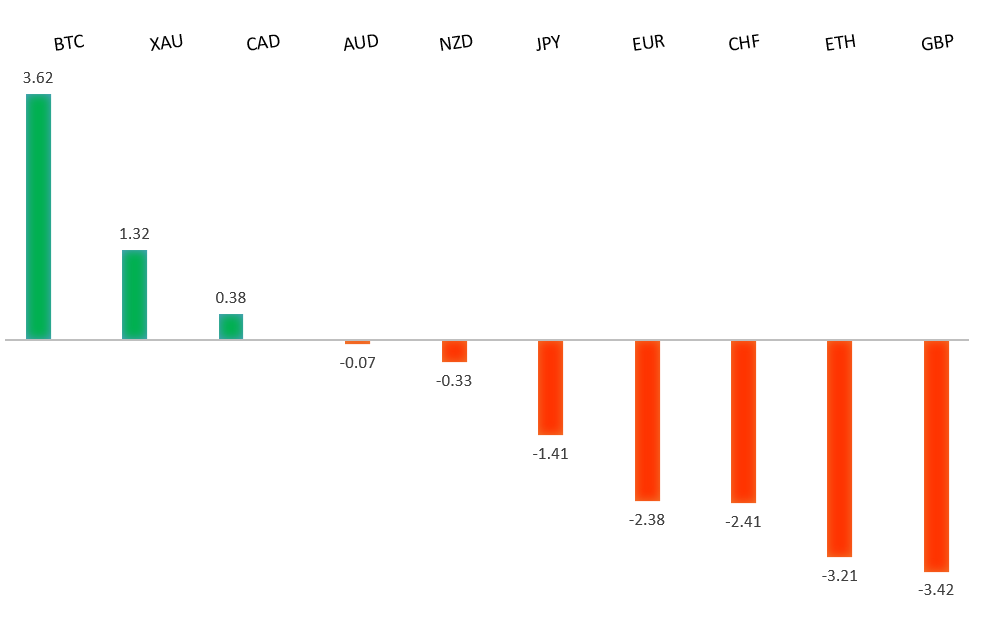
Peformance chart: 30 Day Performance vs. US dollar (%)
Suggested reading
- Markets Connect the Dots and Give Powell a Break, J. Authers, Bloomberg (September 21, 2023)
- Biodiversity Funds Are Springing Up in the Investor Market, A. Ross, FT (September 21, 2023)
Chart talk: Technical & fundamental highlights
Choose pair:
EURUSD – technical overview
The Euro remains well supported on dips following a run to the topside through 1.1000. Any additional setbacks should be well supported ahead of 1.0500 in favor of a bullish continuation. Ultimately, only a monthly close back below 1.0500 would give reason for concern. Next key resistance comes in the form of the 2023 high at 1.1276.EURUSD – fundamental overview
The Euro managed to defend itself against another wave of US Dollar demand, recovering out from the Thursday low and settling back by daily opening levels. We suspect profit taking on US Dollar longs, some hawkish ECB speak, and an uptick in French business confidence were all there to help the Euro along. Key standouts on Friday’s calendar come from Japan inflation data, the BOJ policy decision, UK retail sales, German, Eurozone, and UK PMI reads, Canada retail sales, and US PMI reads.EURUSD - Technical charts in detail
GBPUSD – technical overview
Signs have emerged of the market wanting to put in a longer-term base after collapsing to a record low in September 2022. The November 2022 monthly close back above 1.2000 strengthens this prospect. Any setbacks should now be well supported ahead of 1.2000. Next key resistance comes in at 1.3143.GBPUSD – fundamental overview
Many were caught by surprise with Thursday's BOE hold decision. There had been some hints from softer economic data and below forecast inflation reads. And on Thursday, the BOE added to worry after also downgrading growth forecasts. Still, the fact that the central bank acknowledged the need for restrictive policy to remain in place, helped to generate some GBP demand into the dip. Key standouts on Friday’s calendar come from Japan inflation data, the BOJ policy decision, UK retail sales, German, Eurozone, and UK PMI reads, Canada retail sales, and US PMI reads.USDJPY – technical overview
At this stage, it looks like the market is wanting to resume the bigger picture uptrend and head back towards a retest of that multi-year high from October 2022 up at 151.95. Look for any weakness to continue to be well supported on dips.USDJPY – fundamental overview
We've seen some profit taking on Yen shorts heading into today's BOJ policy decision. The move makes sense when considering the intense downside pressure in the Yen and recent comments warning of possible intervention. Key standouts on Friday’s calendar come from Japan inflation data, the BOJ policy decision, UK retail sales, German, Eurozone, and UK PMI reads, Canada retail sales, and US PMI reads.AUDUSD – technical overview
There are signs of the potential formation of a longer-term base with the market trading down into a meaningful longer-term support zone. Only a monthly close below 0.6400 would give reason for rethink. Back above 0.6523 will take the immediate pressure off the downside and strengthen case for a bottom.AUDUSD – fundamental overview
The Australian Dollar remains under pressure into the end of the week on the back of a more hawkish leaning Fed communication, and lower US and China equities. Key standouts on Friday’s calendar come from Japan inflation data, the BOJ policy decision, UK retail sales, German, Eurozone, and UK PMI reads, Canada retail sales, and US PMI reads.USDCAD – technical overview
Above 1.3000 signals an end to a period of longer-term bearish consolidation and suggests the market is in the process of carving out a more significant longer-term base. Next key resistance now comes in up into the 1.4000 area. Setbacks should be very well supported down into the 1.3000 area.USDCAD – fundamental overview
The Canadian Dollar has managed to outperform against its peers on higher odds for a Bank of Canada rate hike. However, this hasn't helped the Canadian Dollar against the Buck in the aftermath of a hawkish leaning Fed decision which has triggered broad US Dollar demand and downside pressure on risk assets. Key standouts on Friday’s calendar come from Japan inflation data, the BOJ policy decision, UK retail sales, German, Eurozone, and UK PMI reads, Canada retail sales, and US PMI reads.NZDUSD – technical overview
Overall pressure remains on the downside with the market once again stalling out on a run up into the 0.6500 area. Ultimately, a break back above 0.6015 would be required to take the immediate pressure off the downside. A monthly close below 0.6000 would intensify bearish price action.NZDUSD – fundamental overview
Though the New Zealand Dollar remains weighed down on broad based US Dollar demand and risk off flow, the currency has held up better than its Aussie cousin into the end of the week, getting help from a much better than expected Thursday Kiwi GDP report. Key standouts on Friday’s calendar come from Japan inflation data, the BOJ policy decision, UK retail sales, German, Eurozone, and UK PMI reads, Canada retail sales, and US PMI reads.US SPX 500 – technical overview
Longer-term technical studies are in the process of unwinding from extended readings off record highs. Look for rallies to be well capped in favor of lower tops and lower lows. A monthly close back above 4600 will be required to take the immediate pressure off the downside. Next key support comes in at 4257.US SPX 500 – fundamental overview
We've finally reached a point in the cycle where the Fed recognizes unanchored inflation expectations pose a greater downside risk than over-tightening. This is significant, as it means less investor friendly monetary policy, especially with the growth outlook looking up in recent months. Overall, we expect inflation to continue to be a problem in 2023 that results in downside pressure into rallies despite market expectations that would argue otherwise.GOLD (SPOT) – technical overview
The 2019 breakout above the 2016 high at 1375 was a significant development, opening the door for fresh record highs. Setbacks should now be well supported above 1600 on a monthly close basis ahead of the next major upside extension. Next major resistance comes in at 2100, above which opens the next extension towards 2500.GOLD (SPOT) – fundamental overview
The yellow metal continues to be well supported on dips with solid demand from medium and longer-term accounts. These players are more concerned about inflation risk and a less upbeat global growth outlook. All of this should keep the commodity well supported, with many market participants also fleeing to the hard asset as the grand dichotomy of record high equities and record low yields comes to an unnerving climax.