


Next 24 hours: More volatility expected in US session
Today’s report: Global markets in distress
Global sentiment has turned decidedly negative and risk off flow has intensified in financial markets. The Dollar and other currencies like the Franc and Yen that benefit in risk off environments have been rallying, while the rest of the currency market struggles.
Wake-up call
- discouraging data
- PMIs impress
- expansion territory
- macro headwinds
- cuts rates
- Risk-off flow
- Fed outlook
- Macro themes
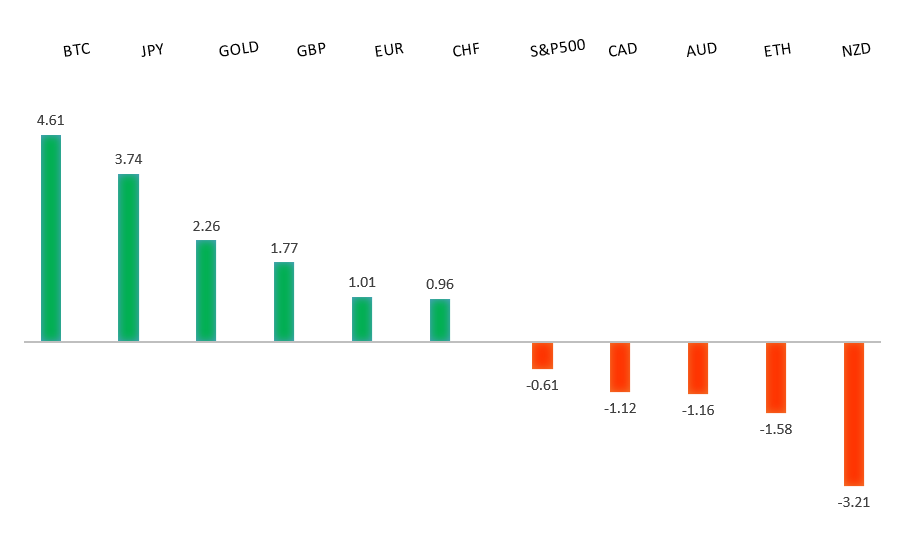
Peformance chart: 30-Day Performance vs. US dollar (%)
Suggested reading
- The Economy Is Cooling, and That’s Good News, S. Hansen, Morningstar (July 19, 2024)
- The Economic Pessimism Of Gen-Z, M. Peterson, AIER (July 23, 2024)
Chart talk: Technical & fundamental highlights
Choose pair:
EURUSD – technical overview
The Euro has been in a multi-month consolidation since bottoming out in 2022. Setbacks have since been exceptionally well supported on dips below 1.0500, with a higher platform sought out ahead of the next major upside extension. Look for a push through the 2023 high at 1.1276 to strengthen the constructive outlook and extend the recovery run towards 1.2000. Only back below 1.0400 negates.EURUSD – fundamental overview
The Euro has been a victim of an intense downturn in sentiment coupled with downbeat PMI data. Eurozone, German, and French PMIs were all disappointing on Wednesday. Key standouts on Thursday’s calendar come from German Ifo reads, UK CBI, US durable goods, GDP, and initial jobless claims.EURUSD - Technical charts in detail
GBPUSD – technical overview
Signs have emerged of the market wanting to put in a longer-term base after collapsing to a record low in September 2022. The door is now open for the next major upside extension towards the 2023 high at 1.3143. Any setbacks should be well supported ahead of 1.2500.GBPUSD – fundamental overview
UK PMIs were solid and stood in sharp contrast to struggling Eurozone reads, which ended up translating to GBP outperformance. Key standouts on Thursday’s calendar come from German Ifo reads, UK CBI, US durable goods, GDP, and initial jobless claims.USDJPY – technical overview
The market remains confined to a strong uptrend, most recently extending to a multi-year high through 160.00. Key support comes in at 151.86, with only a weekly close below to delay the constructive outlook. Next major resistance comes in at 165.00.USDJPY – fundamental overview
Japan services PMIs rose into expansion territory, carry trade unwind continued as US stocks dumped, and odds for a BOJ hike next week rose to 75% from what had been even money earlier this week. All of this translated to another round of Yen outperformance. Key standouts on Thursday’s calendar come from German Ifo reads, UK CBI, US durable goods, GDP, and initial jobless claims.AUDUSD – technical overview
There are signs of the potential formation of a longer-term base with the market trading down into a meaningful longer-term support zone. Only a monthly close below 0.6200 would give reason for rethink. Back above 0.6900 will take the big picture pressure off the downside and strengthen case for a bottom.AUDUSD – fundamental overview
The Australian Dollar has extended declines for the eight day on the back of softer Aussie PMIs, distressed metals, China markets in decline, and US equities faltering. Key standouts on Thursday’s calendar come from German Ifo reads, UK CBI, US durable goods, GDP, and initial jobless claims.USDCAD – technical overview
Above 1.3000 signals an end to a period of longer-term bearish consolidation and suggests the market is in the process of carving out a more significant longer-term base. Next key resistance now comes in up into the 1.4000 area. Setbacks should be very well supported down into the 1.3000 area.USDCAD – fundamental overview
There was no surprise in seeing the Canadian Dollar extend declines towards yearly lows amidst all the negative sentiment in global markets and after the Bank of Canada cut rates by 25 basis points. The Bank of Canada noted downside risks to the economy while saying it was reasonable to expect more cuts. There is currently a 66% chance for a rate cut in September. Key standouts on Thursday’s calendar come from German Ifo reads, UK CBI, US durable goods, GDP, and initial jobless claims.NZDUSD – technical overview
Overall pressure remains on the downside with the market continuing to stall out on runs up into the 0.6500 area. At the same time, there are some signs of the market wanting to put in a longer-term base. Ultimately, a break back above 0.6500 would be required to take the medium-term pressure off the downside and encourage this prospect. A monthly close below 0.5800 will intensify bearish price action.NZDUSD – fundamental overview
This week's distressing trade data along with an ongoing slide in commodities prices and downturn in US equities have proven to be a big weight on the New Zealand Dollar. Key standouts on Thursday’s calendar come from German Ifo reads, UK CBI, US durable goods, GDP, and initial jobless claims.US SPX 500 – technical overview
Longer-term technical studies continue to look quite extended, begging for a deeper correction ahead. The latest rally has extended to reach and even exceed a 355 point measured move extension target objective in the 5,640 area, adding to the case for an imminent correction. At this stage, additional upside should be limited to allow for overbought studies to unwind. There is now room for a pullback towards previous resistance turned support in the form of the previous record high from April around 5,290.US SPX 500 – fundamental overview
Though we have seen a healthy adjustment of investor expectations towards the amount of rate cuts in 2024, the market still hopes policy will end up erring more towards the investor friendly, accommodative side of things. This bet has kept stocks well bid into dips and consistently pushing record highs. Still, if there is a sense the Fed will need to be more sensitive towards erring on the side of higher rates, it could invite a much bigger disruption to stocks.GOLD (SPOT) – technical overview
The 2019 breakout above the 2016 high at 1375 was a significant development, opening the door for fresh record highs and this next major upside extension into the 2500-3000 area. Setbacks should now be well supported above 2200 on a monthly close basis.GOLD (SPOT) – fundamental overview
The yellow metal has pushed record highs in 2024 with solid demand from medium and longer-term accounts. These players are more concerned about inflation, geopolitical risk and a less upbeat global growth outlook. All of this should keep the commodity well supported, with many market participants also fleeing to the hard asset as the grand dichotomy of record high equities and record low yields comes to an end. [audio mp3="https://www.lmax.com/blog/wp-content/uploads/sites/4/2024/07/24jullmaxaudio.mp3"][/audio]