


Next 24 hours: Worry that never lasts for more than a moment
Today’s report: Not the Fed communication the market wanted
There continues to be quite a bit of worry around the pandemic recovery outlook, with many fearing things will take a lot longer to get back to normal or whatever the new normal might be. Meanwhile, the Fed was perhaps a little more downbeat in its communication that the market was looking for.
Wake-up call
- strong Euro
- travel restrictions
- Dealers report
- SNB policy
- risk off
- propped oil
- New variant
- Stocks vulnerable
- Dealers report
- Bigger money
- defi bubble
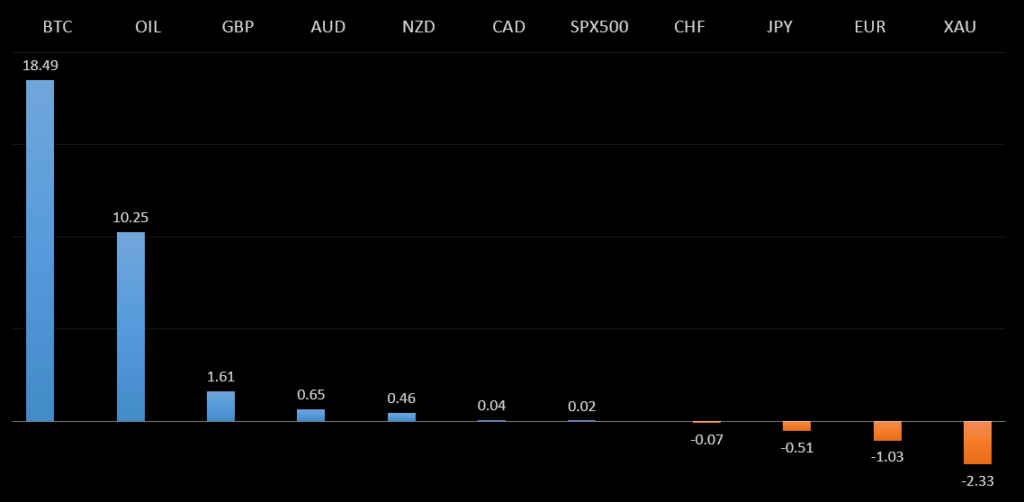
Peformance chart: 30 Day Performance vs. US dollar (%)
Suggested reading
- GameStop Has Us in a Glass Case of Emotion, M. Gongloff, Bloomberg (January 27, 2021)
- Building a More Sustainable Food System with AI, A. De Jong, FT (January 27, 2021)
Chart talk: Technical & fundamental highlights
Choose pair:
EURUSD – technical overview
The recent breakout above 1.2000 ends a period of multi-week consolidation, with the major pair pushing to its highest level since April 2018. The break also opens the door for an eventual retest of the 2018 high up in the 1.2550 area. At this stage, setbacks should be very well supported above the previous range low around 1.1600.EURUSD – fundamental overview
More Euro weakness of late as the ECB has been showing signs of losing patience with unwanted strength in the single currency. ECB Knot was out saying the central bank had the means to prevent further strengthening, including lowering rates. At the same time, German confidence reads were discouraging, while France's Le Maire said the EU recovery fund was dispersing economic aid too slowly. Key standouts on today’s calendar include Eurozone confidence and sentiment reads, German inflation, and a batch of US reads in the form of initial jobless claims, GDP, trade and new home sales.EURUSD - Technical charts in detail
GBPUSD – technical overview
The recent breakout through the 2019 high at 1.3515 is significant and now sets the stage for the next major upside extension back towards 1.4000. Technical studies are however unwinding from extended readings, leaving room for some setbacks before the market starts to make its way higher. But look for setbacks to now be very well supported ahead of 1.3000.GBPUSD – fundamental overview
Some profit taking has kicked in on GBP longs and we're also seeing risk off flow and broad based US Dollar demand. Meanwhile, the UK announced it will quarantine travelers arriving from 30 elevated-risk countries for 10 days. Key standouts on today’s calendar include a batch of US reads in the form of initial jobless claims, GDP, trade and new home sales.USDJPY – technical overview
The latest breakdown below 104.00 opens the door for a deeper round of setbacks. Initial support comes in just ahead of 101.00, in the form of the 2020 low, which guards against the major psychological barrier at 100.00 and the 2016 low around 99.00. At this point, it would take a clear break back above 106.00 to take the immediate pressure off the downside.USDJPY – fundamental overview
There's been plenty of selling in the Yen into Thursday, though the price action should be taken with a grain of salt, given the fact that we're also seeing risk liquidation flow in global markets. Dealers are reporting heavy offers into this run higher, with the Yen expected to make another recovery if the risk backdrop continues to deteriorate. Japan retail sales data was out and didn't do anything to factor into price action. Key standouts on today’s calendar include a batch of US reads in the form of initial jobless claims, GDP, trade and new home sales.EURCHF – technical overview
Lots of sideways price action here, with no clear directional insight. For the most part, price action has been confined between 1.0600 and 1.0900, and it will take a clear break above or below for an indication of the next big move.EURCHF – fundamental overview
The SNB remains uncomfortable with Franc appreciation and continues to remind the market it will need to be careful about any attempts at trying to force an appreciation in the currency. But the SNB will also need to be careful right now, as its strategy to weaken the Franc is facing headwinds from a less certain global outlook. Any signs of renewed risk liquidation will likely invite a very large wave of demand for the Franc that will put the SNB in the more challenging position of needing to back up its talk with action, that ultimately, may not prove to be as effective as it once was, given where we're at in the monetary policy cycle.AUDUSD – technical overview
Technical studies have turned up in recent months, after the market traded down to its lowest levels since 2003 in 2020. There is evidence of a longer-term bottom following the latest push back through 0.7000, though at this stage, there is risk for a deeper pullback to allow for shorter term studies to unwind. Next big resistance comes in at 0.8000. Setbacks should now be well supported ahead of 0.7000.AUDUSD – fundamental overview
Australia has been doing a good job controlling the virus outbreak, but this hasn't been enough to prevent the Australian Dollar from coming under pressure on Thursday as risk sentiment turns down. Aussie export prices came in above forecast, while imports matched expectation. Key standouts on today’s calendar include a batch of US reads in the form of initial jobless claims, GDP, trade and new home sales.USDCAD – technical overview
Has been in major decline since topping out in 2021 above 1.4600. At this stage, with the decline now well extended, the market is likely to find solid support into the 1.2500 area ahead of a resumption of gains. Ultimately, only a weekly close below 1.2500 would suggest otherwise. Back above 1.3000 will strengthen the outlook.USDCAD – fundamental overview
The Canadian Dollar has come under pressure into Thursday, with the price action attributed to risk off flow and renewed broad based US Dollar demand. The fact that oil priced have held up hasn't been much of a prop to the Loonie this week. Key standouts on today’s calendar include Canada average weekly earnings, Canada building permits, and a batch of US reads in the form of initial jobless claims, GDP, trade and new home sales.NZDUSD – technical overview
There's a case to be made for a meaningful bottom, after the market bottomed out in 2020. The recent break back above 0.7000 further strengthens this outlook, with the market back in uptrend mode as per the weekly Ichimoku cloud and focused on pushing back towards longer-term resistance in the 0.7500 area. Any setbacks are expected to be well supported ahead of 0.6500.NZDUSD – fundamental overview
New Zealand confirmed two people had tested positive for the South African variant of the coronavirus after they finished their quarantine at Auckland's Pullman hotel and returned two negative tests. On the data front, exports were softer while imports were a little above forecast. Key standouts on today’s calendar include a batch of US reads in the form of initial jobless claims, GDP, trade and new home sales.US SPX 500 – technical overview
Longer-term technical studies are looking quite exhausted and the market is showing signs of wanting to roll over after racing to another record high. Look for rallies to be well capped ahead of 3900, with a break back below 3600 to strengthen the outlook.US SPX 500 – fundamental overview
We're trading just off fresh record highs, and yet, with so little room for additional central bank accommodation, given an already depressed interest rate environment, the prospect for sustainable runs to the topside on easy money policy incentives and government stimulus, should no longer be as enticing to investors. Meanwhile, ongoing worry associated with coronavirus fallout should weigh more heavily on investor sentiment in 2021.GOLD (SPOT) – technical overview
The 2019 breakout above the 2016 high at 1375 was a significant development, opening the door for fresh record highs and an acceleration beyond the next major psychological barrier at 2000. Setbacks should now be well supported above 1700. Longer-term technical studies are however in the process of consolidating, with the market in search of a higher low ahead of a bullish continuation.GOLD (SPOT) – fundamental overview
The yellow metal continues to be well supported on dips with solid demand from medium and longer-term accounts. These players are more concerned about exhausted monetary policy, extended global equities, and coronavirus fallout. All of this should keep the commodity well supported, with many market participants also fleeing to the hard asset as the grand dichotomy of record high equities and record low yields comes to an unnerving climax.BTCUSD – technical overview
The short-term outlook should be less constructive in the aftermath of the January wave of parabolic price action through $40,000. Key indicators are unwinding from extreme overbought territory across multiple timeframes, warning of a period of deeper correction and consolidation before any meaningful bullish continuation can be expected. At the same time, look for setbacks to now be well supported into the $20,000 area.BTCUSD – fundamental overview
Overall, ongoing adoption, continued innovation in the space, a warmer regulatory environment and healthy institutional investor appetite have all contributed to this latest wave of strong demand leading to fresh record highs into 2021. Market participants are also drawn to the asset as it proves to be an attractive store of value at a time when governments and central banks continue to print money at unprecedented rates. Still, the market had run a little too far and fast into January and we're now seeing a round of profit taking kicking in.BTCUSD - Technical charts in detail
ETHUSD – technical overview
The market has finally rallied up to a fresh record high, exceeding the previous peak from January 2018. At the same time, with daily studies showing overextension, there could be a period of consolidation and deeper correction that sets in before a meaningful bullish continuation. Setbacks should now be well supported ahead of 800.ETHUSD – fundamental overview
Bitcoin is getting all of the attention, though it's Ether that outperformed its older cousin in 2020. All of the healthy investor risk appetite in global markets has helped to fuel demand for innovation and the Ethereum blockchain is very much at the centre of this when it comes to cryptocurrencies. At the same time, we would be concerned about a bubble in the defi space, with valuations for these projects soaring to alarming heights. We've also warned that any downturn in global sentiment is likely to have a more significant negative impact on the more risk correlated Ether.