


Today’s report: All eyes on US jobs report
A mix of US data in recent sessions has left the market in a state of wait and see ahead of today’s highly anticipated US jobs report. Looking back, the Fed Beige Book was downbeat, ADP data reflected weakening labor conditions, though on the other side, ISM data was stronger along with jobless claims.
Wake-up call
- factory orders
- inflation expectations
- real wages
- hawkish comments
- rate cut
- jobs report
- accommodative policy
- Macro themes
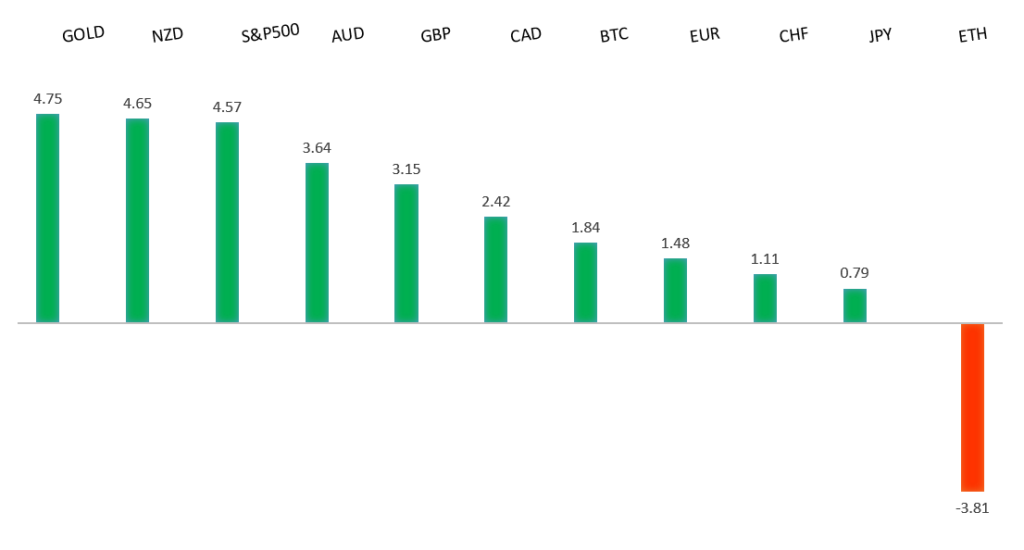
Peformance chart: 30-Day Performance vs. US dollar (%)
Suggested reading
- Why This Jobs Report Is The Most Pivotal In Years, J. Smialek, NY Times (September 5, 2024)
- Is AI Really A Job Killer? Not At This California Company, Fast Company (September 3, 2024)
Chart talk: Technical & fundamental highlights
Choose pair:
EURUSD – technical overview
The Euro has been in a multi-month consolidation since bottoming out in 2022. Setbacks have since been exceptionally well supported on dips below 1.0500, with a higher platform sought out ahead of the next major upside extension. Look for a push through the 2023 high at 1.1276 to strengthen the constructive outlook and extend the recovery run towards 1.2000. Only back below 1.0400 negates.EURUSD – fundamental overview
An unexpected rise in German factory orders was thought to be behind the latest run higher in the Euro. German factory came in at +2.9% versus -1.7% expected. Key standouts on Friday’s calendar come from German trade and industrial production, Eurozone GDP and employment, Canada employment, Canada Ivey PMIs, and the monthly jobs report out of the US.EURUSD - Technical charts in detail
GBPUSD – technical overview
Signs have emerged of the market wanting to put in a longer-term base after collapsing to a record low in September 2022. The door is now open for the next major upside extension towards the 2018 high at 1.4377. Any setbacks should be well supported ahead of 1.2500.GBPUSD – fundamental overview
The Pound traded higher on Thursday after UK inflation expectations moved up. Yield differentials with the US are also factoring into persistent Pound demand with only 2 rate cuts seen in the UK versus 4 expected in the US in 2024. Key standouts on Friday’s calendar come from German trade and industrial production, Eurozone GDP and employment, Canada employment, Canada Ivey PMIs, and the monthly jobs report out of the US.USDJPY – technical overview
The market has entered a period of correction after extending the uptrend to a multi-year high through 160.00. Critical support comes in around 140.00, with only a monthly close below the barrier to compromise the bullish outlook. A higher low is ideally sought out above 140.00 in favor of a bullish continuation.USDJPY – fundamental overview
BOJ Takata's hawkish comments earlier this week have been followed up by a rise in Japan's real wages, which has only inspired additional demand for the Yen. Key standouts on Friday’s calendar come from German trade and industrial production, Eurozone GDP and employment, Canada employment, Canada Ivey PMIs, and the monthly jobs report out of the US.AUDUSD – technical overview
There are signs of the potential formation of a longer-term base with the market trading down into a meaningful longer-term support zone. Only a monthly close below 0.6200 would give reason for rethink. Back above 0.6900 will take the big picture pressure off the downside and strengthen case for a bottom.AUDUSD – fundamental overview
The Australian Dollar has been holding up relatively well despite some risk off flow, mostly on the back of this week's hawkish comments from the RBA Governor. The central banker said the level of demand for goods and services is higher than the supply which simply means that inflation is still entrenched. The takeaway here is that there is no expectation rates will be lowered in the near term. Key standouts on Friday’s calendar come from German trade and industrial production, Eurozone GDP and employment, Canada employment, Canada Ivey PMIs, and the monthly jobs report out of the US.USDCAD – technical overview
A sustained hold above 1.3000 over the past several months signals an end to a period of longer-term bearish consolidation and suggests the market is in the process of carving out a more significant longer-term base. Next key resistance now comes in up into the 1.4000 area, with a break to open a retest of the 2020 high just ahead of 1.4700. Setbacks should be very well supported down into the 1.3000 area.USDCAD – fundamental overview
Canada labor productivity was unimpressive and kept the pressure on the Canadian Dollar into any rallies. The Canadian Dollar has also been contending with ongoing weakness in the price of oil. Key standouts on Friday’s calendar come from German trade and industrial production, Eurozone GDP and employment, Canada employment, Canada Ivey PMIs, and the monthly jobs report out of the US.NZDUSD – technical overview
Overall pressure remains on the downside with the market continuing to stall out on runs up into the 0.6500 area. At the same time, there are some signs of the market wanting to put in a longer-term base. Ultimately, a break back above 0.6500 would be required to take the medium-term pressure off the downside and encourage this prospect. A monthly close below 0.5800 will intensify bearish price action.NZDUSD – fundamental overview
The New Zealand Dollar has been riding higher on the coattails of its Aussie cousin, while also benefiting from broad based US Dollar selling. Looking ahead, a lot will hinge on price action in US equities and reaction to the US jobs report. Key standouts on Friday’s calendar come from German trade and industrial production, Eurozone GDP and employment, Canada employment, Canada Ivey PMIs, and the monthly jobs report out of the US.US SPX 500 – technical overview
The longer term uptrend remains intact and dips continue to be exceptionally well supported. Critical support comes in at 5093, with only a break back below this level to compromise the structure and open the door for a more significant corrective decline. Until then, the focus remains on a retest and break back above the record high.US SPX 500 – fundamental overview
The US equities market remains exceptionally well supported in 2024 on the back of an ongoing expectation for more rate cuts than less going forward. Investors are feeling better about a soft landing in the US economy and this has also been accompanied by an accommodative adjustment of Fed policy. It will however be important to keep an eye on inflation, bigger picture economic data and geopolitical risk in the months ahead.GOLD (SPOT) – technical overview
The 2019 breakout above the 2016 high at 1375 was a significant development, opening the door for fresh record highs and this next major upside extension into the 2500-3000 area. Setbacks should now be well supported above 2200 on a monthly close basis.GOLD (SPOT) – fundamental overview
The yellow metal has pushed record highs in 2024 with solid demand from medium and longer-term accounts. These players are more concerned about inflation, geopolitical risk and a less upbeat global growth outlook. All of this should keep the commodity well supported over the coming months.