


Next 24 hours: Stocks moving higher with US Dollar
Today’s report: An ugly combination of data
We come into the new week dealing with an ugly Friday session of trade in which risk assets took a beating. Worry around the outlook for the global economy was already running high before investors turned their attention to the US jobs report.
Wake-up call
- IP data
- sentiment deterioration
- Japan GDP
- Pro-cyclical commodities
- ugly data
- USD demand
- accommodative policy
- Macro themes
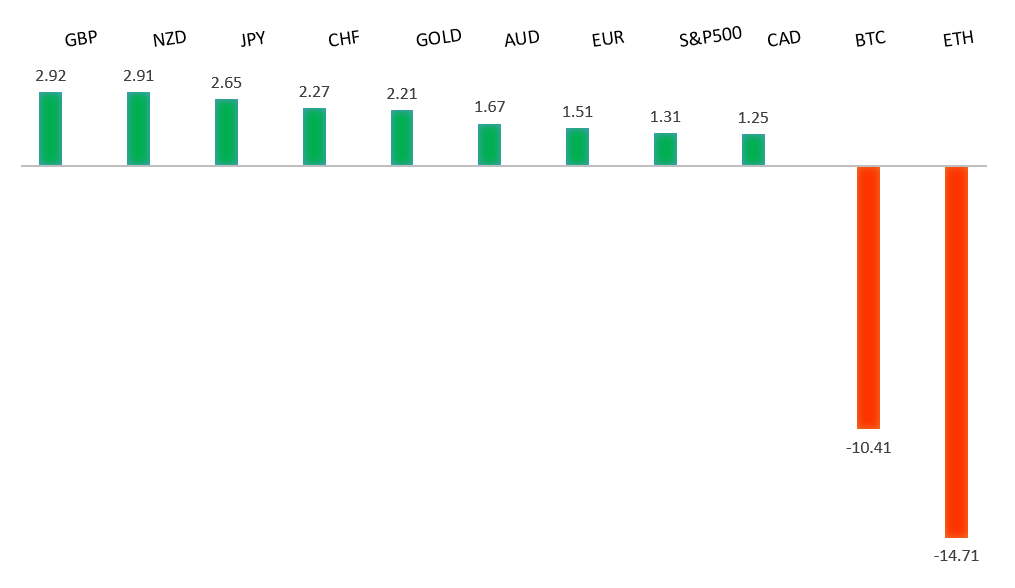
Peformance chart: 30-Day Performance vs. US dollar (%)
Suggested reading
- How to grow the next generation of CEOs, I. Berwick, Financial Times (September 9, 2024)
- The Dangerous Lies People Tell Themselves About Money, M. Cannivet, Forbes (September 5, 2024)
Chart talk: Technical & fundamental highlights
Choose pair:
EURUSD – technical overview
The Euro has been in a multi-month consolidation since bottoming out in 2022. Setbacks have since been exceptionally well supported on dips below 1.0500, with a higher platform sought out ahead of the next major upside extension. Look for a push through the 2023 high at 1.1276 to strengthen the constructive outlook and extend the recovery run towards 1.2000. Only back below 1.0400 negates.EURUSD – fundamental overview
The Euro reversed course on Friday, with a lot of the weakness coming from awful misses from German and French industrial production prints. There was also weakness from the more concerning US data, which inspired a flight to safety into the Buck. Looking ahead, the only notable standout on the calendar for the remainder of the day comes from US consumer inflation expectations.EURUSD - Technical charts in detail
GBPUSD – technical overview
Signs have emerged of the market wanting to put in a longer-term base after collapsing to a record low in September 2022. The door is now open for the next major upside extension towards the 2018 high at 1.4377. Any setbacks should be well supported ahead of 1.2500.GBPUSD – fundamental overview
Most of the latest run of weakness in the Pound was brought on by a downturn in global sentiment and flight to safety into the Buck after the US jobs report produced concerning numbers. Looking ahead, the only notable standout on the calendar for the remainder of the day comes from US consumer inflation expectations.USDJPY – technical overview
The market has entered a period of correction after extending the uptrend to a multi-year high through 160.00. Critical support comes in around 140.00, with only a monthly close below the barrier to compromise the bullish outlook. A higher low is ideally sought out above 140.00 in favor of a bullish continuation.USDJPY – fundamental overview
An early Monday round of softer than expected Japan GDP data has inspired a healthy amount of Yen selling from medium and longer-term players looking to build into Yen shorts at what they believe to be more attractive rates. Looking ahead, the only notable standout on the calendar for the remainder of the day comes from US consumer inflation expectations.AUDUSD – technical overview
There are signs of the potential formation of a longer-term base with the market trading down into a meaningful longer-term support zone. Only a monthly close below 0.6200 would give reason for rethink. Back above 0.6900 will take the big picture pressure off the downside and strengthen case for a bottom.AUDUSD – fundamental overview
The Australian Dollar comes into the new week under pressure on concerns around global recession risk. Pro-cyclical commodities have taken a beating and are weighing heavily on the correlated commodity currency. Looking ahead, the only notable standout on the calendar for the remainder of the day comes from US consumer inflation expectations.USDCAD – technical overview
A sustained hold above 1.3000 over the past several months signals an end to a period of longer-term bearish consolidation and suggests the market is in the process of carving out a more significant longer-term base. Next key resistance now comes in up into the 1.4000 area, with a break to open a retest of the 2020 high just ahead of 1.4700. Setbacks should be very well supported down into the 1.3000 area.USDCAD – fundamental overview
The latest run of Canadian Dollar weakness should come as no surprise after Canada unemployment ticked up, Ivey PMIs were ugly, and oil continued lower. Meanwhile, there was already a broad bid for the US Dollar on flight to safety flow. Looking ahead, the only notable standout on the calendar for the remainder of the day comes from US consumer inflation expectations.NZDUSD – technical overview
Overall pressure remains on the downside with the market continuing to stall out on runs up into the 0.6500 area. At the same time, there are some signs of the market wanting to put in a longer-term base. Ultimately, a break back above 0.6500 would be required to take the medium-term pressure off the downside and encourage this prospect. A monthly close below 0.5800 will intensify bearish price action.NZDUSD – fundamental overview
The New Zealand Dollar closed out the previous week under pressure on the back of a wave of broad based risk off flow. Weaker US data and concerns around the outlook for the global economy were front and center. Looking ahead, the only notable standout on the calendar for the remainder of the day comes from US consumer inflation expectations.US SPX 500 – technical overview
The longer term uptrend remains intact and dips continue to be exceptionally well supported. Critical support comes in at 5093, with only a break back below this level to compromise the structure and open the door for a more significant corrective decline. Until then, the focus remains on a retest and break back above the record high.US SPX 500 – fundamental overview
The US equities market remains exceptionally well supported in 2024 on the back of an ongoing expectation for more rate cuts than less going forward. Investors are feeling better about a soft landing in the US economy and this has also been accompanied by an accommodative adjustment of Fed policy. It will however be important to keep an eye on inflation, bigger picture economic data and geopolitical risk in the months ahead.GOLD (SPOT) – technical overview
The 2019 breakout above the 2016 high at 1375 was a significant development, opening the door for fresh record highs and this next major upside extension into the 2500-3000 area. Setbacks should now be well supported above 2300 on a monthly close basis.GOLD (SPOT) – fundamental overview
The yellow metal has pushed record highs in 2024 with solid demand from medium and longer-term accounts. These players are more concerned about inflation, geopolitical risk and a less upbeat global growth outlook. All of this should keep the commodity well supported over the coming months.