Day Image
5th January 2026 | view in browser
Geopolitics collide with softening inflation signals

Global markets open the day facing a dense mix of geopolitical and macro crosscurrents, led by a US-led intervention in Venezuela that could eventually add oil supply, soften energy prices, and ease inflation pressures in Europe and the UK, while near-term geopolitical uncertainty keeps risk sentiment fragile.


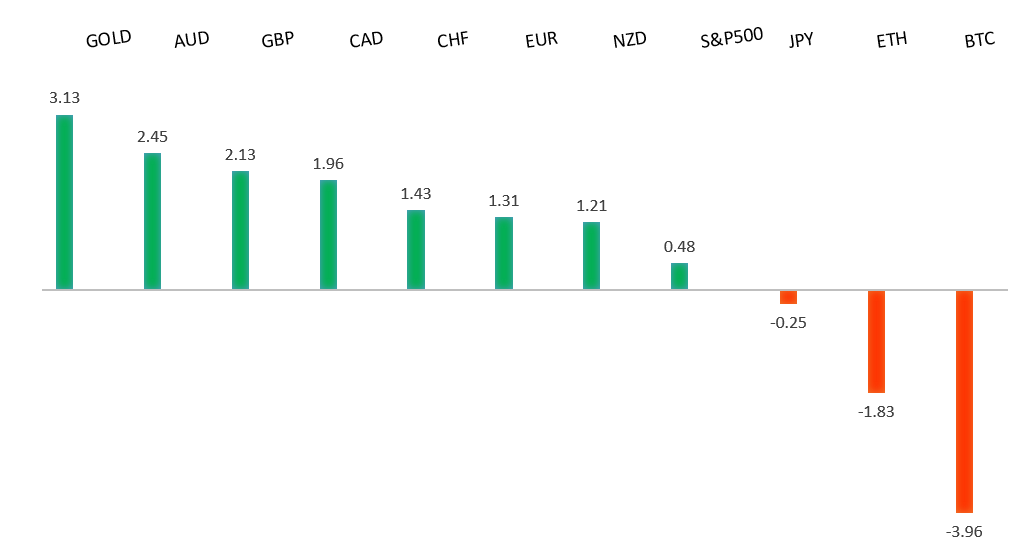
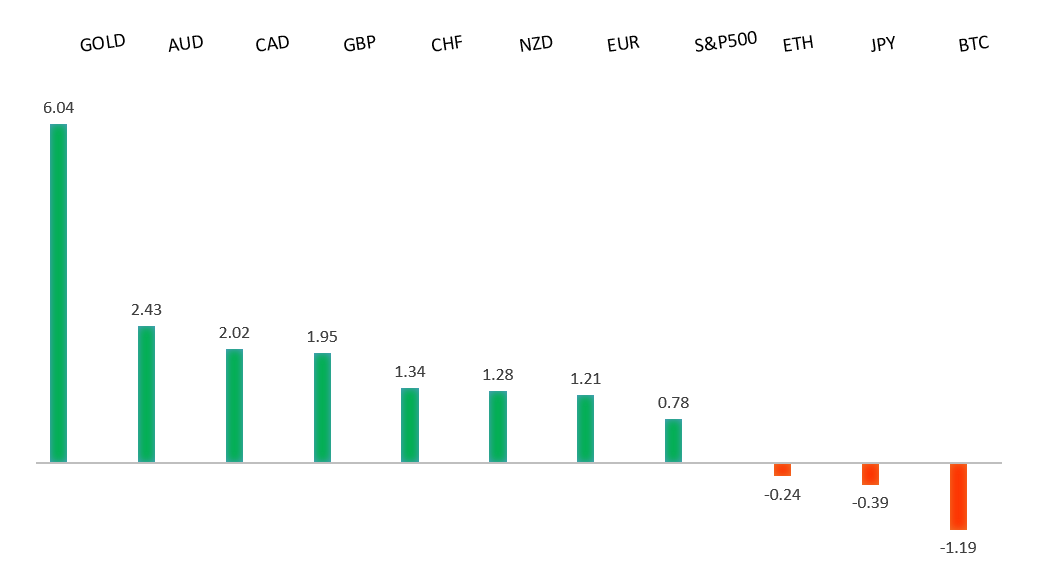
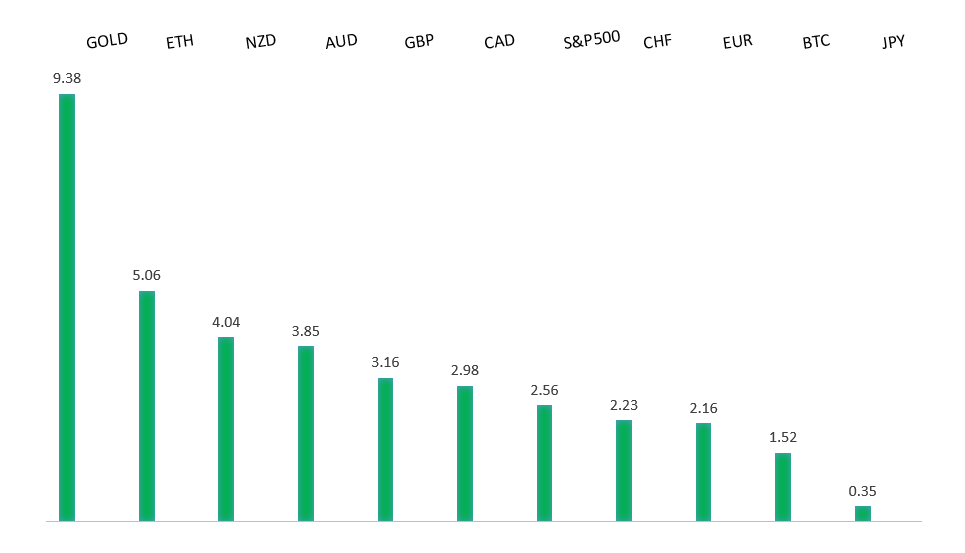
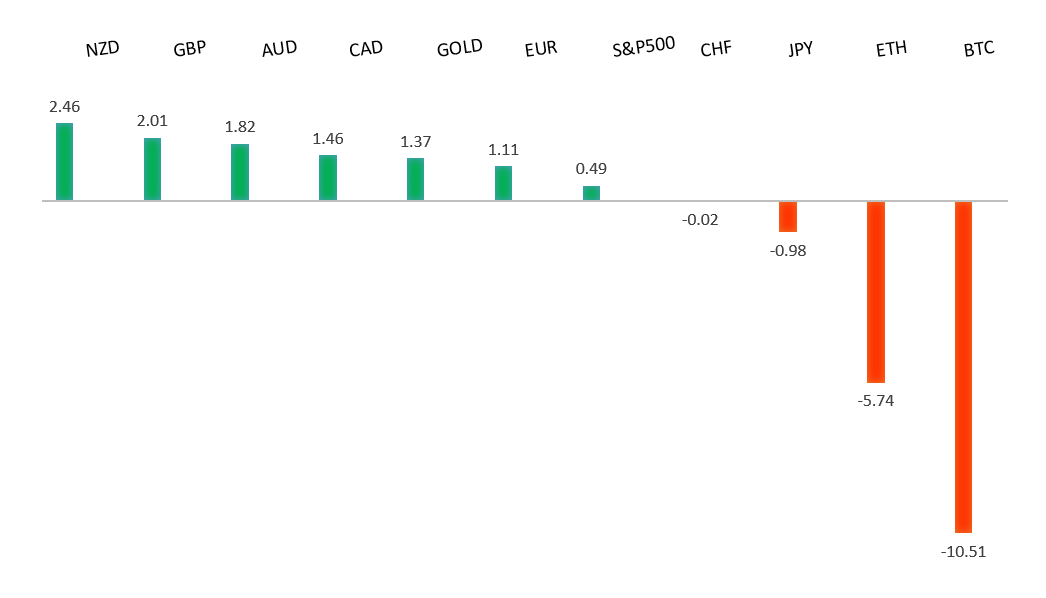
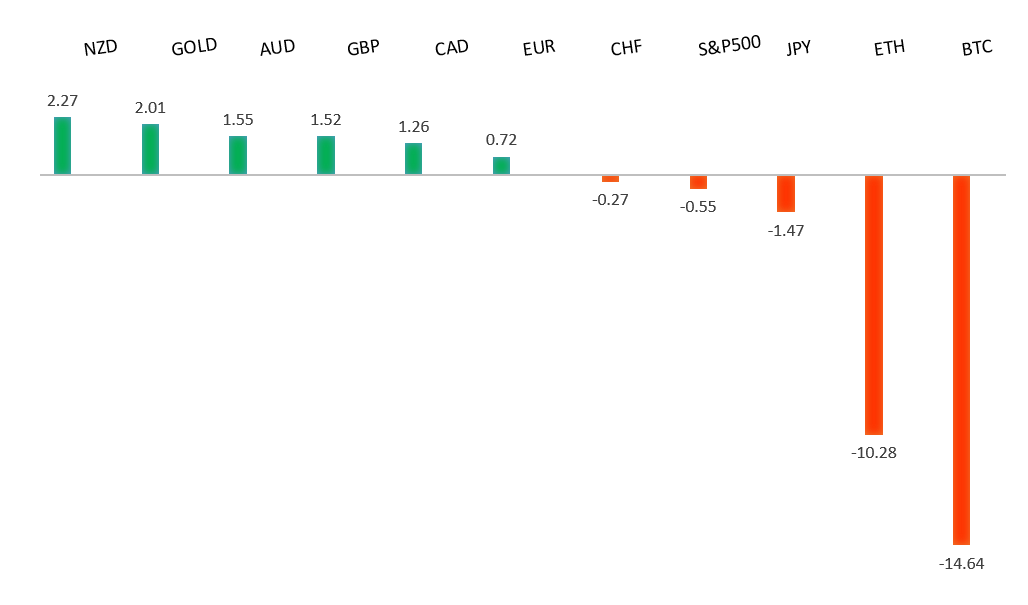
Performance chart 30day v. USD (%)
Performance Chart
 
 
Technical & fundamental highlights
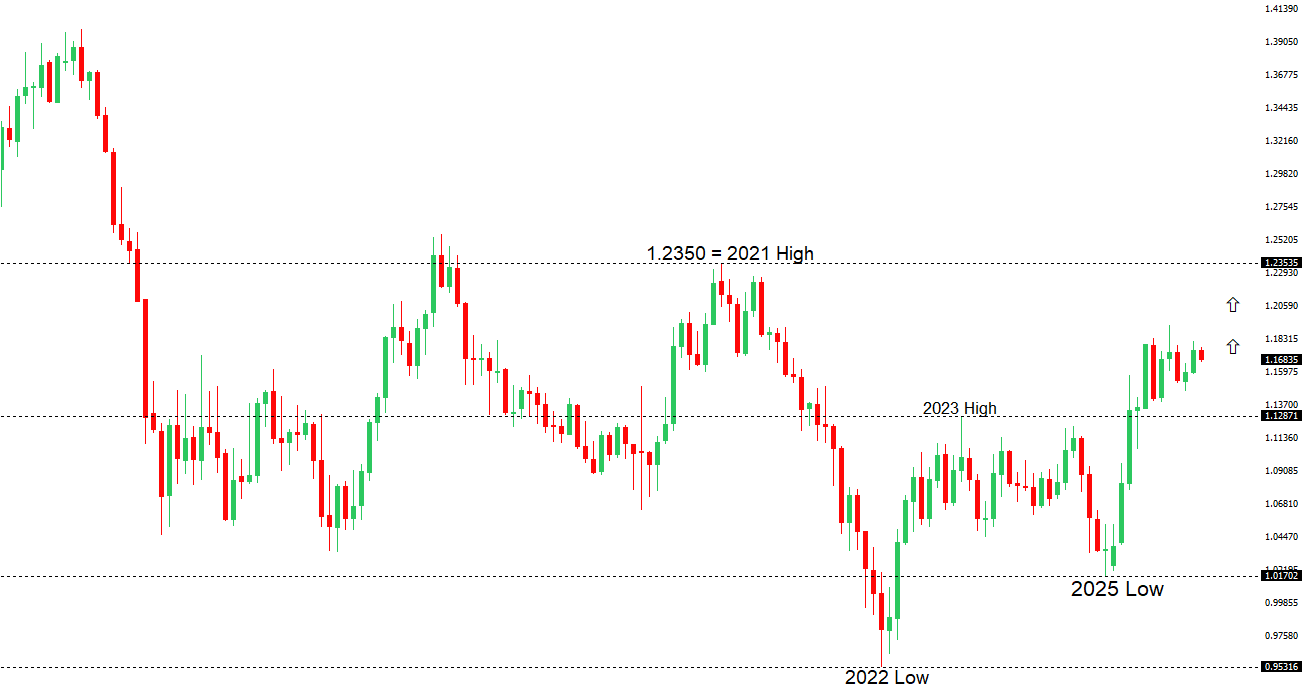
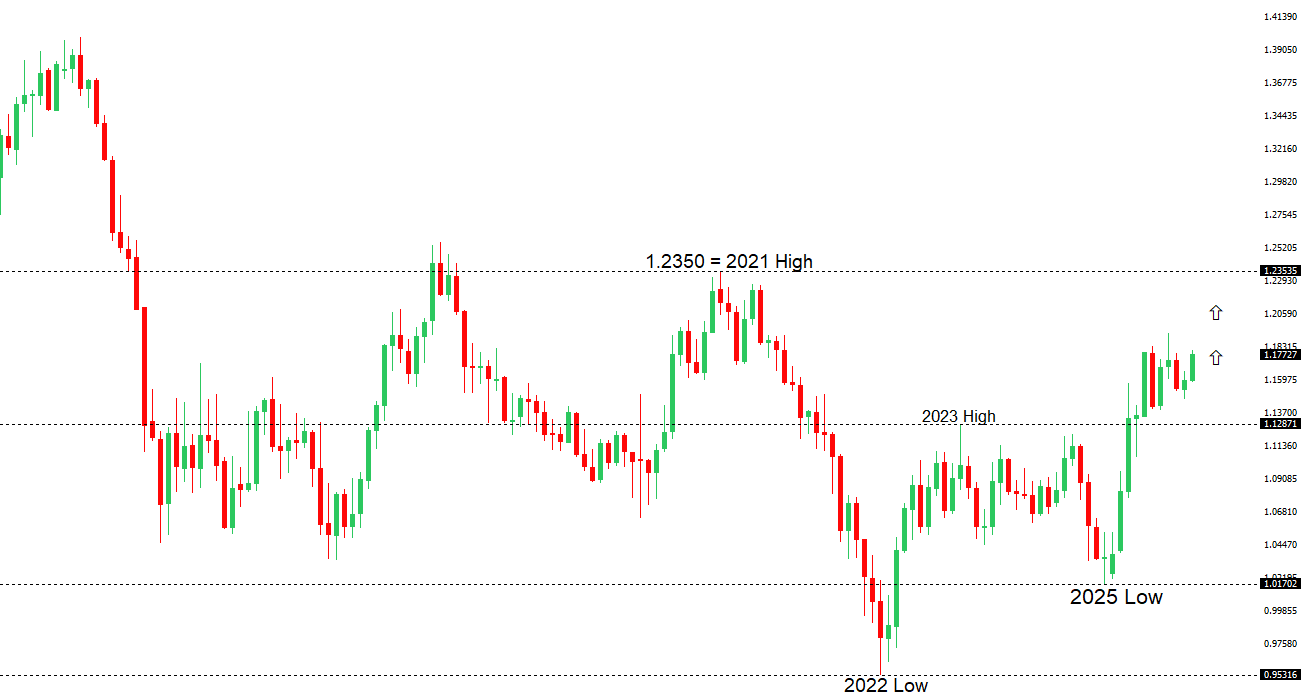
EURUSD: technical overview

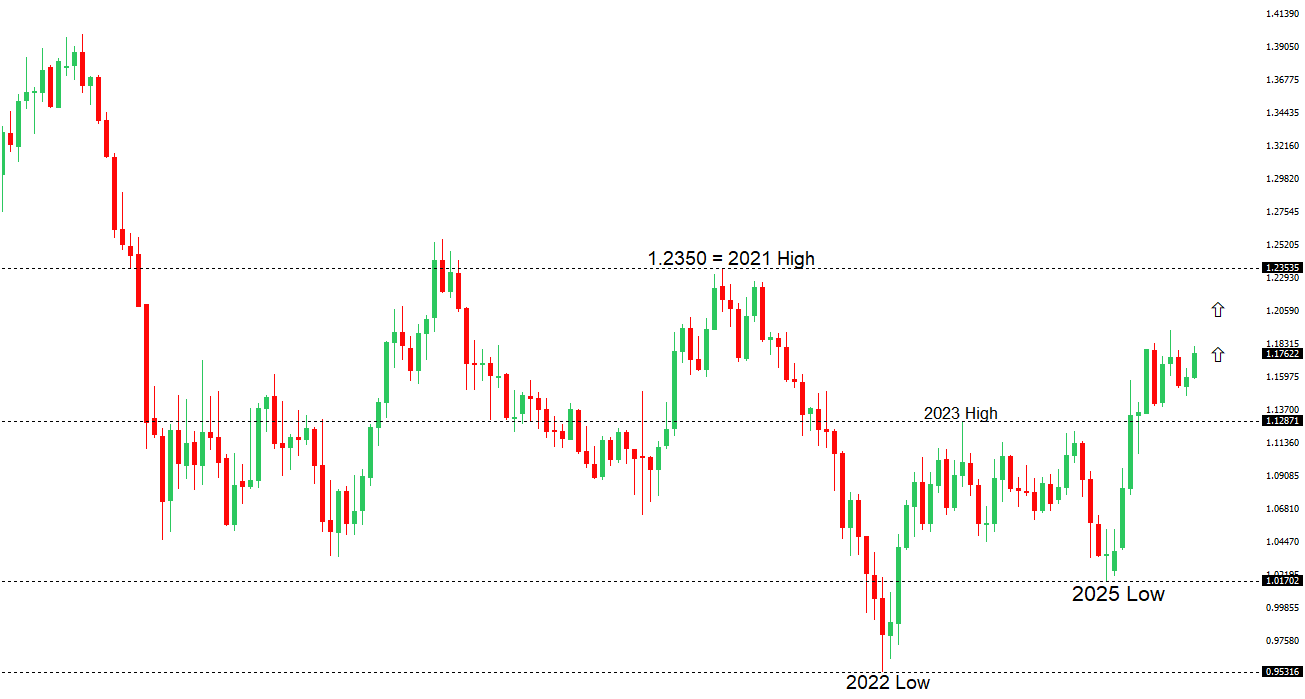
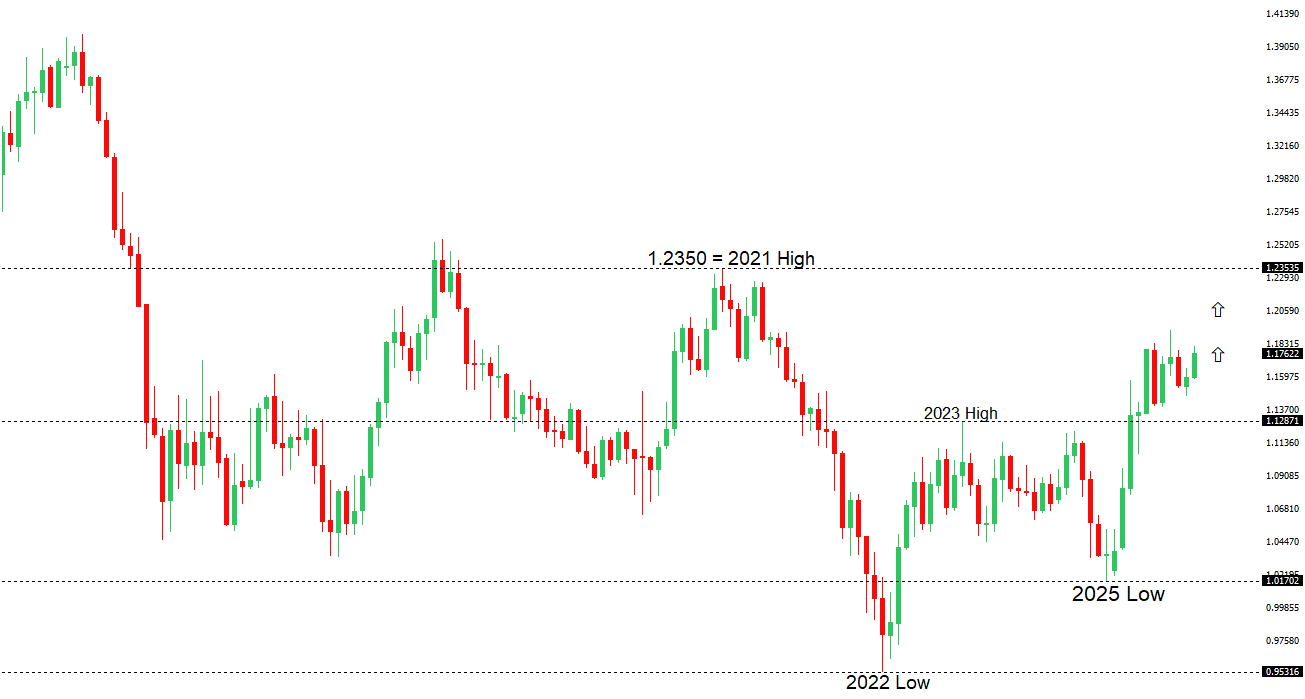
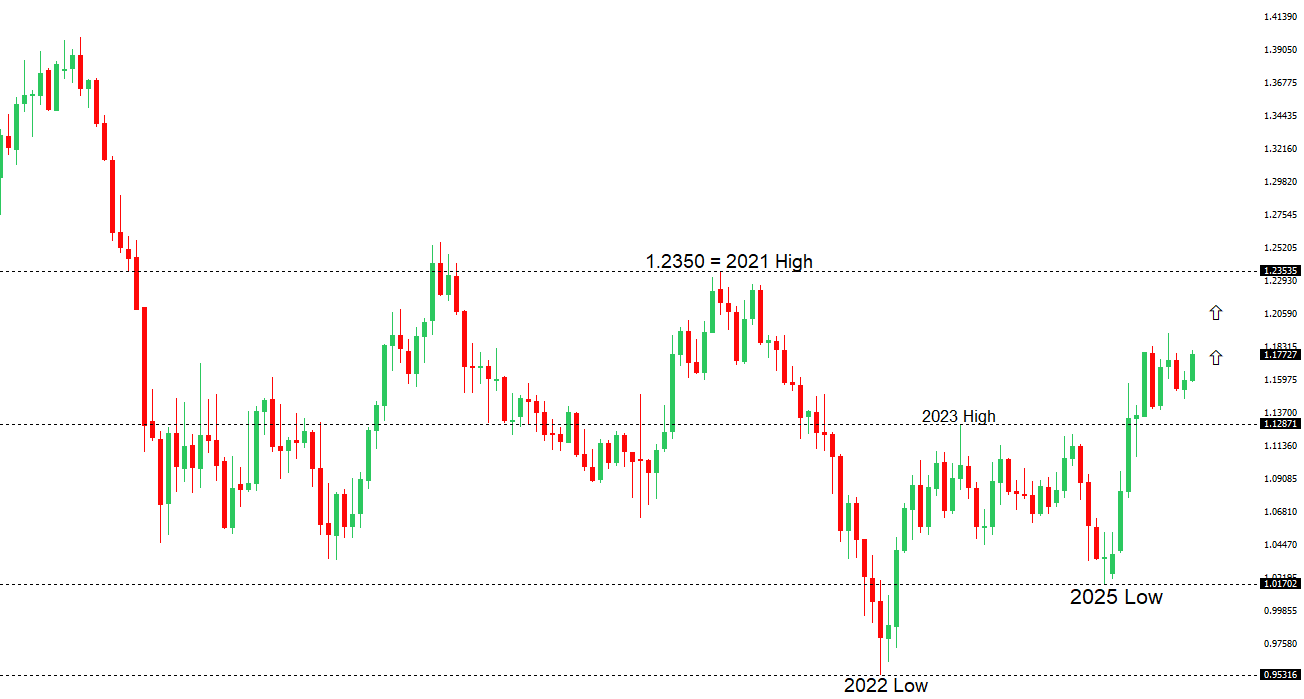
The Euro outlook remains constructive with higher lows sought out on dips in favor of the next major upside extension targeting the 2021 high at 1.2350. Setbacks should be exceptionally well supported ahead of 1.1400.

EURUSD Chart
R2 1.1919 - 17 September/2025 high -Strong
R1 1.1765 - 2 Janaury/2026 high - Medium
S1 1.1672 - 5 January /2026 low - Medium
S2 1.1615 - 9 December low - Strong
EURUSD: fundamental overview

The euro slipped about 0.4% to 1.1675, a roughly 2½-week low, largely reflecting a stronger dollar, with near-term moves still driven more by USD dynamics ahead of upcoming euro-area data. Looking into early 2026, the outlook for EURUSD is modestly positive after strong 2025 gains, supported by expectations that ECB rates will stay on hold while the Fed may cut, alongside improving euro-area growth. With inflation near target and ECB policymakers seen as resistant to further easing, markets see policy divergence as euro-supportive. Major banks project EURUSD around 1.22–1.26 by 2026, reinforcing a constructive medium-term view despite likely near-term range trading.

 
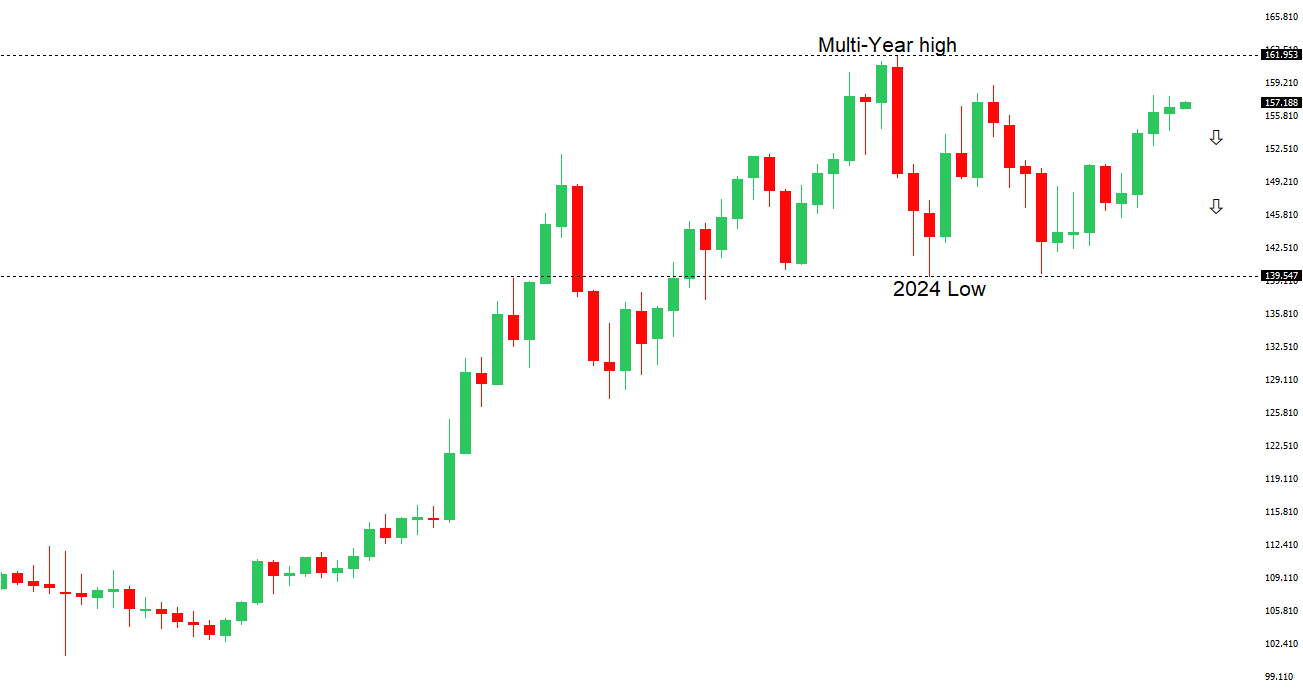
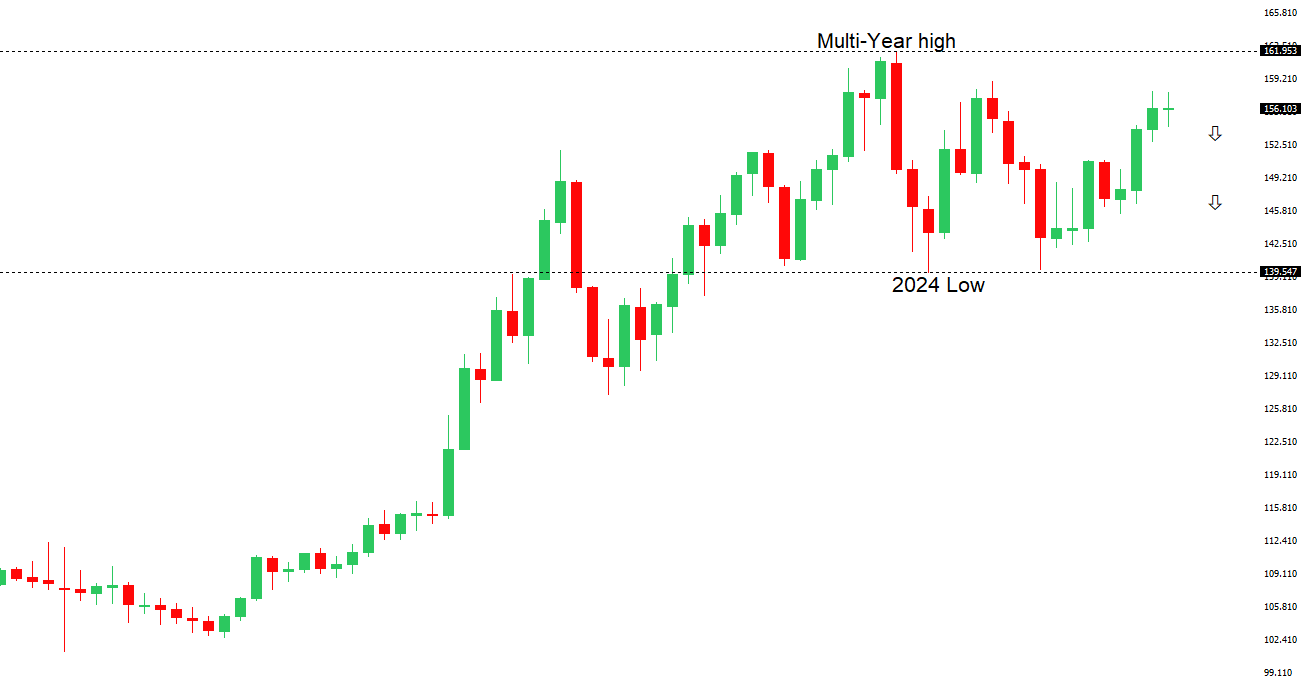
USDJPY: technical overview

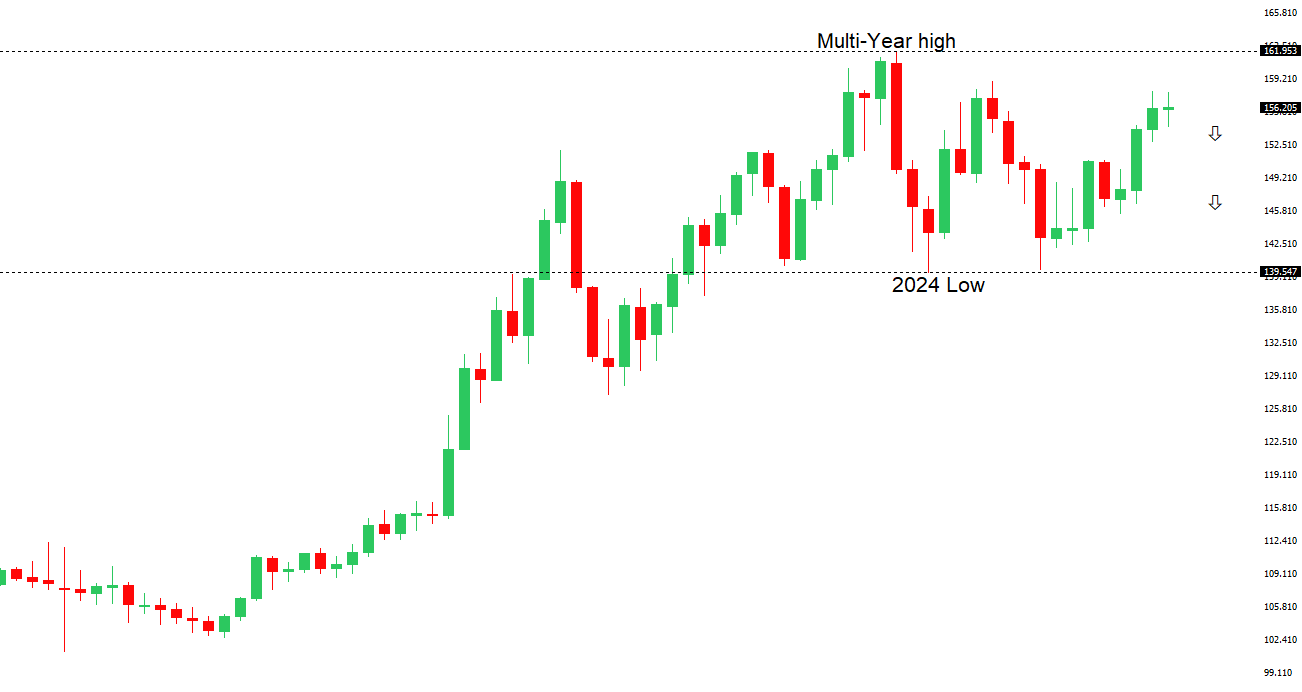
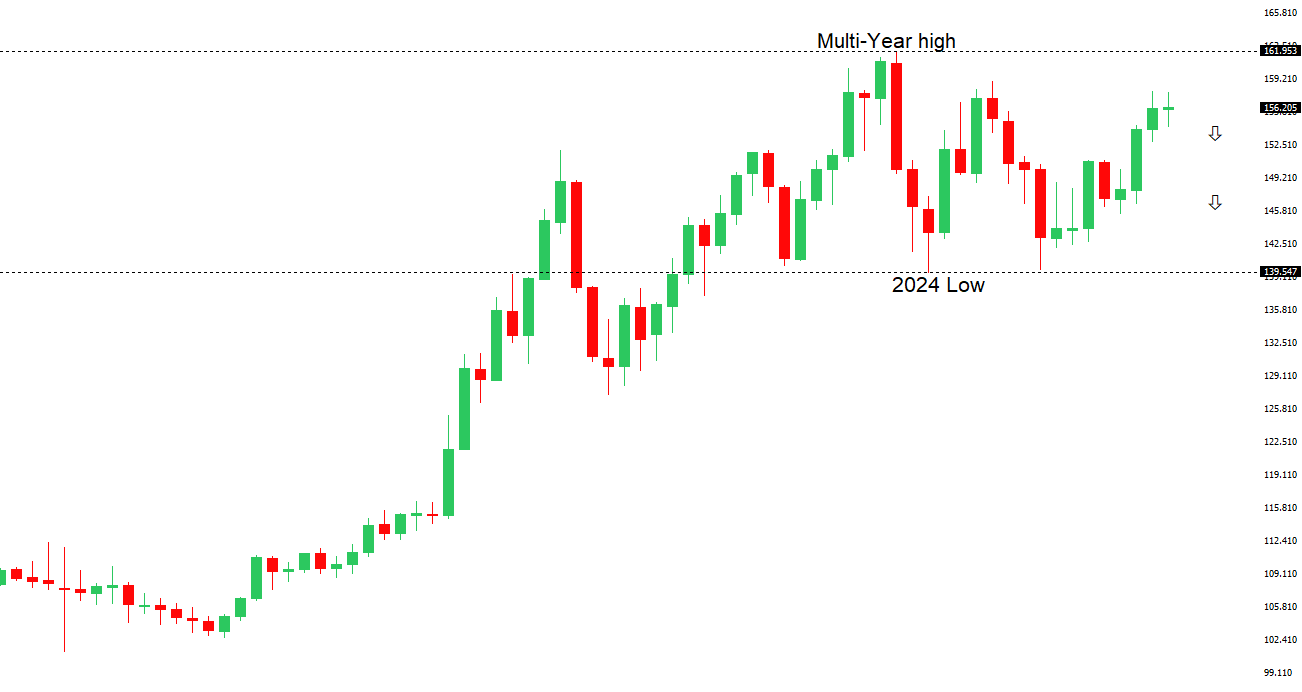
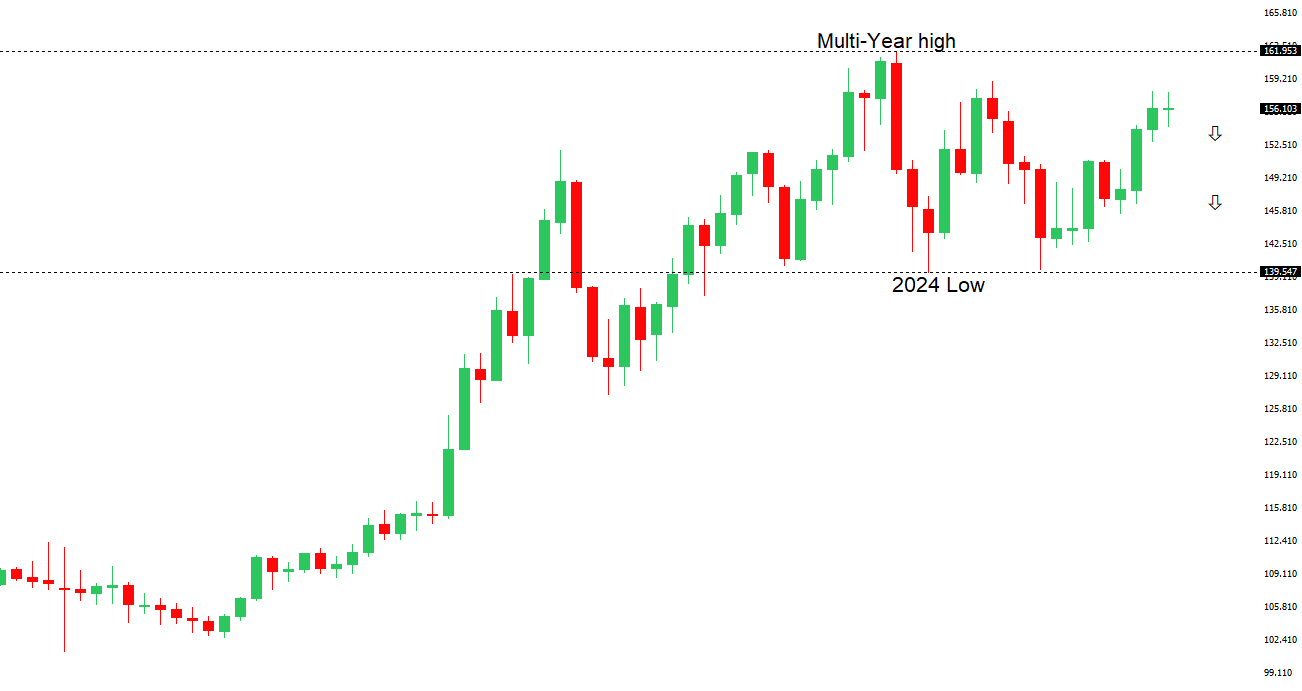
There are signs of a meaningful top in place after the market put in a multi-year high in 2024. At this point, rallies should be well capped ahead of 160.00 ahead of a fresh down-leg back towards the 2024 low at 139.58. A break below 154.39 will strengthen the outlook.

USDJPY Chart
R2 157.90 - 20 November/2025 high - Strong
R1 157.30 - 5 January /2026 high - Medium
S1 155.55 - 24 December low - Medium
S2 154.39 - 16 December low - Strong
USDJPY: fundamental overview

The dollar is holding near a two-week high versus the yen, supported by broad USD strength and steady signals from Japan. The BOJ reaffirmed it will keep raising rates as conditions allow, while Japan’s December manufacturing PMI was revised up to 50.0, signaling a return to expansion. Looking ahead, USDJPY is likely to consolidate or see modest yen strength in the near term, though the pair remains in a high range where U.S.–Japan yield spreads can quickly favor the dollar. Over 2026, gradual yen appreciation is expected as BOJ policy normalizes and Fed rate cuts narrow yield gaps, but sharp moves above 158–160 would raise the risk of official intervention. This week’s focus is on Japan’s wage data, which may soften on a monthly basis but still reflects solid underlying wage momentum that supports the BOJ’s inflation outlook.

 
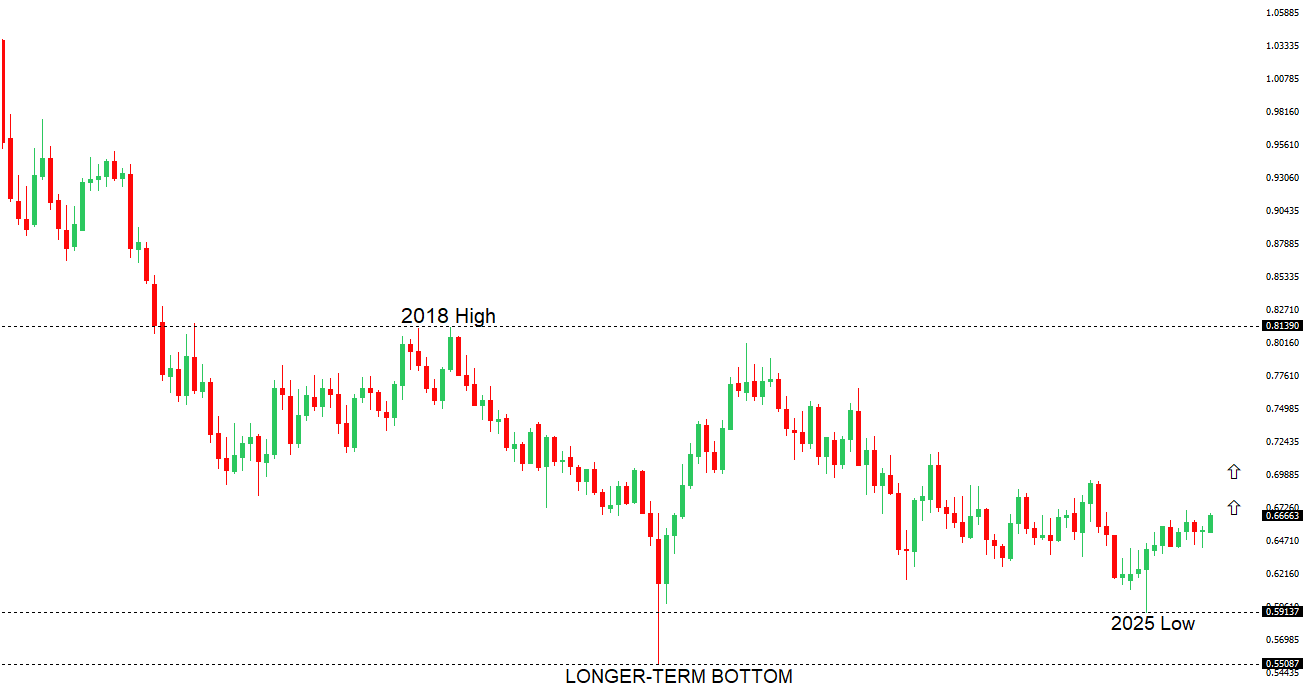
AUDUSD: technical overview

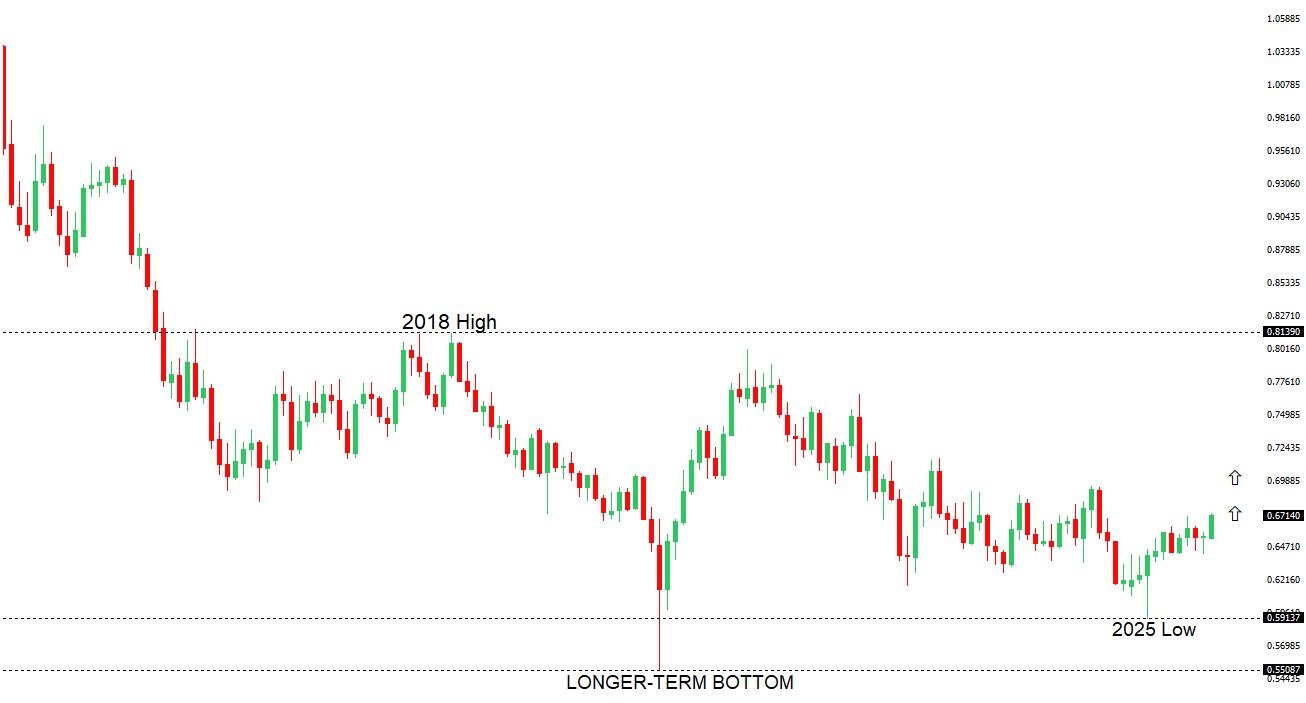
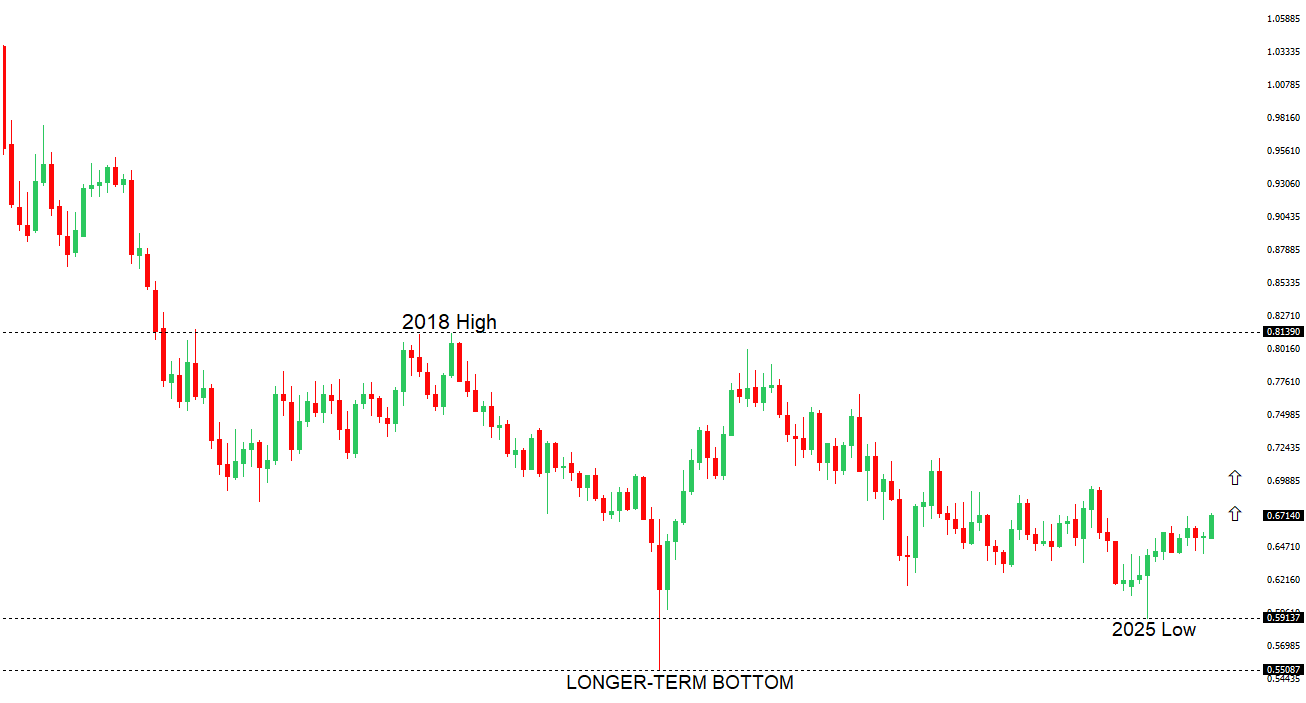
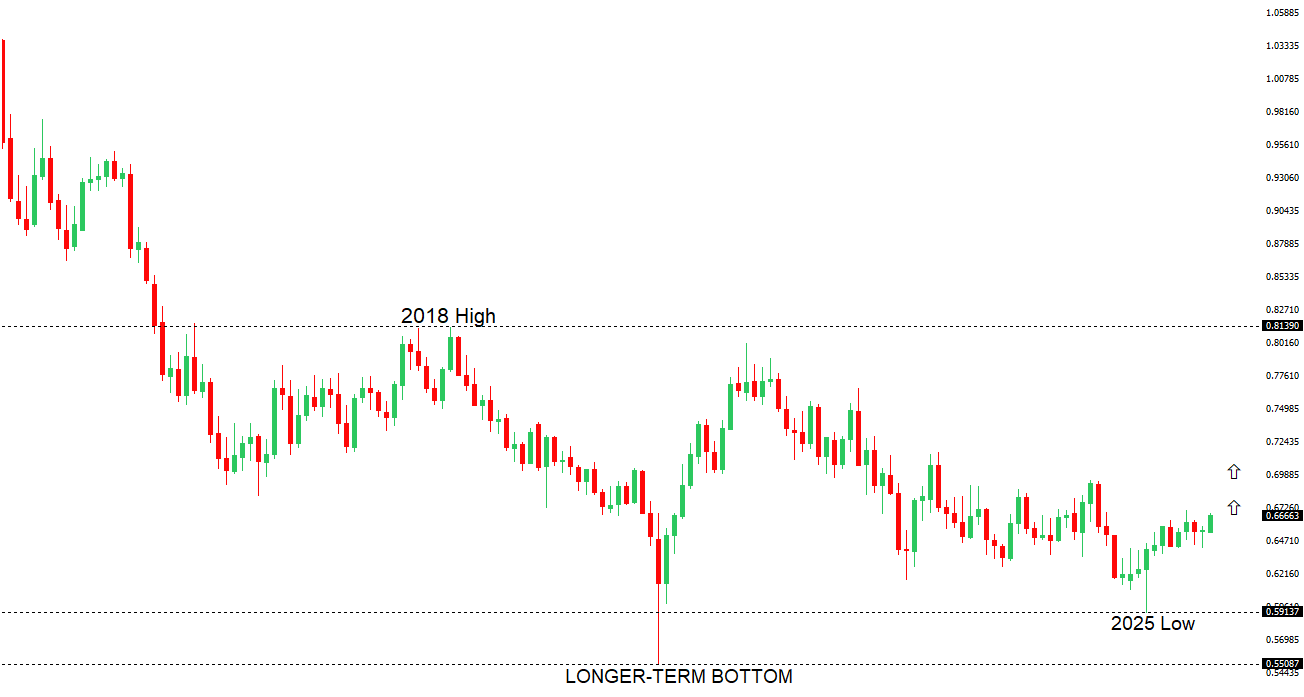
There are signs of the potential formation of a longer-term base with the market trading down into a meaningful longer-term support zone. Only a monthly close below 0.5500 would give reason for rethink. A monthly close back above 0.7000 will take the big picture pressure off the downside and strengthen case for a bottom.

AUDUSD Chart
R2 0.6800 - Figure - Medium
R1 0.6728 - 29 December/2025 high - Medium
S1 0.6592 - 18 December low - Medium
S2 0.6421 - 21 November low - Strong
AUDUSD: fundamental overview

The Australian dollar slipped 0.3% to 0.6670 as a stronger US dollar and rising geopolitical risks outweighed support from firm gold prices, with tensions around US-China relations weighing on risk-sensitive currencies. Despite this near-term softness, the AUD has appreciated since mid-November on growing expectations that the RBA could shift toward rate hikes by mid-2026, supported by resilient consumer spending, wage growth, and inflation pressures. This contrasts with expectations for continued Fed easing, a backdrop many analysts see as broadly AUD-supportive. Australia also enters 2026 with solid fundamentals, helped by improving Chinese data and steady growth prospects, while speculative positioning remains net short, leaving scope for further short-covering if upcoming inflation and activity data reinforce the “higher for longer” RBA view.

 
Suggested reading

The blue-collar jobs revival: The skills the world needs now, I. Berwick, FT (December 30, 2025)

The Challenges Facing Buffett’s Successor, R. Nagarajan, The Rational Walk (December 31, 2025)


Any opinions, news, research, analyses, prices or other information ("information") contained on this Blog, constitutes marketing communication and it has not been prepared in accordance with legal requirements designed to promote the independence of investment research. Further, the information contained within this Blog does not contain (and should not be construed as containing) investment advice or an investment recommendation, or an offer of, or solicitation for, a transaction in any financial instrument. LMAX Group has not verified the accuracy or basis-in-fact of any claim or statement made by any third parties as comments for every Blog entry.

LMAX Group will not accept liability for any loss or damage, including without limitation to, any loss of profit, which may arise directly or indirectly from use of or reliance on such information. No representation or warranty is given as to the accuracy or completeness of the above information. While the produced information was obtained from sources deemed to be reliable, LMAX Group does not provide any guarantees about the reliability of such sources. Consequently any person acting on it does so entirely at his or her own risk. It is not a place to slander, use unacceptable language or to promote LMAX Group or any other FX and CFD provider and any such postings, excessive or unjust comments and attacks will not be allowed and will be removed from the site immediately.

Day Image
31st December 2025 | view in browser
Global growth steadies, policy support edges closer

Global macro signals heading into the new day point to steady but uneven growth across regions, with inflation generally easing and policy turning more supportive into 2026.


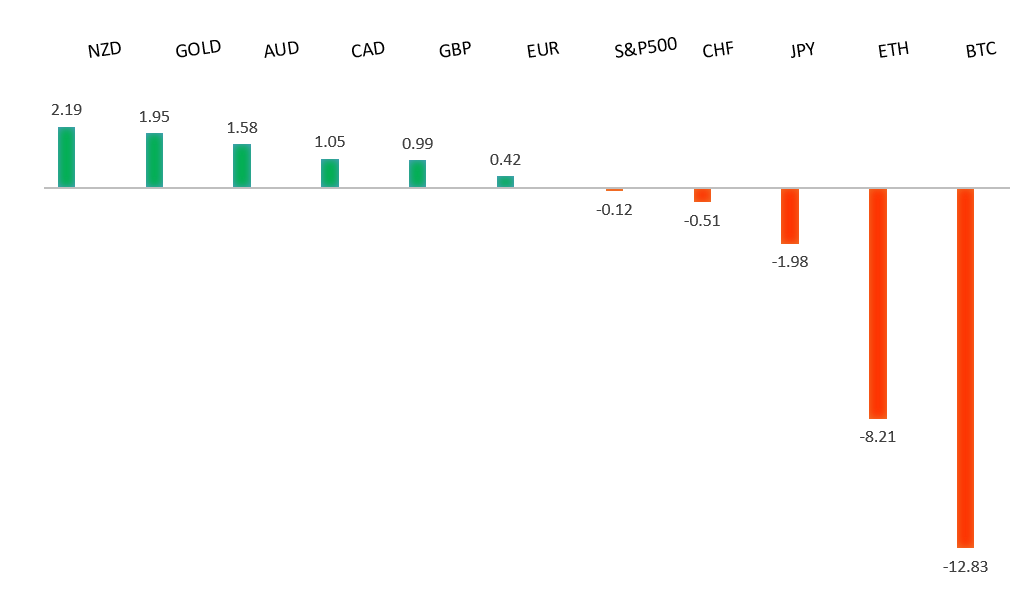
Performance chart 30day v. USD (%)
Performance Chart
 
 
Technical & fundamental highlights
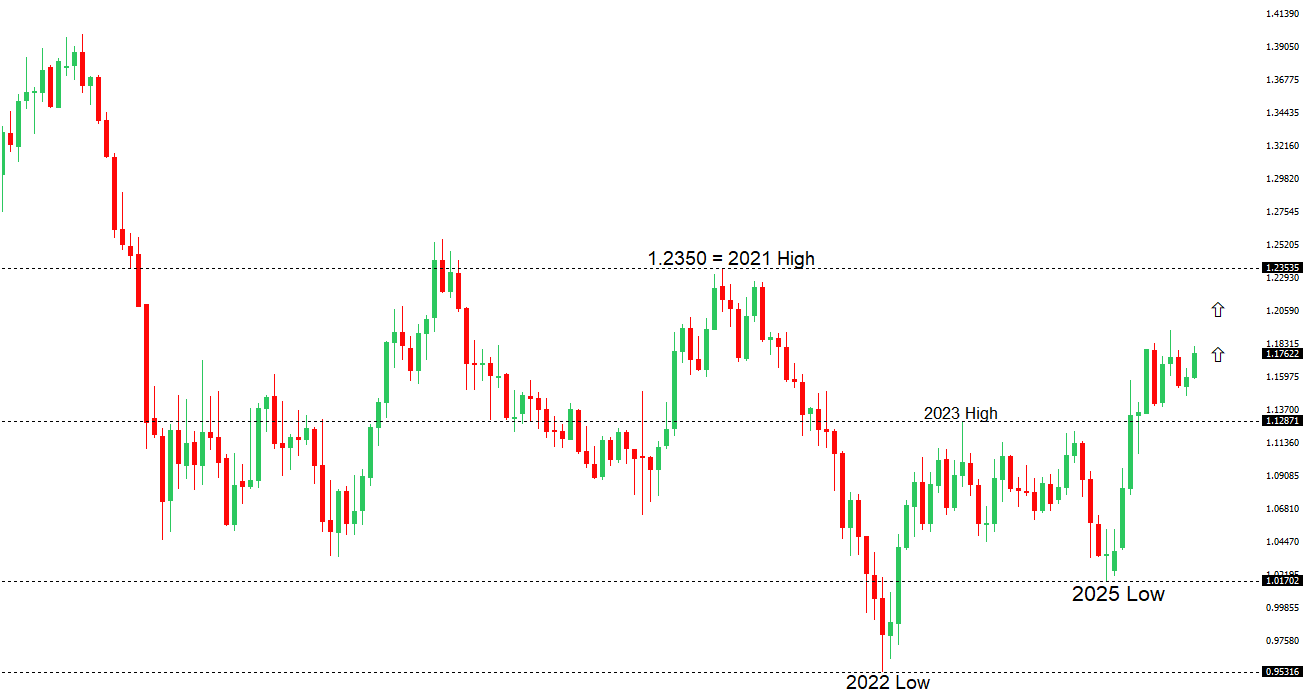
EURUSD: technical overview

The Euro outlook remains constructive with higher lows sought out on dips in favor of the next major upside extension targeting the 2021 high at 1.2350. Setbacks should be exceptionally well supported ahead of 1.1400.

EURUSD Chart
R2 1.1919 - 17 September/2025 high -Strong
R1 1.1809 - 24 December high - Medium
S1 1.1703 - 19 December low - Strong
S2 1.1615 - 9 December low - Strong
EURUSD: fundamental overview

The Euro came under some pressure after failing to hold gains, with year-end flows limiting momentum despite a broader medium-term USD bearish backdrop. The key driver remains policy divergence: the ECB is signalling patience and caution, keeping rates at 2% as inflation hovers near target, while markets still expect the Fed to deliver further easing into 2026 despite internal disagreement on timing. Spanish inflation eased slightly in December but remains above the euro-area average, reinforcing expectations that the ECB will stay on hold for longer. Looking ahead, improving eurozone growth, a narrowing US growth advantage, and concerns over US debt and valuations underpin expectations among major banks for EURUSD to rise toward 1.20–1.25 by end-2026.

 
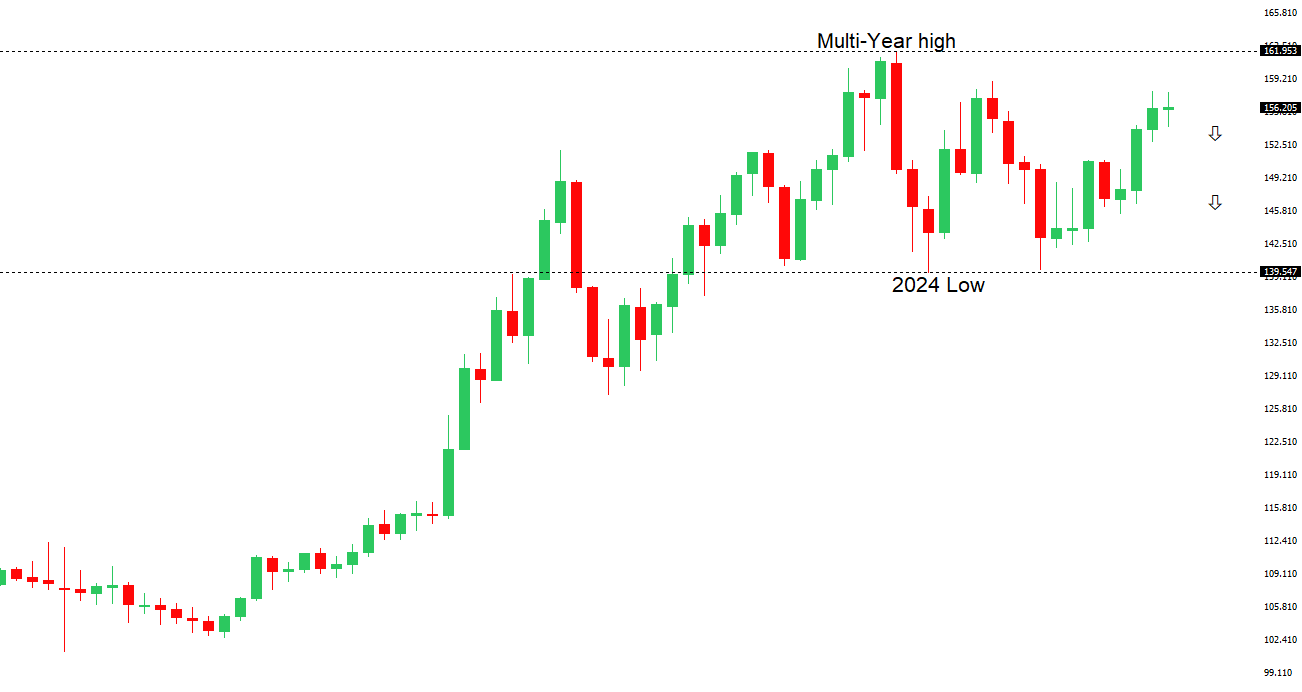
USDJPY: technical overview

There are signs of a meaningful top in place after the market put in a multi-year high in 2024. At this point, rallies should be well capped ahead of 160.00 ahead of a fresh down-leg back towards the 2024 low at 139.58.

USDJPY Chart
R2 157.90 - 20 November/2025 high - Strong
R1 157.00 - Figure - Medium
S1 154.39 - 16 December low - Strong
S2 153.61 - 14 November low - Medium
USDJPY: fundamental overview

The yen remains driven more by concerns over Japan’s fiscal stance and policy credibility than by a clear normalization story. While the BOJ continues to debate gradual rate hikes, arguing policy is still below neutral, Japan’s expansionary budget and structural headwinds keep the yen under pressure. Authorities have signaled readiness to intervene if USDJPY breaks above 158, which would significantly raise political pressure, even as markets watch key technical levels around 155. Longer term, views are split: some see gradual BOJ tightening and Fed easing supporting yen appreciation, while many banks still expect persistent yen weakness due to wide yield gaps, negative real rates, capital outflows, and limits on how far the BOJ can raise rates.

 
AUDUSD: technical overview

There are signs of the potential formation of a longer-term base with the market trading down into a meaningful longer-term support zone. Only a monthly close below 0.5500 would give reason for rethink. A monthly close back above 0.7000 will take the big picture pressure off the downside and strengthen case for a bottom.

AUDUSD Chart
R2 0.6800 - Figure - Medium
R1 0.6728 - 29 December/2025 high - Medium
S1 0.6592 - 18 December low - Medium
S2 0.6421 - 21 November low - Strong
AUDUSD: fundamental overview

The Australian dollar is holding up close to its year-to-date high, supported by resilient commodity demand and expectations that the RBA may shift toward tightening as inflation risks persist. Positive but modest support has come from signs of stabilization in China’s economy, though markets remain cautious given the uneven recovery and limited policy clarity. With the Aussie among the top-performing G10 currencies this quarter, sustained gains since mid-November, strong commodities, improving global risk sentiment, and a softer US dollar backdrop are expected to support further AUD appreciation into 2026.

 
Suggested reading

How Do Keynesians Think the Economy Will Perform In ’26?, J. Mathis, The Week (December 30, 2025)

A Weak Dollar Remains Big Danger, J. Tamny, The Steve Gruber Show (December 28, 2025)


Any opinions, news, research, analyses, prices or other information ("information") contained on this Blog, constitutes marketing communication and it has not been prepared in accordance with legal requirements designed to promote the independence of investment research. Further, the information contained within this Blog does not contain (and should not be construed as containing) investment advice or an investment recommendation, or an offer of, or solicitation for, a transaction in any financial instrument. LMAX Group has not verified the accuracy or basis-in-fact of any claim or statement made by any third parties as comments for every Blog entry.

LMAX Group will not accept liability for any loss or damage, including without limitation to, any loss of profit, which may arise directly or indirectly from use of or reliance on such information. No representation or warranty is given as to the accuracy or completeness of the above information. While the produced information was obtained from sources deemed to be reliable, LMAX Group does not provide any guarantees about the reliability of such sources. Consequently any person acting on it does so entirely at his or her own risk. It is not a place to slander, use unacceptable language or to promote LMAX Group or any other FX and CFD provider and any such postings, excessive or unjust comments and attacks will not be allowed and will be removed from the site immediately.

Day Image
30th December 2025 | view in browser
Global tensions steady as Fed Minutes loom

Global markets remain focused on contained geopolitical tensions—from China–Taiwan military drills to ongoing Ukraine peace negotiations—while navigating diverging central bank paths, mixed economic data, and resilient equity performance across Asia and parts of Europe. Near-term event risk centers on today’s FOMC minutes, which could clarify the Fed’s internal policy divide and shape expectations around the timing and scale of rate cuts priced into 2026.


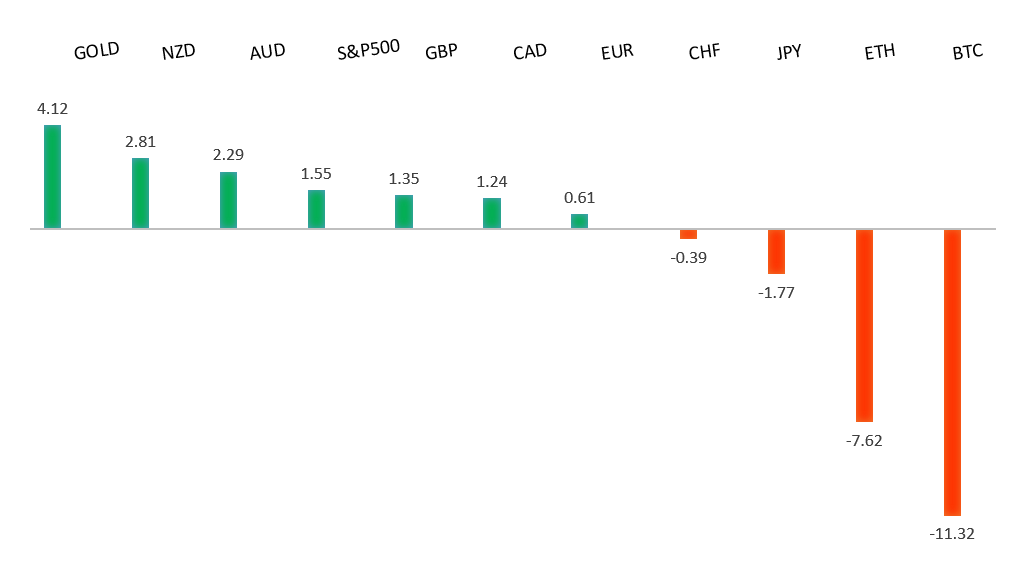
Performance chart 30day v. USD (%)
Performance Chart
 
 
Technical & fundamental highlights
EURUSD: technical overview

The Euro outlook remains constructive with higher lows sought out on dips in favor of the next major upside extension targeting the 2021 high at 1.2350. Setbacks should be exceptionally well supported ahead of 1.1400.

EURUSD Chart
R2 1.1919 - 17 September/2025 high -Strong
R1 1.1809 - 24 December high - Medium
S1 1.1703 - 19 December low - Strong
S2 1.1615 - 9 December low - Strong
EURUSD: fundamental overview

The euro remains up 13.7% year-to-date, with near-term price action driven more by the US dollar and a general risk-on mood than by Eurozone data. But for the moment, thin holiday liquidity limits conviction. Some strategists note EURUSD is closely tracking patterns seen during Trump’s first presidency, suggesting upside targets for 2026 could be reached as early as Q1 if the analogy holds. Geopolitically, Ukraine’s push for long-term US-backed security guarantees is modestly supportive for the euro over the medium term, though recent setbacks in peace efforts and lingering war risk cap near-term optimism. Positioning data show elevated long euro exposure, but not yet at levels that typically signal an imminent reversal.

 
USDJPY: technical overview

There are signs of a meaningful top in place after the market put in a multi-year high in 2024. At this point, rallies should be well capped ahead of 160.00 ahead of a fresh down-leg back towards the 2024 low at 139.58.

USDJPY Chart
R2 157.90 - 20 November/2025 high - Strong
R1 157.00 - Figure - Medium
S1 154.39 - 16 December low - Strong
S2 153.61 - 14 November low - Medium
USDJPY: fundamental overview

The yen edged slightly lower as markets remain focused on Japan’s very loose fiscal policy and cautious monetary outlook. While the BOJ is debating gradual rate hikes and sees room to tighten further, softer Tokyo inflation data has reinforced a slower pace of tightening, limiting yen support. Authorities have signaled readiness to intervene if USDJPY breaks above 158, a level that would significantly raise pressure for action. Although a combination of gradual BOJ tightening and eventual Fed easing could support yen appreciation, many banks still expect the currency to remain structurally weak for years due to wide yield gaps, negative real rates, and persistent capital outflows.

 
AUDUSD: technical overview

There are signs of the potential formation of a longer-term base with the market trading down into a meaningful longer-term support zone. Only a monthly close below 0.5500 would give reason for rethink. A monthly close back above 0.7000 will take the big picture pressure off the downside and strengthen case for a bottom.

AUDUSD Chart
R2 0.6800 - Figure - Medium
R1 0.6728 - 29 December/2025 high - Medium
S1 0.6592 - 18 December low - Medium
S2 0.6421 - 21 November low - Strong
AUDUSD: fundamental overview

The Australian dollar edged higher as precious metals stabilized after a sharp sell-off earlier in the week. The Aussie remains one of the top three performing G10 currencies this quarter, despite recent volatility driven by profit-taking in silver and gold following higher margin requirements. We continue to view pullbacks as buying opportunities, with the currency supported by expectations that the RBA could begin tightening policy in early 2026, alongside resilient domestic economic data, strong commodity demand, improving global risk sentiment, and a broadly weaker US dollar—factors that together point to continued AUD strength into 2026.

 
Suggested reading

The Bear Market Nobody Sees Coming, Except This Guy, L. Lango, InvestorPlace (December 29, 2025)

The Fed Was Never Steering the Ship. Evidence? The Growth, J. Tamny, Forbes (December 28, 2025)


Any opinions, news, research, analyses, prices or other information ("information") contained on this Blog, constitutes marketing communication and it has not been prepared in accordance with legal requirements designed to promote the independence of investment research. Further, the information contained within this Blog does not contain (and should not be construed as containing) investment advice or an investment recommendation, or an offer of, or solicitation for, a transaction in any financial instrument. LMAX Group has not verified the accuracy or basis-in-fact of any claim or statement made by any third parties as comments for every Blog entry.

LMAX Group will not accept liability for any loss or damage, including without limitation to, any loss of profit, which may arise directly or indirectly from use of or reliance on such information. No representation or warranty is given as to the accuracy or completeness of the above information. While the produced information was obtained from sources deemed to be reliable, LMAX Group does not provide any guarantees about the reliability of such sources. Consequently any person acting on it does so entirely at his or her own risk. It is not a place to slander, use unacceptable language or to promote LMAX Group or any other FX and CFD provider and any such postings, excessive or unjust comments and attacks will not be allowed and will be removed from the site immediately.

Day Image
29th December 2025 | view in browser
Calm open, big cross-currents

Global markets open the day calmly on the surface but with powerful cross-currents underneath. US equities are consolidating near record highs in thin holiday trading, with focus squarely on upcoming FOMC minutes that could clarify the widening disconnect between the Fed’s hawkish outlook and markets still pricing multiple rate cuts, even as yields ease, the dollar slides toward multi-year lows, and political uncertainty clouds Fed independence.


Performance chart 30day v. USD (%)
Performance Chart
 
 
Technical & fundamental highlights
EURUSD: technical overview

The Euro outlook remains constructive with higher lows sought out on dips in favor of the next major upside extension targeting the 2021 high at 1.2350. Setbacks should be exceptionally well supported ahead of 1.1400.

EURUSD Chart
R2 1.1919 - 17 September/2025 high -Strong
R1 1.1809 - 24 December high - Medium
S1 1.1703 - 19 December low - Strong
S2 1.1615 - 9 December low - Strong
EURUSD: fundamental overview

The euro is consolidating near recent highs as ECB messaging and staff forecasts signal a neutral policy stance, with rates likely on hold through 2026, keeping policy divergence with the Fed supportive for EUR on dips. Major banks now see scope for a stronger euro in 2026 as euro-area data improve and Fed easing weakens the dollar, even if volatility persists near term. ECB projections show growth around potential and inflation near target, reinforcing the view that policy is in a “good place,” while positioning data show long EUR exposure but not at extreme levels. Near-term focus turns to upcoming euro-area manufacturing, inflation, and Swiss leading indicator data.

 
USDJPY: technical overview

There are signs of a meaningful top in place after the market put in a multi-year high in 2024. At this point, rallies should be well capped ahead of 160.00 ahead of a fresh down-leg back towards the 2024 low at 139.58.

USDJPY Chart
R2 157.90 - 20 November/2025 high - Strong
R1 157.00 - Figure - Medium
S1 154.39 - 16 December low - Strong
S2 153.61 - 14 November low - Medium
USDJPY: fundamental overview

The yen edged slightly higher against the dollar as markets stayed alert to possible government intervention, especially with officials signaling readiness to act if depreciation becomes excessive. Softer-than-expected December inflation data in Tokyo support a slower pace of BOJ rate hikes, even as underlying price pressures like rising rents keep gradual policy normalization on the table. While a move above 158 in USDJPY would likely increase intervention risk and near-term downside for the pair—particularly if BOJ tightening coincides with Fed easing—many banks still expect the yen to remain structurally weak into 2026 due to wide yield differentials, negative real rates, and persistent capital outflows.

 
AUDUSD: technical overview

There are signs of the potential formation of a longer-term base with the market trading down into a meaningful longer-term support zone. Only a monthly close below 0.5500 would give reason for rethink. A monthly close back above 0.7000 will take the big picture pressure off the downside and strengthen case for a bottom.

AUDUSD Chart
R2 0.6800 - Figure - Medium
R1 0.6728 - 29 December/2025 high - Medium
S1 0.6592 - 18 December low - Medium
S2 0.6421 - 21 November low - Strong
AUDUSD: fundamental overview

The Australian dollar has extended its run to another new year-to-date high, supported by growing expectations that the RBA may shift toward a tightening cycle by mid-2026 as consumer spending and wage growth fuel inflation pressures. Many bank analysts expect the run to continue, helped by seasonal strength and improving global conditions, though weaker Chinese industrial profits could limit near-term gains. Any pullbacks are likely to attract buyers amid positive global risk sentiment and hopes of increased Chinese fiscal support in 2026, while Australia’s data calendar remains light this week.

 
Suggested reading

The blue-collar jobs revival: The skills the world needs now, I. Berwick, Financial Times (December 29, 2025)

Santa Rally Is Off To a Good Start, Matters for Investors, I. Wang, Marketwatch (December 26, 2025)


Any opinions, news, research, analyses, prices or other information ("information") contained on this Blog, constitutes marketing communication and it has not been prepared in accordance with legal requirements designed to promote the independence of investment research. Further, the information contained within this Blog does not contain (and should not be construed as containing) investment advice or an investment recommendation, or an offer of, or solicitation for, a transaction in any financial instrument. LMAX Group has not verified the accuracy or basis-in-fact of any claim or statement made by any third parties as comments for every Blog entry.

LMAX Group will not accept liability for any loss or damage, including without limitation to, any loss of profit, which may arise directly or indirectly from use of or reliance on such information. No representation or warranty is given as to the accuracy or completeness of the above information. While the produced information was obtained from sources deemed to be reliable, LMAX Group does not provide any guarantees about the reliability of such sources. Consequently any person acting on it does so entirely at his or her own risk. It is not a place to slander, use unacceptable language or to promote LMAX Group or any other FX and CFD provider and any such postings, excessive or unjust comments and attacks will not be allowed and will be removed from the site immediately.

Day Image
24th December 2025 | view in browser
Fed cut expectations firm into holidays

The US Dollar is softer across the board as markets drift toward the Christmas break following yesterday’s mixed US data, which has reinforced expectations for further Fed rate cuts in 2026.


Performance chart 30day v. USD (%)
Performance Chart
 
 
Technical & fundamental highlights
EURUSD: technical overview

The Euro outlook remains constructive with higher lows sought out on dips in favor of the next major upside extension targeting the 2021 high at 1.2350. Setbacks should be exceptionally well supported ahead of 1.1400.

EURUSD Chart
R2 1.1919 - 17 September/2025 high -Strong
R1 1.1809 - 24 December high - Medium
S1 1.1703 - 19 December low - Strong
S2 1.1615 - 9 December low - Strong
EURUSD: fundamental overview

The euro remains near its strongest level since late September. Support has come from the ECB keeping rates unchanged, expressing confidence in the eurozone’s resilience to US tariffs, and raising its 2025 growth forecast to 1.4%. Stronger-than-expected data, including a sharp drop in German import prices due to lower energy costs, also helped sentiment, even as German bond yields eased from recent highs. European stocks finished modestly higher, led by pharmaceutical shares after Novo Nordisk secured US approval for its oral obesity drug.

 
USDJPY: technical overview

There are signs of a meaningful top in place after the market put in a multi-year high in 2024. At this point, rallies should be well capped ahead of 160.00 ahead of a fresh down-leg back towards the 2024 low at 139.58.

USDJPY Chart
R2 157.90 - 20 November/2025 high - Strong
R1 157.00 - Figure - Medium
S1 154.39 - 16 December low - Strong
S2 153.61 - 14 November low - Medium
USDJPY: fundamental overview

The yen has pulled back from recent highs as repeated warnings from Japanese officials about possible FX intervention limited gains, while a weaker US dollar—on expectations of Fed rate cuts—offered some support. Japan’s 10-year bond yield slipped to 2.02% from record levels after the BoJ’s recent rate hike, with markets weighing the impact of a record-sized FY2026 budget that will require more bond issuance and awaiting policy clues from Governor Ueda’s upcoming speech. Recent BoJ minutes pointed to a steady but moderate economic recovery, inflation led by food prices, and ongoing global risks, while today’s data showed stable service-sector inflation and economic indicators consistent with steady growth momentum.

 
AUDUSD: technical overview

There are signs of the potential formation of a longer-term base with the market trading down into a meaningful longer-term support zone. Only a monthly close below 0.5500 would give reason for rethink. A monthly close back above 0.7000 will take the big picture pressure off the downside and strengthen case for a bottom.

AUDUSD Chart
R2 0.6800 - Figure - Medium
R1 0.6718 - 24 December/2025 high - Medium
S1 0.6592 - 18 December low - Medium
S2 0.6421 - 21 November low - Strong
AUDUSD: fundamental overview

The Australian dollar has extended its run to the highest level since late October. Minutes from the RBA’s December meeting showed officials discussing the possibility of a rate hike in 2026 as inflation and labor market conditions are reviewed, with headline inflation at 3.8% in October still above target and fueling expectations of a February hike. Meanwhile, Australia’s 10-year bond yield stayed elevated around 4.741% with little daily change.

 
Suggested reading

Will Prediction Markets Render Stock Markets Obsolete?, A. Welsch, Barron’s (December 18, 2025)

Biggest Investing Lesson of 2025, What to Look For In 2026, C. Reilly, RiskHedge (December 22, 2025)


Any opinions, news, research, analyses, prices or other information ("information") contained on this Blog, constitutes marketing communication and it has not been prepared in accordance with legal requirements designed to promote the independence of investment research. Further, the information contained within this Blog does not contain (and should not be construed as containing) investment advice or an investment recommendation, or an offer of, or solicitation for, a transaction in any financial instrument. LMAX Group has not verified the accuracy or basis-in-fact of any claim or statement made by any third parties as comments for every Blog entry.

LMAX Group will not accept liability for any loss or damage, including without limitation to, any loss of profit, which may arise directly or indirectly from use of or reliance on such information. No representation or warranty is given as to the accuracy or completeness of the above information. While the produced information was obtained from sources deemed to be reliable, LMAX Group does not provide any guarantees about the reliability of such sources. Consequently any person acting on it does so entirely at his or her own risk. It is not a place to slander, use unacceptable language or to promote LMAX Group or any other FX and CFD provider and any such postings, excessive or unjust comments and attacks will not be allowed and will be removed from the site immediately.

Day Image
23rd December 2025 | view in browser
Markets pivot on widening policy gaps

Global markets head into the new day with central bank divergence firmly in focus, led by an increasingly split Federal Reserve after Governor Miran warned that failing to keep cutting rates in 2025 risks triggering a recession, pushing the dollar lower and reinforcing market expectations for deeper easing than the Fed’s own projections.


Performance chart 30day v. USD (%)
Performance Chart
 
 
Technical & fundamental highlights
EURUSD: technical overview

The Euro outlook remains constructive with higher lows sought out on dips in favor of the next major upside extension targeting the 2021 high at 1.2350. Setbacks should be exceptionally well supported ahead of 1.1400.

EURUSD Chart
R2 1.1919 - 17 September/2025 high -Strong
R1 1.1805 - 16 December high - Medium
S1 1.1703 - 19 December low - Strong
S2 1.1615 - 9 December low - Strong
EURUSD: fundamental overview

The euro remains supported by the ECB’s steady policy stance, rates holding near 2%, and improving eurozone external balances, keeping the currency close to its strongest levels since late September. Market focus now shifts to Germany’s import price data, expected to show easing inflation pressures, and Spain’s GDP and PPI releases, which are forecast to confirm stable growth alongside only moderate producer price inflation.

 
USDJPY: technical overview

There are signs of a meaningful top in place after the market put in a multi-year high in 2024. At this point, rallies should be well capped ahead of 160.00 ahead of a fresh down-leg back towards the 2024 low at 139.58.

USDJPY Chart
R2 157.90 - 20 November/2025 high - Strong
R1 157.00 - Figure - Medium
S1 154.39 - 16 December low - Strong
S2 153.61 - 14 November low - Medium
USDJPY: fundamental overview

The yen has seen some choppy trading triggered by strong intervention warnings from Japan’s finance minister, who stressed the authorities’ freedom to act against speculative moves and noted shared understanding with the US on intervening during excessive volatility. The comments came as Japanese yields surged, with the 10-year JGB hitting a 27-year high near 2.1% on expectations of further BOJ tightening and heavy fiscal spending under a record budget. On the data front, Japan’s November machine tool orders are expected to show solid momentum, with year-on-year growth forecast at around 14%.

 
AUDUSD: technical overview

There are signs of the potential formation of a longer-term base with the market trading down into a meaningful longer-term support zone. Only a monthly close below 0.5500 would give reason for rethink. A monthly close back above 0.7000 will take the big picture pressure off the downside and strengthen case for a bottom.

AUDUSD Chart
R2 0.6707 - 17 September/2025 high - Strong
R1 0.6686 - 10 December high - Medium
S1 0.6592 - 18 December low - Medium
S2 0.6421 - 21 November low - Strong
AUDUSD: fundamental overview

The Australian dollar has been better bid after the RBA minutes highlighted ongoing inflation risks and left the door open to further tightening in 2026, giving policy a mildly hawkish tone despite rates staying on hold. Support also came from steady Chinese rates and improved risk sentiment, though softer commodity prices and weak global demand remain a drag, with Australia’s commodity price index falling sharply year on year. Bond yields remain elevated and markets are increasingly pricing the risk of a rate hike later in the first half of the year.

 
Suggested reading

Scammers, spies and triads: inside cyber-crime’s $15tn global empire, B. Marino, FT (December 18, 2025)

How Credit Is Produced By Lenders And Borrowers, J. Tamny, Forbes (December 21, 2025)


Any opinions, news, research, analyses, prices or other information ("information") contained on this Blog, constitutes marketing communication and it has not been prepared in accordance with legal requirements designed to promote the independence of investment research. Further, the information contained within this Blog does not contain (and should not be construed as containing) investment advice or an investment recommendation, or an offer of, or solicitation for, a transaction in any financial instrument. LMAX Group has not verified the accuracy or basis-in-fact of any claim or statement made by any third parties as comments for every Blog entry.

LMAX Group will not accept liability for any loss or damage, including without limitation to, any loss of profit, which may arise directly or indirectly from use of or reliance on such information. No representation or warranty is given as to the accuracy or completeness of the above information. While the produced information was obtained from sources deemed to be reliable, LMAX Group does not provide any guarantees about the reliability of such sources. Consequently any person acting on it does so entirely at his or her own risk. It is not a place to slander, use unacceptable language or to promote LMAX Group or any other FX and CFD provider and any such postings, excessive or unjust comments and attacks will not be allowed and will be removed from the site immediately.

Day Image
12th December 2025 | view in browser
Policy pivots driving market rotation

Global markets are rapidly repricing as central banks pivot policy in response to slowing growth, with the Fed’s dovish turn anchoring expectations while shifting investor focus toward labor, inflation data, and rotation into more rate-sensitive sectors.


Performance chart 30day v. USD (%)
Performance Chart
 
 
Technical & fundamental highlights
EURUSD: technical overview

The Euro outlook remains constructive with higher lows sought out on dips in favor of the next major upside extension targeting the 2021 high at 1.2350. Setbacks should be exceptionally well supported ahead of 1.1400.

EURUSD Chart
R2 1.1919 - 17 September/2025 high -Strong
R1 1.1779 - 1 October high - Medium
S1 1.1615 - 9 December low - Strong
S2 1.1469 - 5 November low - Strong
EURUSD: fundamental overview

EURUSD is hovering near two-month highs, supported by growing focus on policy divergence between a politically pressured Fed and a more insulated ECB. US political attacks on the Fed contrast with ECB signals that rate cuts may be over, though markets may be prematurely testing the idea of hikes in 2026, as many economists still see downside risks to euro-area growth from deflation, trade tensions, and a stronger euro. China’s rising trade surplus with Europe and the EU’s increasingly protectionist response add medium-term headwinds, but near-term FX impact remains limited unless tensions escalate. Optimism around a potential Ukraine ceasefire and bullish forecasts from some major US banks also offer mild near-term support for the euro, though longer-term gains hinge on policy credibility and geopolitical outcomes.

 
USDJPY: technical overview

There are signs of a meaningful top in place after the market put in a multi-year high in 2024. At this point, rallies should be well capped ahead of 160.00 ahead of a fresh down-leg back towards the 2024 low at 139.58.

USDJPY Chart
R2 158.90 - 20 November/2025 high - Strong
R1 156.96 - 9 December high - Medium
S1 154.34 - 5 December low - Strong
S2 153.61 - 14 November low - Medium
USDJPY: fundamental overview

Markets are entering next week expecting the BOJ to deliver a rate hike, and failure to do so would likely trigger sharp yen weakness given that the move is already fully priced in. While investors remain skeptical that rates can rise much beyond 0.75%—seeing policymakers as trying to maintain loose fiscal policy, negative real rates, and a strong yen, an unsustainable mix—the yen has continued to weaken, ignoring official jawboning. Former BOJ official Hideo Hayakawa expects rates to rise gradually toward a 1.5% terminal level by 2027, arguing the BOJ is behind the curve on inflation, especially given expansionary fiscal policy. Still, the BOJ may struggle to signal a very hawkish path due to weak GDP growth and concerns over higher bond yields amid Japan’s fragile fiscal position.

 
AUDUSD: technical overview

There are signs of the potential formation of a longer-term base with the market trading down into a meaningful longer-term support zone. Only a monthly close below 0.5500 would give reason for rethink. A monthly close back above 0.7000 will take the big picture pressure off the downside and strengthen case for a bottom.

AUDUSD Chart
R2 0.6707 - 17 September/2025 high - Strong
R1 0.6686 - 10 December high - Medium
S1 0.6520 - 28 November low - Medium
S2 0.6421 - 21 November low - Strong
AUDUSD: fundamental overview

Australia’s November labor report dampened AUD optimism, with employment falling by 21,300 instead of rising as expected, reversing October’s gains. While the unemployment rate held at a slightly better-than-forecast 4.3%, this was largely due to a lower participation rate, raising concerns that joblessness could increase as labor demand softens. Some economists argue markets have over-priced future rate hikes, warning that if inflation eases and economic conditions weaken into 2026, rate cuts could return. Although the RBA still sees the labor market as tight, employment data is volatile and markets are likely to focus more on upcoming CPI figures, with investors continuing to buy dips while expecting policy divergence between the Fed and RBA to persist.

 
Suggested reading

How Divided Is the Fed? 6 Soft Dissents Says ‘Very’ S. Hansen, Morningstar (December 10, 2025)

Why the Stock Market Is Likely To Move Higher In 2026, M. Hulbert, Marketwatch (December 9, 2025)


Any opinions, news, research, analyses, prices or other information ("information") contained on this Blog, constitutes marketing communication and it has not been prepared in accordance with legal requirements designed to promote the independence of investment research. Further, the information contained within this Blog does not contain (and should not be construed as containing) investment advice or an investment recommendation, or an offer of, or solicitation for, a transaction in any financial instrument. LMAX Group has not verified the accuracy or basis-in-fact of any claim or statement made by any third parties as comments for every Blog entry.

LMAX Group will not accept liability for any loss or damage, including without limitation to, any loss of profit, which may arise directly or indirectly from use of or reliance on such information. No representation or warranty is given as to the accuracy or completeness of the above information. While the produced information was obtained from sources deemed to be reliable, LMAX Group does not provide any guarantees about the reliability of such sources. Consequently any person acting on it does so entirely at his or her own risk. It is not a place to slander, use unacceptable language or to promote LMAX Group or any other FX and CFD provider and any such postings, excessive or unjust comments and attacks will not be allowed and will be removed from the site immediately.

Day Image
11th December 2025 | view in browser
New day, new divergences

Global markets are navigating a sharply diverging policy landscape, with the Fed signaling its easing cycle is nearly finished just as the ECB and BoJ turn more hawkish, driving major currency moves and shifting rate expectations.


Performance chart 30day v. USD (%)
Performance Chart
 
 
Technical & fundamental highlights
EURUSD: technical overview

The Euro outlook remains constructive with higher lows sought out on dips in favor of the next major upside extension targeting the 2021 high at 1.2350. Setbacks should be exceptionally well supported ahead of 1.1300.

EURUSD Chart
R2 1.1729 - 17 October high -Strong
R1 1.1708 - 11 December high - Medium
S1 1.1547 - 26 November low - Medium
S2 1.1469 - 5 November low - Strong
EURUSD: fundamental overview

The ECB may lift its eurozone growth forecasts at next week’s final policy meeting, with President Christine Lagarde noting the economy has been outperforming earlier expectations. Markets still expect rates to stay at 2%, though recent hawkish comments—especially from Isabel Schnabel—have led traders to scale back expectations for 2026 rate cuts, even if many economists view pricing in hikes as premature given potential deflationary forces. The discussion comes amid broader debates about diverging Fed–ECB policy paths and differing exposure to political pressure. Adding to geopolitical tension, former EU diplomat Josep Borrell criticized the new U.S. National Security Strategy as a political “declaration of war,” urging Europe to recognize the increasingly adversarial stance.

 
USDJPY: technical overview

There are signs of a meaningful top in place after the market put in a multi-year high in 2024. At this point, rallies should be well capped ahead of 160.00 ahead of a fresh down-leg back towards the 2024 low at 139.58.

USDJPY Chart
R2 158.90 - 20 November/2025 high - Strong
R1 156.96 - 9 December high - Medium
S1 154.34 - 5 December low - Strong
S2 153.61 - 14 November low - Medium
USDJPY: fundamental overview

USDJPY has slipped after the Fed’s rate cut as markets focused more on Powell’s caution about labor-market risks than on the Fed’s stated “high hurdle” for further easing. While the Fed still projects one more cut next year, markets expect two, and attention now turns to the BOJ, where a hike next week is widely priced in—any delay could trigger sharp yen weakness. Yet one Japanese bank notes that lingering doubts about the BOJ lifting rates toward 1% or higher continue to cap yen strength, with investors waiting for a clearer hawkish signal. Former BOJ official Hayakawa expects a hike to 0.75% in December and gradual tightening toward a 1.5% terminal rate, especially as Japan’s large fiscal package raises inflation risks. A key watch is whether the BOJ revises its estimate of the neutral rate, which would shape how restrictive future policy could become.

 
AUDUSD: technical overview

There are signs of the potential formation of a longer-term base with the market trading down into a meaningful longer-term support zone. Only a monthly close below 0.5500 would give reason for rethink. A monthly close back above 0.7000 will take the big picture pressure off the downside and strengthen case for a bottom.

AUDUSD Chart
R2 0.6707 - 17 September/2025 high - Strong
R1 0.6686 - 10 December high - Medium
S1 0.6520 - 28 November low - Medium
S2 0.6421 - 21 November low - Strong
AUDUSD: fundamental overview

Australia’s November jobs report softened AUD sentiment as employment unexpectedly fell by 21,300, reversing October’s temporary strength. The jobless rate held at 4.3%, slightly better than forecasts, but largely due to a dip in participation. Economists caution that markets may have been too quick to price in 2026 rate hikes, noting risks of rising unemployment if labor demand weakens while population growth stays strong—potentially paving the way for rate cuts if inflation cools. Still, monthly employment data is volatile; the more influential Q4 CPI due January 28 is expected to show inflation staying uncomfortably high. Until then, markets may continue buying AUD on dips, anticipating policy divergence between the RBA and the Fed.

 
Suggested reading

3 Contrarian Investment Ideas for 2026, D. Lefkovitz, Morningstar (December 10, 2025)

Is It a Bubble? Has AI Enthusiasm Become Irrational?, H. Marks, Oaktree Capital (December 9, 2025)


Any opinions, news, research, analyses, prices or other information ("information") contained on this Blog, constitutes marketing communication and it has not been prepared in accordance with legal requirements designed to promote the independence of investment research. Further, the information contained within this Blog does not contain (and should not be construed as containing) investment advice or an investment recommendation, or an offer of, or solicitation for, a transaction in any financial instrument. LMAX Group has not verified the accuracy or basis-in-fact of any claim or statement made by any third parties as comments for every Blog entry.

LMAX Group will not accept liability for any loss or damage, including without limitation to, any loss of profit, which may arise directly or indirectly from use of or reliance on such information. No representation or warranty is given as to the accuracy or completeness of the above information. While the produced information was obtained from sources deemed to be reliable, LMAX Group does not provide any guarantees about the reliability of such sources. Consequently any person acting on it does so entirely at his or her own risk. It is not a place to slander, use unacceptable language or to promote LMAX Group or any other FX and CFD provider and any such postings, excessive or unjust comments and attacks will not be allowed and will be removed from the site immediately.

Day Image
10th December 2025 | view in browser
Global macro at an inflection point

Global macro is entering a clear inflection point. In the US, the Fed is widely expected to deliver what may be its last 25bp cut for some time, but deeply mixed data and a sharply divided committee mean forward guidance will turn more cautious, with Powell forced to balance slowing labor momentum against stubborn inflation risks.


Performance chart 30day v. USD (%)
Performance Chart
 
 
Technical & fundamental highlights
EURUSD: technical overview

The Euro outlook remains constructive with higher lows sought out on dips in favor of the next major upside extension targeting the 2021 high at 1.2350. Setbacks should be exceptionally well supported ahead of 1.1300.

EURUSD Chart
R2 1.1729 - 17 October high -Strong
R1 1.1682 - 4 December high - Medium
S1 1.1547 - 26 November low - Medium
S2 1.1469 - 5 November low - Strong
EURUSD: fundamental overview

Fabio Panetta says the global monetary system is likely to become more multi-polar, with several major currencies alongside a still-dominant dollar, offering diversification but also higher risks if policy coordination weakens. Europe is trying to strengthen the euro’s global role through better payments, liquidity tools, digital finance, and deeper capital markets, but markets are currently leaning hawkish on ECB policy after comments from Isabel Schnabel, largely pricing out rate cuts in 2026. Even so, some ECB officials still see scope for easing if inflation undershoots or growth weakens, especially as higher US tariffs, a stronger euro, and cheaper Chinese imports could prove disinflationary for the euro area. Geopolitical tensions add further pressure, with President Trump’s comments on Ukraine fueling fears of weaker US–EU coordination, which typically weighs on the euro by increasing risk premiums on European assets.

 
USDJPY: technical overview

There are signs of a meaningful top in place after the market put in a multi-year high in 2024. At this point, rallies should be well capped ahead of 160.00 ahead of a fresh down-leg back towards the 2024 low at 139.58.

USDJPY Chart
R2 158.90 - 20 November/2025 high - Strong
R1 157.00 - 28 Figure - Medium
S1 154.34 - 5 December low - Strong
S2 153.61 - 14 November low - Medium
USDJPY: fundamental overview

Governor Ueda signaled that the BOJ is increasingly confident Japan is nearing sustainable 2% inflation, reinforcing expectations of a rate hike to 0.75% at the December 18–19 meeting and a gradual path toward policy normalization. Despite this, the yen has weakened, with USDJPY rebounding from recent lows as markets focus on the upcoming FOMC meeting and the risk that a Fed rate cut comes with hawkish guidance. One Japanese bank notes that ongoing skepticism over whether the BOJ will raise rates to 1% or higher is limiting yen strength, as investors remain reluctant to take large long yen positions without a clearer, more explicitly hawkish signal from the BOJ.

 
AUDUSD: technical overview

There are signs of the potential formation of a longer-term base with the market trading down into a meaningful longer-term support zone. Only a monthly close below 0.5500 would give reason for rethink. A monthly close back above 0.7000 will take the big picture pressure off the downside and strengthen case for a bottom.

AUDUSD Chart
R2 0.6707 - 17 September/2025 high - Strong
R1 0.6655 - 9 December high - Medium
S1 0.6520 - 28 November low - Medium
S2 0.6421 - 21 November low - Strong
AUDUSD: fundamental overview

The RBA left the cash rate unchanged at 3.60% as expected, but its statement and Governor Bullock’s comments signaled a mildly hawkish stance. By highlighting that inflation risks have tilted upward and stressing the Board’s willingness to act if needed, the RBA pushed back against expectations for early rate cuts and kept the door open to further hikes. Bullock reinforced this tone by saying cuts are not foreseeable and that conditions for future hikes were discussed, which supported the Australian dollar; going forward, the AUD should remain resilient, with a hawkish Fed also helping, while a surprise dovish Fed move could spark sharper upside through improved global risk sentiment.

 
Suggested reading

Quiet Millionaires Reveal the Source of Their Wealth, A. Bennett, New York Post (December 8, 2025)

What Matters to Investors Going Into ’26, C. Rielly, RiskHedge(December 8, 2025)


Any opinions, news, research, analyses, prices or other information ("information") contained on this Blog, constitutes marketing communication and it has not been prepared in accordance with legal requirements designed to promote the independence of investment research. Further, the information contained within this Blog does not contain (and should not be construed as containing) investment advice or an investment recommendation, or an offer of, or solicitation for, a transaction in any financial instrument. LMAX Group has not verified the accuracy or basis-in-fact of any claim or statement made by any third parties as comments for every Blog entry.

LMAX Group will not accept liability for any loss or damage, including without limitation to, any loss of profit, which may arise directly or indirectly from use of or reliance on such information. No representation or warranty is given as to the accuracy or completeness of the above information. While the produced information was obtained from sources deemed to be reliable, LMAX Group does not provide any guarantees about the reliability of such sources. Consequently any person acting on it does so entirely at his or her own risk. It is not a place to slander, use unacceptable language or to promote LMAX Group or any other FX and CFD provider and any such postings, excessive or unjust comments and attacks will not be allowed and will be removed from the site immediately.

Day Image
9th December 2025 | view in browser
Hawkish cuts and the end of easing

Global markets are bracing for a turning point as central banks lean decisively less dovish. In the US, a widely expected Fed rate cut this week is likely to be framed hawkish, with Chair Powell signaling a long pause amid sticky global inflation and rising yields, even as political uncertainty grows around Powell’s eventual successor.


Performance chart 30day v. USD (%)
Performance Chart
 
 
Technical & fundamental highlights
EURUSD: technical overview

The Euro outlook remains constructive with higher lows sought out on dips in favor of the next major upside extension targeting the 2021 high at 1.2350. Setbacks should be exceptionally well supported ahead of 1.1300.

EURUSD Chart
R2 1.1729 - 17 October high -Strong
R1 1.1682 - 4 December high - Medium
S1 1.1547 - 26 November low - Medium
S2 1.1469 - 5 November low - Strong
EURUSD: fundamental overview

Germany’s October data point to tentative signs of stabilization rather than a strong recovery: industrial production rebounded by a much stronger-than-expected 1.8% month on month, supported by construction and capital goods, following a second consecutive rise in manufacturing orders. While this suggests German industry may be bottoming out, momentum still looks sideways. Planned government measures—potentially up to €1 trillion in investment and lower energy costs—could support a cyclical upswing. At the same time, ECB’s Isabel Schnabel signaled that rates are likely at their floor for now, noting resilient euro-area growth, sticky inflation, and possible upward revisions to ECB growth forecasts, while warning that disinflation has recently stalled and bears close watching.

 
USDJPY: technical overview

There are signs of a meaningful top in place after the market put in a multi-year high in 2024. At this point, rallies should be well capped ahead of 160.00 ahead of a fresh down-leg back towards the 2024 low at 139.58.

USDJPY Chart
R2 158.90 - 20 November/2025 high - Strong
R1 156.59 - 28 November high - Medium
S1 154.00 - Figure - Medium
S2 153.61 - 14 November low - Strong
USDJPY: fundamental overview

USDJPY rebounded after reports of a major earthquake in northern Japan, as investors cautiously moved into the dollar while assessing whether the damage could delay the BOJ’s expected policy tightening. While past earthquakes have sometimes strengthened the yen through repatriation flows, markets currently assume damage is limited and still see a BOJ rate hike in December as the base case, albeit with risks of a longer pause given weak Q3 GDP and heightened caution after the quake. Looking ahead, further yen strength likely depends more on aggressive Fed rate cuts, as Japan’s combination of loose fiscal policy, cautious monetary tightening, and weak economic data—reinforced by disappointing November Eco Watchers survey results—continues to undermine confidence in a sustainably stronger yen.

 
AUDUSD: technical overview

There are signs of the potential formation of a longer-term base with the market trading down into a meaningful longer-term support zone. Only a monthly close below 0.5500 would give reason for rethink. A monthly close back above 0.7000 will take the big picture pressure off the downside and strengthen case for a bottom.

AUDUSD Chart
R2 0.6707 - 17 September/2025 high - Strong
R1 0.6660 - 18 September high - Medium
S1 0.6520 - 28 November low - Medium
S2 0.6421 - 21 November low - Strong
AUDUSD: fundamental overview

The RBA kept the cash rate unchanged at 3.60%, but its December statement struck a mildly hawkish tone. By noting that inflation risks have tilted to the upside, private demand is recovering, and that it will do whatever is necessary to ensure price stability, the Bank pushed back against expectations for early rate cuts and left the door open to further tightening if needed. Markets appeared to have hoped for a softer message, which explains the muted initial AUD reaction. Separately, November NAB survey data showed business confidence easing to its lowest level since April while conditions remained solid, suggesting a cooling in momentum rather than a sharp downturn, with future risks depending on whether confidence and forward orders weaken further.

 
Suggested reading

Wall Street’s 2026 Outlook For Stocks, S. Ro, TKer (December 7, 2025)

There’s An Inevitable Quality To the FOMC Meeting, R. Moody, Regions Bank (December 8, 2025)


Any opinions, news, research, analyses, prices or other information ("information") contained on this Blog, constitutes marketing communication and it has not been prepared in accordance with legal requirements designed to promote the independence of investment research. Further, the information contained within this Blog does not contain (and should not be construed as containing) investment advice or an investment recommendation, or an offer of, or solicitation for, a transaction in any financial instrument. LMAX Group has not verified the accuracy or basis-in-fact of any claim or statement made by any third parties as comments for every Blog entry.

LMAX Group will not accept liability for any loss or damage, including without limitation to, any loss of profit, which may arise directly or indirectly from use of or reliance on such information. No representation or warranty is given as to the accuracy or completeness of the above information. While the produced information was obtained from sources deemed to be reliable, LMAX Group does not provide any guarantees about the reliability of such sources. Consequently any person acting on it does so entirely at his or her own risk. It is not a place to slander, use unacceptable language or to promote LMAX Group or any other FX and CFD provider and any such postings, excessive or unjust comments and attacks will not be allowed and will be removed from the site immediately.