Day Image
10th November 2025 | view in browser
Fed cut bets grow after dollar’s shaky week

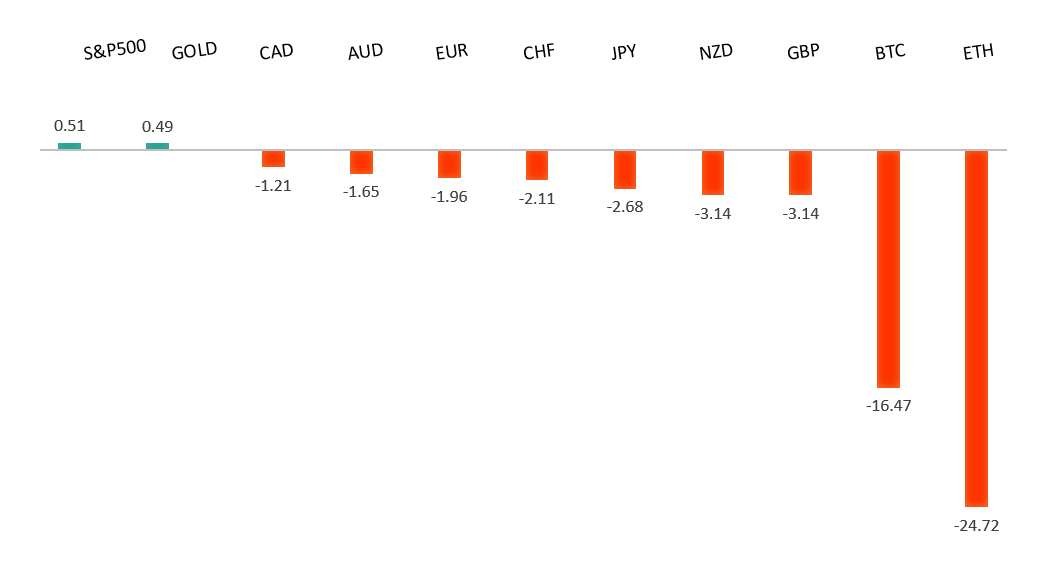
The dollar enters Monday on the defensive after a sharp retreat late last week, weighed down by soft U.S. labor data, political gridlock, and a sharp selloff in AI-linked stocks that triggered a broad risk-off tone.


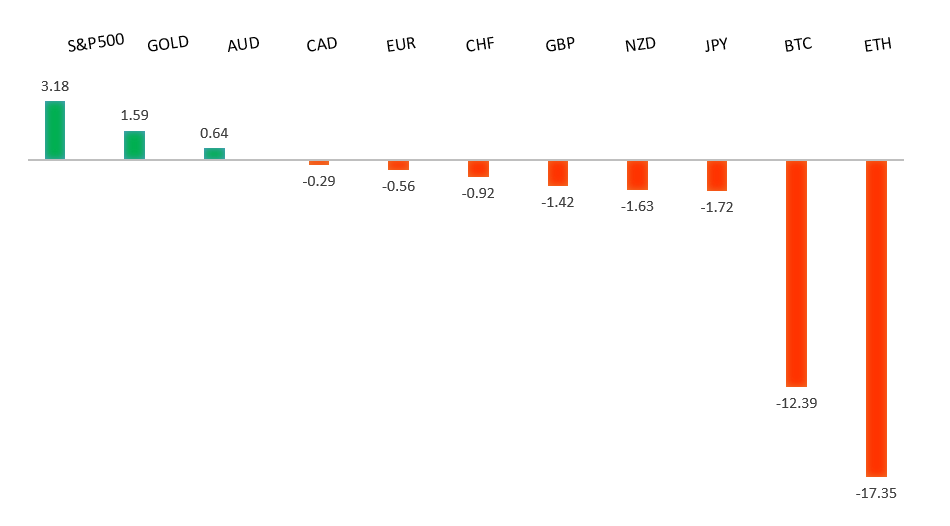
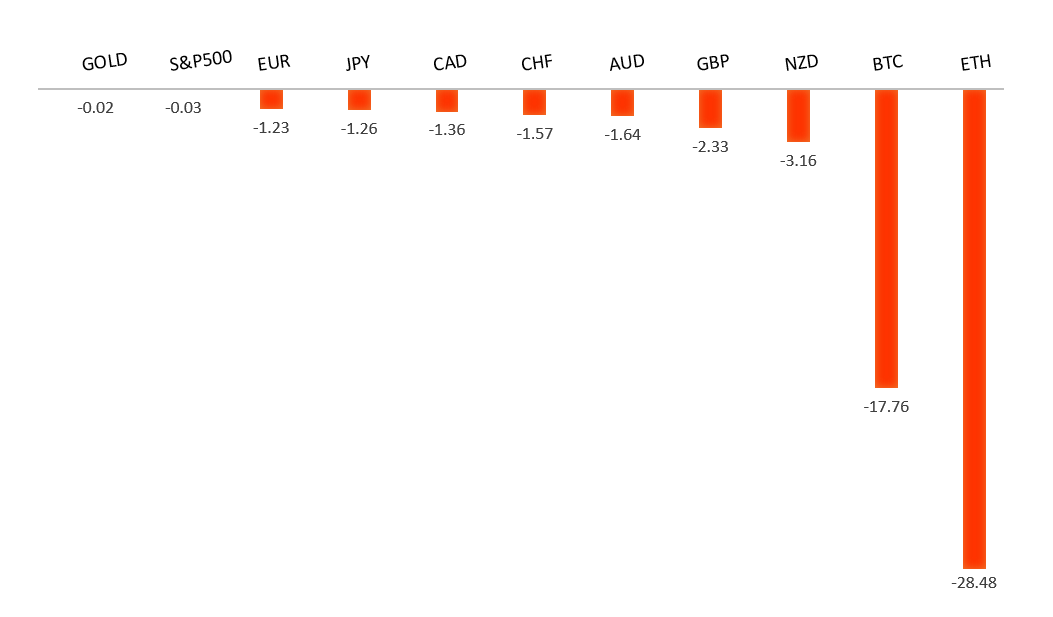
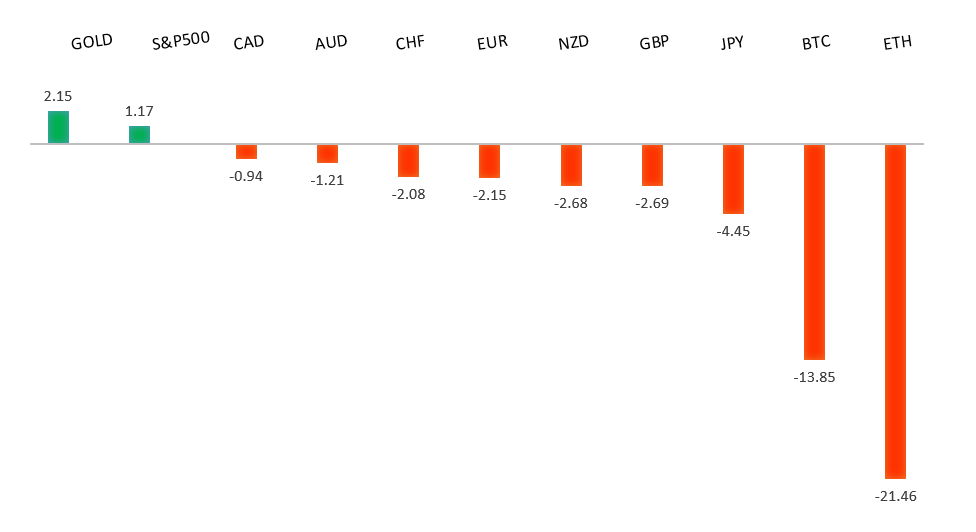
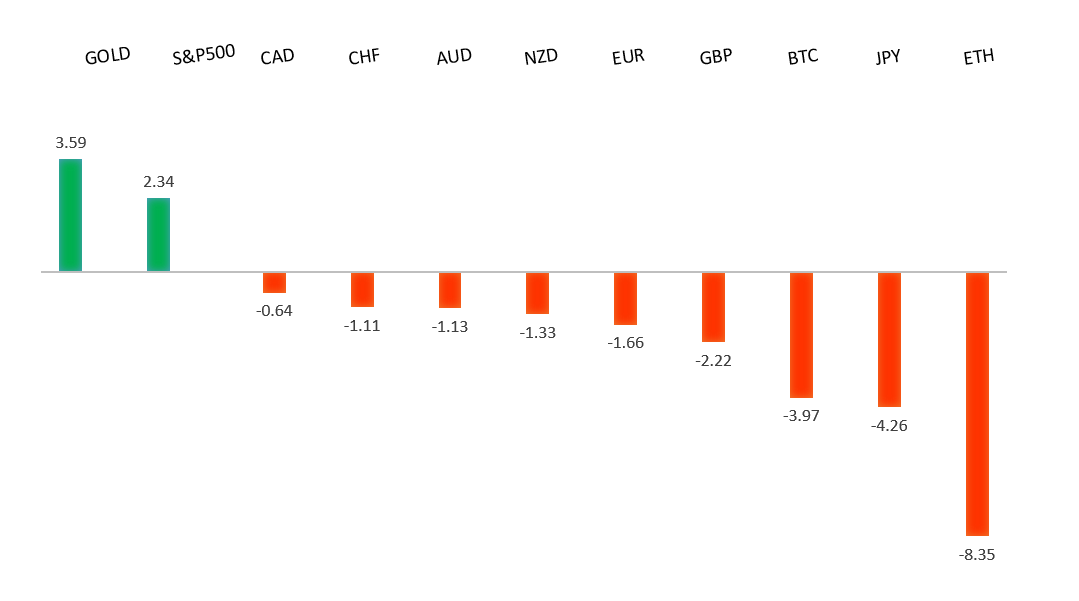
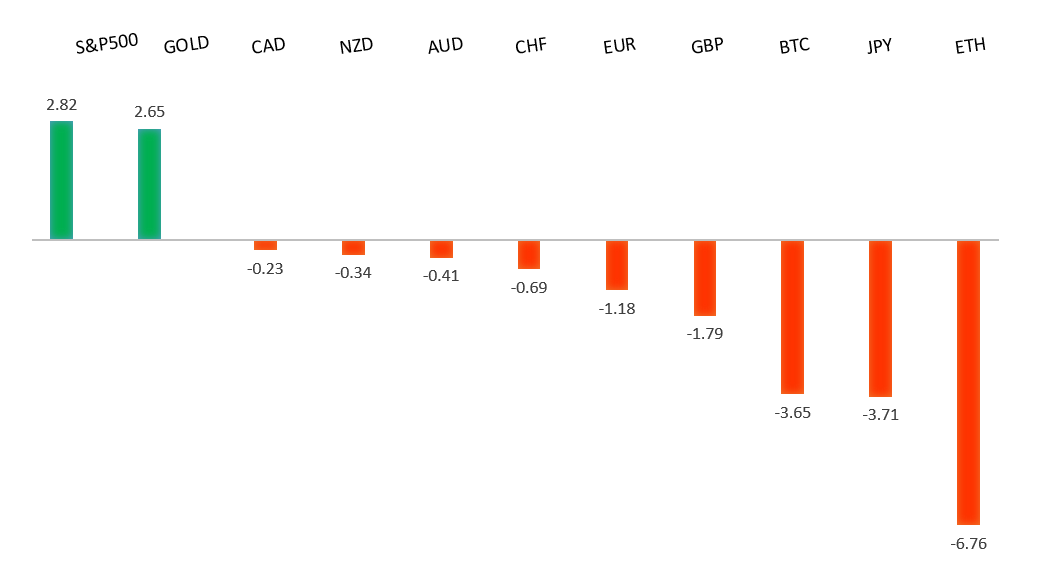
Performance chart 30day v. USD (%)
Performance Chart
 
 
Technical & fundamental highlights
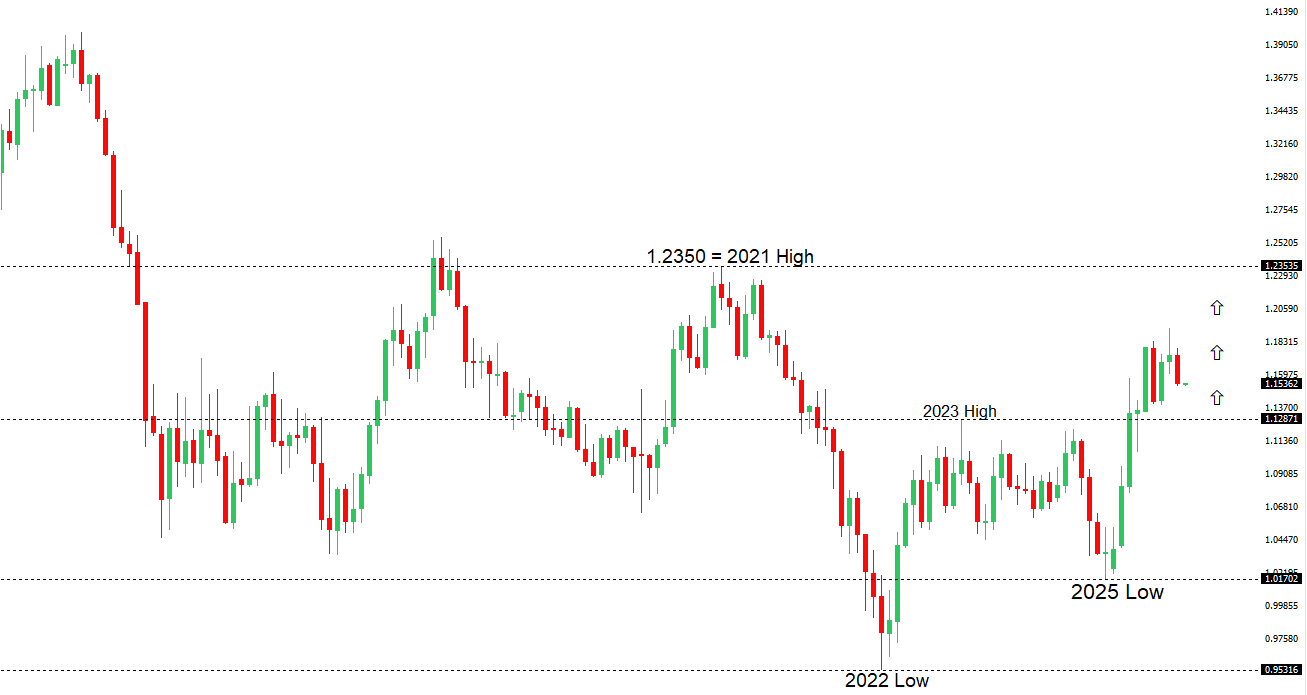
EURUSD: technical overview

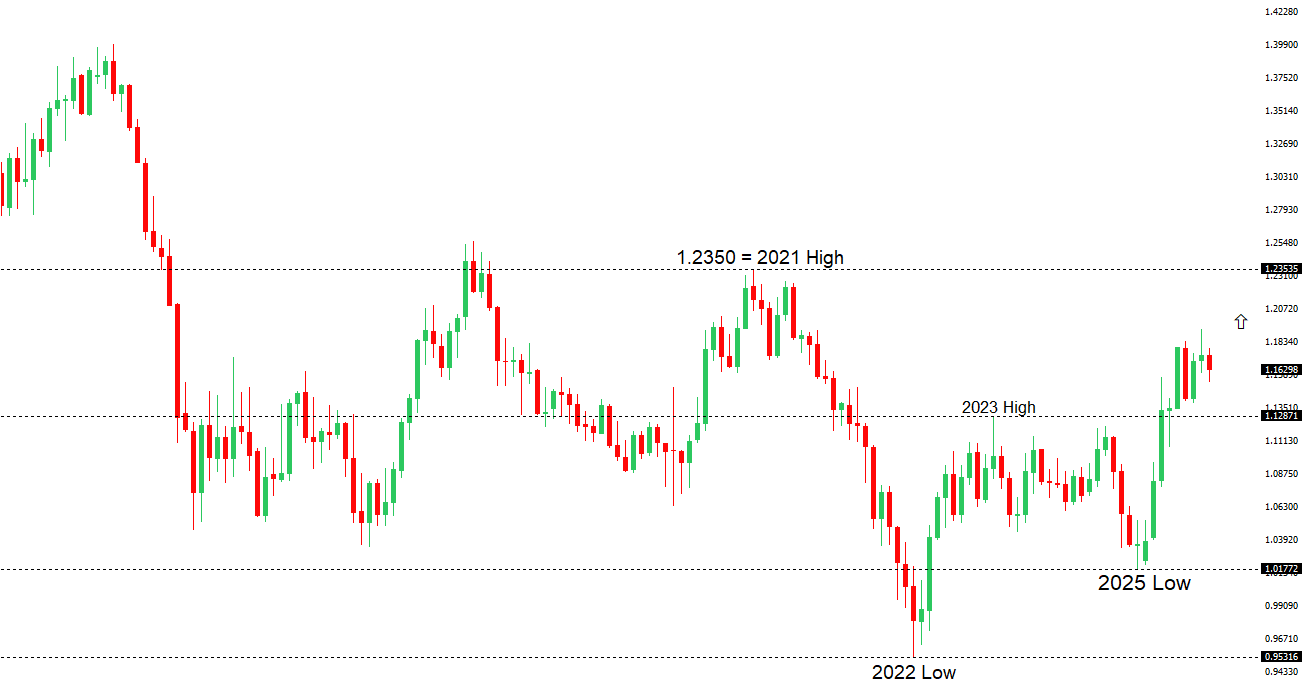
The Euro outlook remains constructive with higher lows sought out on dips in favor of the next major upside extension targeting the 2021 high at 1.2350. Setbacks should be exceptionally well supported ahead of 1.1300.

EURUSD Chart
R2 1.1729 - 17 October high -Strong
R1 1.1669 - 28 October high - Medium
S1 1.1469 - 5 November low - Medium
S2 1.1392 - 1 August low - Strong
EURUSD: fundamental overview

ECB Vice President Luis de Guindos and Board member Frank Elderson highlighted a more balanced outlook for eurozone growth, with inflation easing (especially in services), fewer downside risks due to easing trade tensions, a Middle East ceasefire, and potential boosts from rising military spending. Policymakers are pausing after eight quarter-point rate cuts, holding the deposit rate at 2% amid stable inflation near target and resilient growth despite U.S. tariffs. One major bank sees a positive macro environment and expects the ECB to keep rates steady until at least June 2026, while the Fed begins cuts, forecasting the euro to strengthen to $1.20 by Q4 2025 and $1.26 by Q3 2026. Key upcoming data includes Germany’s ZEW sentiment (Nov 11), Eurozone Sentix Investor Confidence (forecast -4.0 vs prior -5.4, signaling cautious recovery), Q3 GDP, employment, industrial production, and trade balance, which could lift the euro if upbeat.

 
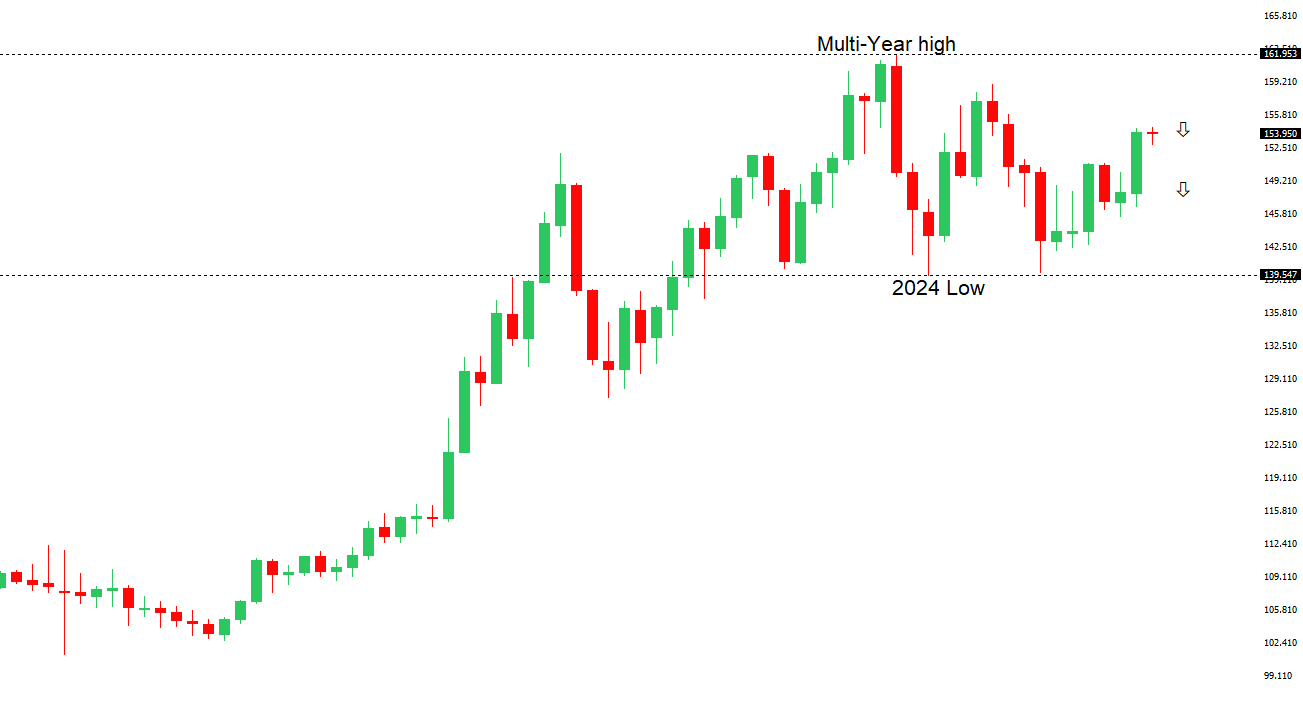
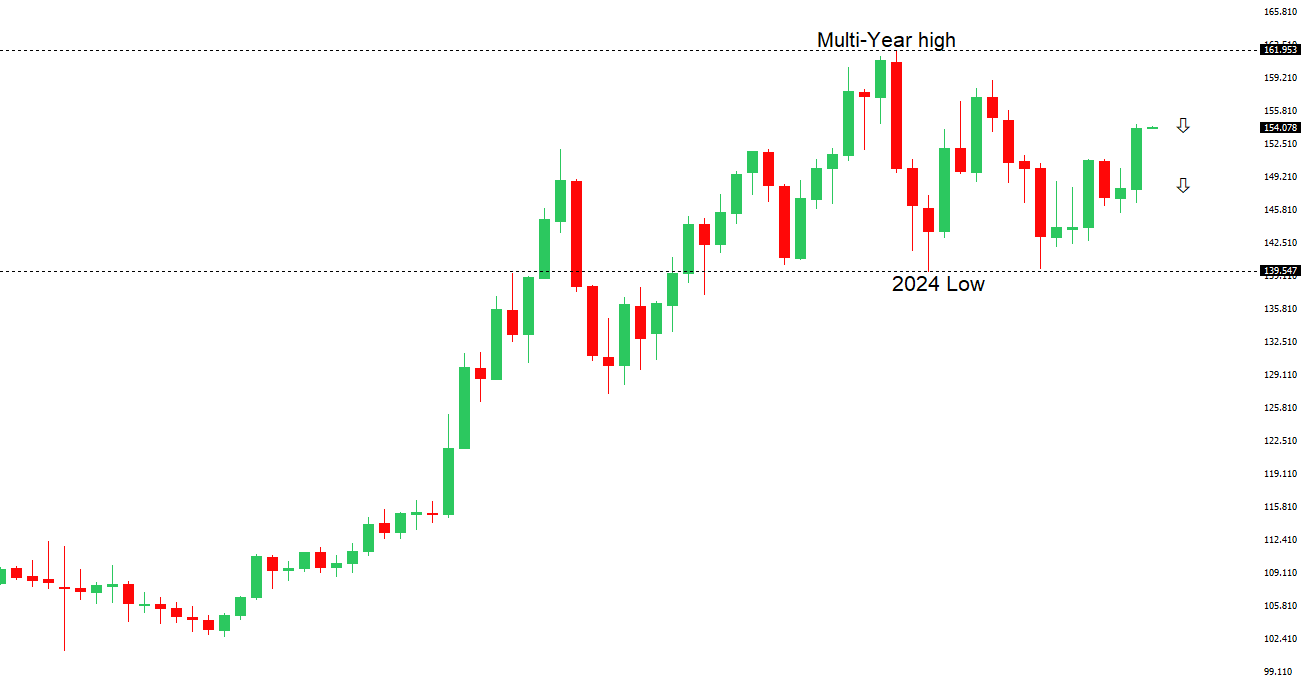
USDJPY: technical overview

There are signs of a meaningful top in place after the market put in a multi-year high in 2024. At this point, the door is now open for a deeper setback below the 2024 low at 139.58, exposing a retest of the 2023 low. Rallies should be well capped below 155.00.

USDJPY Chart
R2 154.80 - 12 February high - Strong
R1 154.48 - 4 November high - Medium
S1 152.82 - 7 November low - Medium
S2 151.54 - 29 October low - Strong
USDJPY: fundamental overview

Last week, the yen gained from a dollar sell-off. PM Sanae Takaichi’s shift to multi-year budgeting, reflationist appointments, and a potential ¥15–20 trillion stimulus have raised expectations of looser fiscal policy and prolonged BOJ accommodation, widening the U.S.-Japan yield gap and pressuring the yen. However, the BOJ’s October meeting summary and board member Junko Nakagawa’s speech today signaled readiness for a rate hike amid improving conditions, reduced uncertainty, and focus on wages and global risks—though a sustained yen rally likely needs aggressive Fed cuts beyond a one-off BOJ move. Key data this week: September current account, October bank lending, preliminary machine tool orders, and PPI.

 
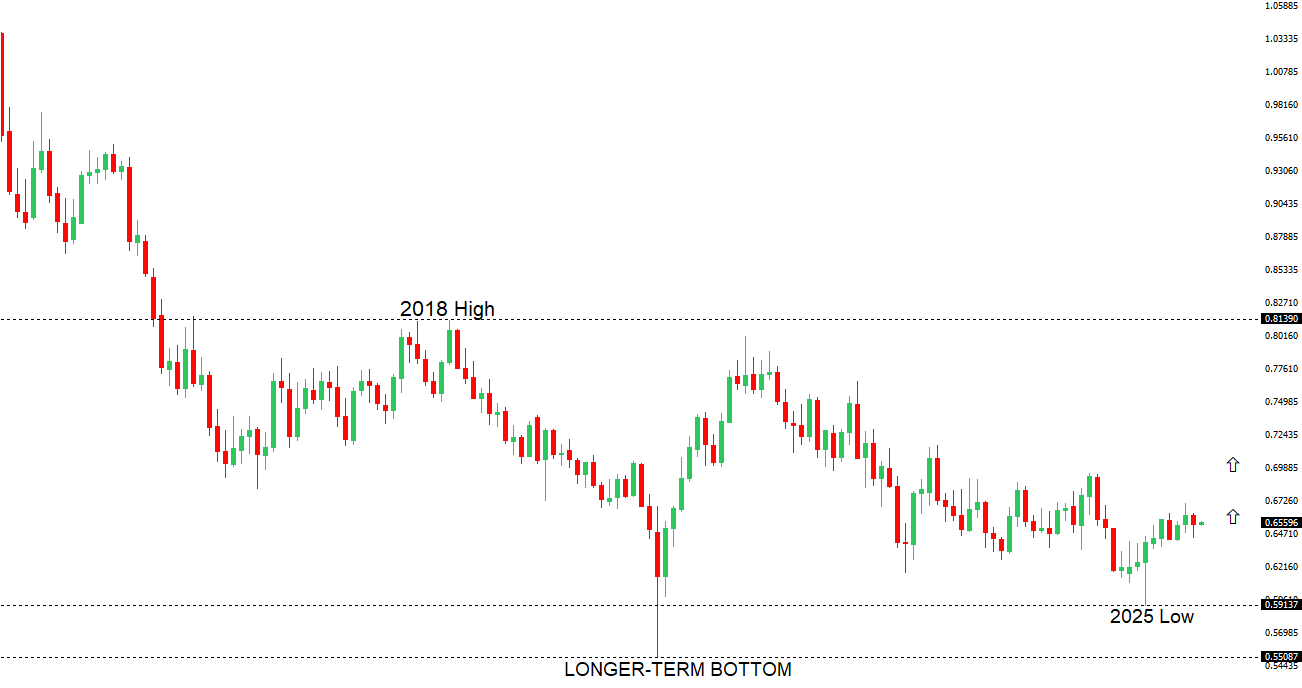
AUDUSD: technical overview

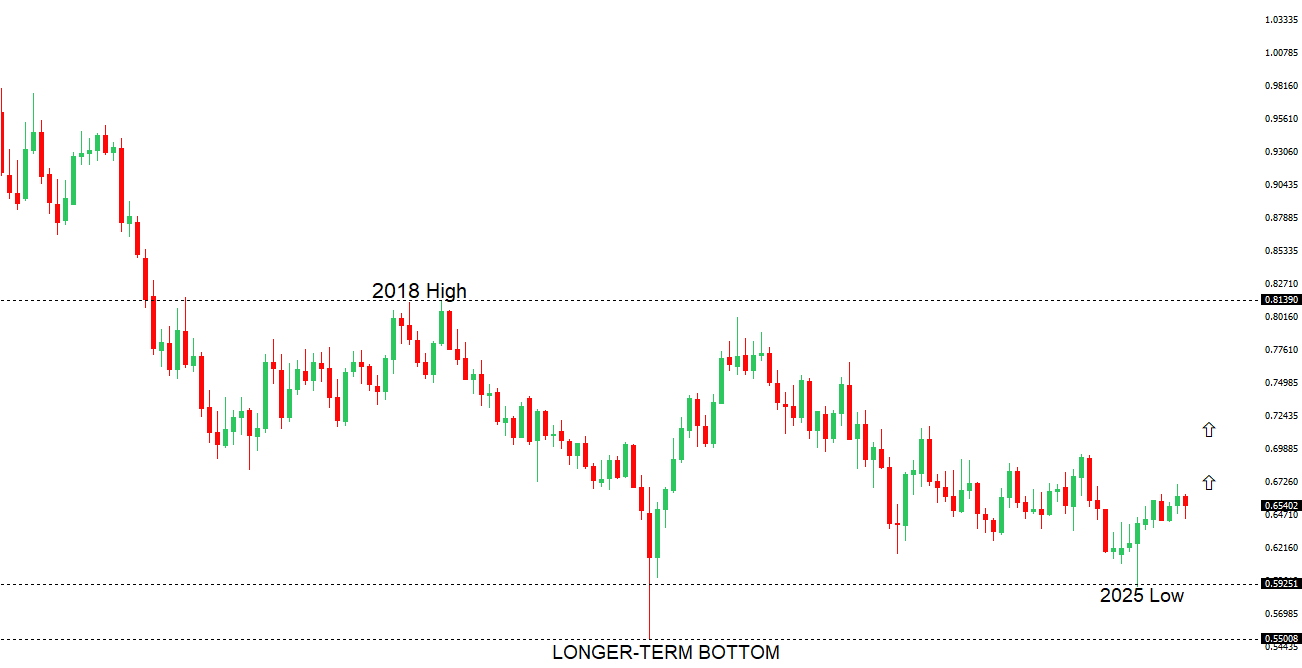
There are signs of the potential formation of a longer-term base with the market trading down into a meaningful longer-term support zone. Only a monthly close below 0.5500 would give reason for rethink. A monthly close back above 0.7000 will take the big picture pressure off the downside and strengthen case for a bottom.

AUDUSD Chart
R2 0.6629 - 1 October high - Strong
R1 0.6618 - 29 October high - Medium
S1 0.6458 - 5 November low - Medium
S1 0.6440 - 14 October low - Strong
AUDUSD: fundamental overview

The RBA’s hold at 3.6% with no cuts until mid-2026, alongside Australia’s stronger GDP outlook (1.8% in 2025, rising to 2.3% by 2027) versus the US, supports AUD appreciation, bolstered by a tight labor market, rising assets, and sustained commodity gains—despite vulnerability to AI-driven risk-off moves. With inflation above target until mid-2026, markets expect only mild RBA easing to 3.4% by late 2026 versus sharper Fed cuts to ~3%; positioning has improved as shorts unwind, with AUD ~8% undervalued (fair value 0.71 vs. ~0.65) and far below historical norms. Positive China signals—bottoming CPI and PBOC’s stable yuan policy—add support, favoring AUDUSD holding up unless risk aversion deepens. Key data this week: consumer and business confidence, home loans, and jobs.

 
Suggested reading

Cockroaches in the Coal Mine, H. Marx, Oaktree Capital (November 6, 2025)

Should You Buy At All Time Highs?, N. Maggiulli, Of Dollars & Data (November 4, 2025)


Any opinions, news, research, analyses, prices or other information ("information") contained on this Blog, constitutes marketing communication and it has not been prepared in accordance with legal requirements designed to promote the independence of investment research. Further, the information contained within this Blog does not contain (and should not be construed as containing) investment advice or an investment recommendation, or an offer of, or solicitation for, a transaction in any financial instrument. LMAX Group has not verified the accuracy or basis-in-fact of any claim or statement made by any third parties as comments for every Blog entry.

LMAX Group will not accept liability for any loss or damage, including without limitation to, any loss of profit, which may arise directly or indirectly from use of or reliance on such information. No representation or warranty is given as to the accuracy or completeness of the above information. While the produced information was obtained from sources deemed to be reliable, LMAX Group does not provide any guarantees about the reliability of such sources. Consequently any person acting on it does so entirely at his or her own risk. It is not a place to slander, use unacceptable language or to promote LMAX Group or any other FX and CFD provider and any such postings, excessive or unjust comments and attacks will not be allowed and will be removed from the site immediately.

Day Image
7th November 2025 | view in browser
Yield differentials flip the script

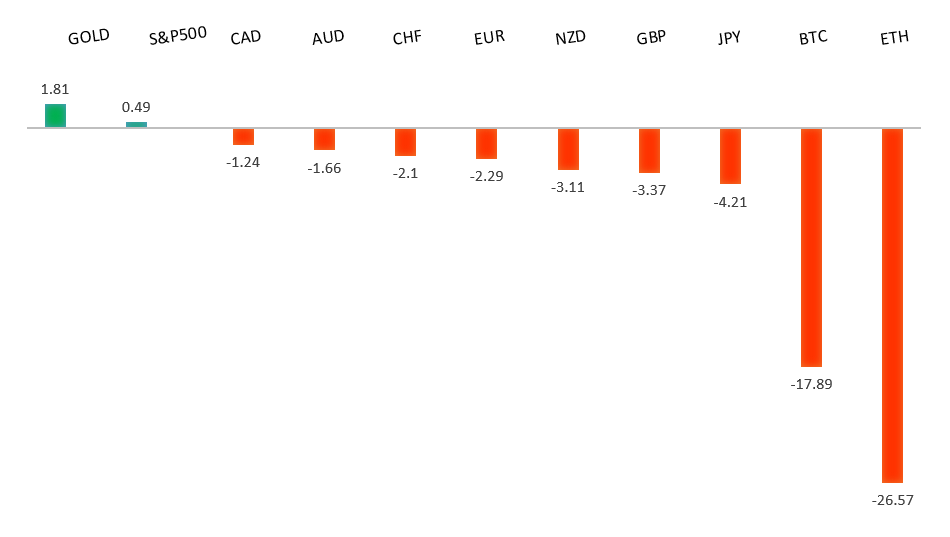
The ongoing US government shutdown continues to block official jobs data, leaving markets focused on private signals: October’s Challenger report revealed 153,000 layoffs, nearly triple last year’s level and the highest for the month since 2003.


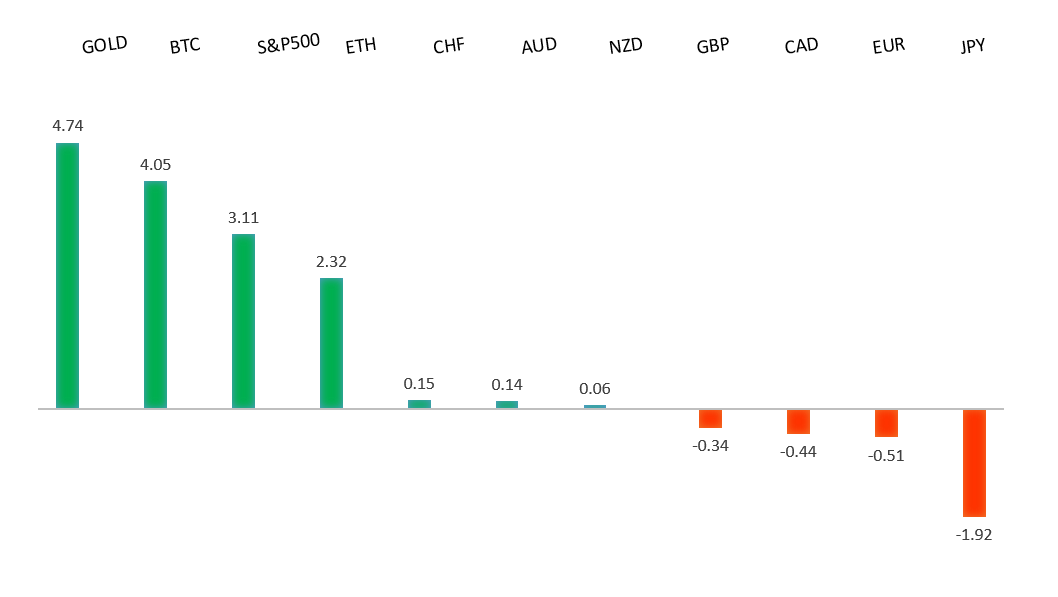
Performance chart 30day v. USD (%)
Performance Chart
 
 
Technical & fundamental highlights
EURUSD: technical overview

The Euro outlook remains constructive with higher lows sought out on dips in favor of the next major upside extension targeting the 2021 high at 1.2350. Setbacks should be exceptionally well supported ahead of 1.1300.

EURUSD Chart
R2 1.1729 - 17 October high -Strong
R1 1.1669 - 28 October high - Medium
S1 1.1469 - 5 November low - Medium
S2 1.1392 - 1 August low - Strong
EURUSD: fundamental overview

Eurozone retail sales dipped 0.1% in September, matching August’s decline and missing forecasts for growth, though year-over-year sales rose just 1% amid improving consumer confidence. Germany’s industrial production rebounded 1.3% in September but remains down 1% annually, with analysts expecting only modest, cyclical gains ahead from rising orders, lower inventories, and planned infrastructure spending. ECB officials highlight balanced growth risks, moderating services inflation, and unexpected economic resilience, justifying steady rates at 2%; analysts see narrowing US-Europe growth gaps supporting the euro, with one major investment house forecasting $1.20 by Q4 2025 and $1.26 by Q3 2026 as the ECB pauses while the Fed eases.

 
USDJPY: technical overview

There are signs of a meaningful top in place after the market put in a multi-year high in 2024. At this point, the door is now open for a deeper setback below the 2024 low at 139.58, exposing a retest of the 2023 low. Rallies should be well capped below 155.00.

USDJPY Chart
R2 154.80 - 12 February high - Strong
R1 154.48 - 4 November high - Medium
S1 151.54 - 29 October low - Medium
S2 149.38 - 17 October low - Strong
USDJPY: fundamental overview

The yen strengthened sharply during yesterday’s dollar sell-off amid a shift to risk-off sentiment, though it’s premature to label the November 4 high of 154.48 in USDJPY as the rally’s peak. Japan’s September wage data showed nominal growth of 1.9% YoY as expected, but the BOJ’s key scheduled full-time pay measure rose only 2.2% (below 2.5% forecast), while real earnings fell 1.4% for the ninth straight month, highlighting ongoing pressure on purchasing power and consumer demand. With Governor Ueda focused on next year’s wage talks, major unions like UA Zensen and Rengo are targeting 5-6% hikes in 2026, signaling potential support for sustainable inflation and a BOJ rate hike—though persistent negative real wages may temper expectations for aggressive tightening. Household spending rose 1.8% YoY in September (missing 2.5% forecast but marking five months of gains), underscoring resilient domestic demand that accounts for over half of GDP. Any lasting USDJPY decline may depend more on aggressive Fed rate cuts than a single BOJ hike.

 
AUDUSD: technical overview

There are signs of the potential formation of a longer-term base with the market trading down into a meaningful longer-term support zone. Only a monthly close below 0.5500 would give reason for rethink. A monthly close back above 0.7000 will take the big picture pressure off the downside and strengthen case for a bottom.

AUDUSD Chart
R2 0.6629 - 1 October high - Strong
R1 0.6618 - 29 October high - Medium
S1 0.6458 - 5 November low - Medium
S1 0.6440 - 14 October low - Strong
AUDUSD: fundamental overview

The RBA’s decision to hold rates at 3.6% and signal no further cuts until mid-2026 supports AUD appreciation into next year, with short-term dips likely holding above 0.6400. Near-neutral rates, rising core inflation above target, and Australia’s stronger GDP growth (1.8%-2.3% through 2027) versus the US (1.9%-2%) bolster domestic demand amid a stable job market. Improving China-US trade ties should lift China’s economy and global risk appetite, aiding the AUD despite a recent risk-off phase and October export dip, while reduced short positions, an 8% undervaluation per Bloomberg’s BEER model, and historical lows reinforce a bullish medium-term outlook unless risk aversion intensifies.

 
Suggested reading

The Consequences Of Axing Trump’s Tariffs, L. Baccardax, Barron’s (November 6, 2025)

The Benefits of Bubbles, B. Thompson, Stratechery (November 5, 2025)


Any opinions, news, research, analyses, prices or other information ("information") contained on this Blog, constitutes marketing communication and it has not been prepared in accordance with legal requirements designed to promote the independence of investment research. Further, the information contained within this Blog does not contain (and should not be construed as containing) investment advice or an investment recommendation, or an offer of, or solicitation for, a transaction in any financial instrument. LMAX Group has not verified the accuracy or basis-in-fact of any claim or statement made by any third parties as comments for every Blog entry.

LMAX Group will not accept liability for any loss or damage, including without limitation to, any loss of profit, which may arise directly or indirectly from use of or reliance on such information. No representation or warranty is given as to the accuracy or completeness of the above information. While the produced information was obtained from sources deemed to be reliable, LMAX Group does not provide any guarantees about the reliability of such sources. Consequently any person acting on it does so entirely at his or her own risk. It is not a place to slander, use unacceptable language or to promote LMAX Group or any other FX and CFD provider and any such postings, excessive or unjust comments and attacks will not be allowed and will be removed from the site immediately.

Day Image
6th November 2025 | view in browser
Fed easing, tariff drama capture spotlight

Markets are drifting into Thursday on a cautious but constructive tide: US equities are catching their breath after a strong run, with the S&P 500 and Dow holding near recent highs while the Nasdaq pulls back on tech profit-taking—broad sentiment remains positive, supported by solid growth and a resilient labor backdrop, but tariff uncertainty and central bank divergence keep traders on edge.


Performance chart 30day v. USD (%)
Performance Chart
 
 
Technical & fundamental highlights
EURUSD: technical overview

The Euro outlook remains constructive with higher lows sought out on dips in favor of the next major upside extension targeting the 2021 high at 1.2350. Setbacks should be exceptionally well supported ahead of 1.1300.

EURUSD Chart
R2 1.1729 - 17 October high -Strong
R1 1.1669 - 28 October high - Medium
S1 1.1469 - 5 November low - Medium
S2 1.1392 - 1 August low - Strong
EURUSD: fundamental overview

ECB officials see eurozone data matching forecasts, keeping rates on hold until December amid uncertainties, while markets anticipate less ECB-Fed policy divergence after Powell downplayed a December cut, pressuring EURUSD but likely holding above support. German factory orders rose 1.1% and French industrial output gained 0.8% in September—beating expectations and driven by foreign demand despite U.S. tariffs—with analysts expecting ECB rate cuts and fiscal support to aid recovery. Two well known banks note narrowing U.S.-Europe growth gaps and easing trade risks, forecasting ECB rates steady until mid-2026 and EURUSD rising to $1.20 by Q4 2025 and $1.26 by Q3 2026; upcoming data includes eurozone retail sales (+0.2% MoM expected), German industrial production (+3.0% MoM rebound), and construction PMI, signaling modest improvement.

 
USDJPY: technical overview

There are signs of a meaningful top in place after the market put in a multi-year high in 2024. At this point, the door is now open for a deeper setback below the 2024 low at 139.58, exposing a retest of the 2023 low. Rallies should be well capped below 155.00.

USDJPY Chart
R2 154.80 - 12 February high - Strong
R1 154.49 - 4 November high - Medium
S1 151.54 - 29 October low - Medium
S2 149.38 - 17 October low - Strong
USDJPY: fundamental overview

PM Sanae Takaichi’s growth strategy, emphasizing cautious monetary tightening and fiscal expansion, signaled prolonged ultra-loose policy and delayed BOJ rate hikes, weakening the yen to new lows as traders sold it for carry trades. Finance officials, including Minister Katayama and Vice Minister Mimura, urgently warned of excessive yen weakness defying fundamentals, ready to intervene if disorderly, while noting reduced long-yen positions amid trade, geopolitical, and fiscal factors; BOJ minutes revealed debate with rates held at 0.5% (7-2 vote), though Governor Ueda eyed a possible December hike if wage momentum builds—September nominal wages rose 1.9% YoY but real earnings fell 1.4% for the ninth month, underscoring waning shunto gains and eroding consumer power.

 
AUDUSD: technical overview

There are signs of the potential formation of a longer-term base with the market trading down into a meaningful longer-term support zone. Only a monthly close below 0.5500 would give reason for rethink. A monthly close back above 0.7000 will take the big picture pressure off the downside and strengthen case for a bottom.

AUDUSD Chart
R2 0.6629 - 1 October high - Strong
R1 0.6618 - 29 October high - Medium
S1 0.6458 - 5 November low - Medium
S1 0.6440 - 14 October low - Strong
AUDUSD: fundamental overview

The RBA’s decision to hold rates at 3.6% and signal no further cuts until mid-2026, amid rising core inflation and a neutral policy stance, supports AUD appreciation into 2026, with short-term dips likely holding and contained. Australia’s stronger GDP growth (1.8–2.3% through 2027) versus the US, combined with a stable job market and rising asset prices, bolsters domestic demand, while improving China-US trade ties boost commodity exports and global risk appetite. Recent data shows a sharp September export rebound (7.9% MoM) driven by higher commodity prices and demand from China, alongside modest import growth, widening the trade surplus.

 
Suggested reading

Finding Investing Heirs to Warren Buffett Will Be Difficult, L. Braham, Barron’s (November 1, 2025)

How to Rebalance Your Portfolio in a Lofty Market, A. Arnott, Morningstar (November 4, 2025)


Any opinions, news, research, analyses, prices or other information ("information") contained on this Blog, constitutes marketing communication and it has not been prepared in accordance with legal requirements designed to promote the independence of investment research. Further, the information contained within this Blog does not contain (and should not be construed as containing) investment advice or an investment recommendation, or an offer of, or solicitation for, a transaction in any financial instrument. LMAX Group has not verified the accuracy or basis-in-fact of any claim or statement made by any third parties as comments for every Blog entry.

LMAX Group will not accept liability for any loss or damage, including without limitation to, any loss of profit, which may arise directly or indirectly from use of or reliance on such information. No representation or warranty is given as to the accuracy or completeness of the above information. While the produced information was obtained from sources deemed to be reliable, LMAX Group does not provide any guarantees about the reliability of such sources. Consequently any person acting on it does so entirely at his or her own risk. It is not a place to slander, use unacceptable language or to promote LMAX Group or any other FX and CFD provider and any such postings, excessive or unjust comments and attacks will not be allowed and will be removed from the site immediately.

Day Image
5th November 2025 | view in browser
Dollar rally could be nearing its end

Global markets are tilting toward risk aversion amid growing AI bubble fears, fueled by Michael Burry’s $1B+ put options on Nvidia and Palantir, plus bubble warnings from Morgan Stanley and Goldman Sachs CEOs, alongside a U.S. government shutdown now exceeding a month.


Performance chart 30day v. USD (%)
Performance Chart
 
 
Technical & fundamental highlights
EURUSD: technical overview

The Euro outlook remains constructive with higher lows sought out on dips in favor of the next major upside extension targeting the 2021 high at 1.2350. Setbacks should be exceptionally well supported ahead of 1.1300.

EURUSD Chart
R2 1.1729 - 17 October high -Strong
R1 1.1669 - 28 October high - Medium
S1 1.1446 - 19 June low - Medium
S2 1.1392 - 1 August low - Strong
EURUSD: fundamental overview

ECB Governing Council member Joachim Nagel reports that Eurozone data align with the ECB’s projections, supporting unchanged interest rates until the December review amid uncertainties. Markets have narrowed expectations for ECB-Fed policy divergence after Fed Chair Powell tempered December cut hopes, pressuring EURUSD lower, though the 1.1392 support level should hold without new catalysts. Analysts at some major banks view the euro as undervalued by about 1%, with neutral positioning poised for rallies on weak U.S. jobs data; they forecast ECB rates steady until mid-2026 while the Fed eases, driving EURUSD to $1.18–$1.20 by year-end and up to $1.26 by Q3 2026, aided by improved European growth outlooks and reduced global risks. Upcoming data include September PPI (forecast flat MoM at 0.0%, YoY -0.2%, signaling easing deflation), finalized October HCOB Services/Composite PMIs, and German factory orders (MoM +0.9%, YoY -4.1%).

 
USDJPY: technical overview

There are signs of a meaningful top in place after the market put in a multi-year high in 2024. At this point, the door is now open for a deeper setback below the 2024 low at 139.58, exposing a retest of the 2023 low. Rallies should be well capped below 155.00.

USDJPY Chart
R2 154.80 - 12 February high - Strong
R1 154.49 - 4 November high - Medium
S1 151.54 - 29 October low - Medium
S2 149.38 - 17 October low - Strong
USDJPY: fundamental overview

PM Sanae Takaichi’s new national growth strategy, due next summer, stressed cautious monetary tightening and fiscal expansion, signaling prolonged ultra-loose policies and delaying BOJ rate hikes; markets reacted negatively, driving the yen to fresh lows against the dollar as traders sold it for carry trades. Finance Minister Satsuki Katayama issued urgent verbal warnings on currency moves, capping USDJPY amid global equity sell-offs, while two large US investment houses see no near-term intervention—last seen in 2024 at 158–162—unless volatility spikes. BOJ minutes showed a 7–2 vote to hold rates at 0.5%, with dissenters pushing hikes to anchor 2% inflation; Governor Ueda, facing his first split, signaled a potential December hike if wage momentum builds, as labor aims for >5% increases—September data Thursday (expected 2.5% YoY scheduled pay) will be key.

 
AUDUSD: technical overview

There are signs of the potential formation of a longer-term base with the market trading down into a meaningful longer-term support zone. Only a monthly close below 0.5500 would give reason for rethink. A monthly close back above 0.7000 will take the big picture pressure off the downside and strengthen case for a bottom.

AUDUSD Chart
R2 0.6629 - 1 October high - Strong
R1 0.6618 - 29 October high - Medium
S1 0.6458 - 5 November low - Medium
S1 0.6440 - 14 October low - Strong
AUDUSD: fundamental overview

The Reserve Bank of Australia held its cash rate steady at 3.60% this week, as widely expected, citing persistent core inflation, robust household spending, and a resurgent housing market as reasons to remain cautious on further easing amid economic uncertainty. With recent data signaling ongoing price pressures and no clear signals on future moves, markets see little chance of a December cut without sharper cooling in inflation and demand. The Australian dollar showed little reaction, staying weak amid broader risk-off sentiment fueled by AI bubble fears—highlighted by Michael Burry’s $1 billion+ put options on Nvidia and Palantir, plus bubble warnings from Morgan Stanley and Goldman Sachs CEOs—along with worries over the prolonged U.S. government shutdown. Unless risk aversion intensifies, AUDUSD is likely to stabilize.

 
Suggested reading

How Germany Became World’s Worst-Performing Economy, M. Moutii, AIER (November 3, 2025)

Amid All This Enthusiasm, Cash May Be Wise, J. Calhoun, Alhambra (November 2, 2025)


Any opinions, news, research, analyses, prices or other information ("information") contained on this Blog, constitutes marketing communication and it has not been prepared in accordance with legal requirements designed to promote the independence of investment research. Further, the information contained within this Blog does not contain (and should not be construed as containing) investment advice or an investment recommendation, or an offer of, or solicitation for, a transaction in any financial instrument. LMAX Group has not verified the accuracy or basis-in-fact of any claim or statement made by any third parties as comments for every Blog entry.

LMAX Group will not accept liability for any loss or damage, including without limitation to, any loss of profit, which may arise directly or indirectly from use of or reliance on such information. No representation or warranty is given as to the accuracy or completeness of the above information. While the produced information was obtained from sources deemed to be reliable, LMAX Group does not provide any guarantees about the reliability of such sources. Consequently any person acting on it does so entirely at his or her own risk. It is not a place to slander, use unacceptable language or to promote LMAX Group or any other FX and CFD provider and any such postings, excessive or unjust comments and attacks will not be allowed and will be removed from the site immediately.

Day Image
4th November 2025 | view in browser
Fed bows to US debt mountain

The US dollar stays firm amid Fed caution, but Treasury Secretary Bessent blasted its “broken” inflation models and vowed a leadership overhaul to revamp processes, as soaring deficits and debt over GDP push the Fed toward fiscal dominance—prioritizing low rates to manage borrowing costs over inflation control.


Performance chart 30day v. USD (%)
Performance Chart
 
 
Technical & fundamental highlights
EURUSD: technical overview

The Euro outlook remains constructive with higher lows sought out on dips in favor of the next major upside extension targeting the 2021 high at 1.2350. Setbacks should be exceptionally well supported ahead of 1.1300.

EURUSD Chart
R2 1.1729 - 17 October high -Strong
R1 1.1669 - 28 October high - Medium
S1 1.1446 - 19 June low - Medium
S2 1.1392 - 1 August low - Strong
EURUSD: fundamental overview

Eurozone October inflation eased to 2.1% year-over-year from 2.2%, staying just above the ECB’s 2% target due to slower rises in food and goods prices, with core inflation steady at 2.4%. The ECB held interest rates unchanged for the third meeting, adopting a cautious, data-dependent approach amid trade uncertainties, while forecasts predict inflation dipping to 1.7% in 2026 before rising to 1.9% in 2027. Policymakers like Joachim Nagel see no need for changes yet, with a December review planned; meanwhile, markets expect less divergence between ECB and Fed rates after Powell’s comments, pressuring EURUSD but likely holding support at 1.1392 without new catalysts.

 
USDJPY: technical overview

There are signs of a meaningful top in place after the market put in a multi-year high in 2024. At this point, the door is now open for a deeper setback below the 2024 low at 139.58, exposing a retest of the 2023 low. Rallies should be well capped below 155.00.

USDJPY Chart
R2 154.80 - 12 February high - Strong
R1 154.49 - 4 November high - Medium
S1 151.54 - 29 October low - Medium
S2 149.38 - 17 October low - Strong
USDJPY: fundamental overview

The yen remains under pressure and is the worst-performing G10 currency this year. However, we are seeing some demand for the yen on Tuesday after Tokyo’s October inflation rose to 2.8%, supporting gradual BOJ rate hikes, while Finance Minister Katayama’s concerns over sharp yen moves temporarily paused its decline. At the same time, upcoming LDP fiscal stimulus and skepticism toward PM Takaichi’s tax-revenue plans without rate hikes could further weaken the yen. Hedge funds are betting on USDJPY hitting 160 by year-end amid Fed-BOJ policy divergence and the BOJ’s cautious stance, with two major US investment houses ruling out near-term intervention. Thursday’s September wage data, with scheduled full-time pay expected at 2.5% YoY, will be closely watched for progress in the BOJ’s wage-inflation cycle.

 
AUDUSD: technical overview

There are signs of the potential formation of a longer-term base with the market trading down into a meaningful longer-term support zone. Only a monthly close below 0.5500 would give reason for rethink. A monthly close back above 0.7000 will take the big picture pressure off the downside and strengthen case for a bottom.

AUDUSD Chart
R2 0.6629 - 1 October high - Strong
R1 0.6618 - 29 October high - Medium
S1 0.6471 - 16 October low - Medium
S1 0.6440 - 14 October low - Strong
AUDUSD: fundamental overview

The Reserve Bank of Australia kept its key interest rate steady at 3.60%, as expected, citing ongoing core inflation, strong consumer spending, and a rebounding housing market as reasons to avoid further rate cuts amid economic uncertainty. Recent data suggest inflation will remain elevated, giving little hint of future policy changes, especially after hotter-than-expected Q3 figures, making a December easing unlikely without clearer signs of cooling demand. With a US-China trade truce boosting global conditions, the Australian dollar may hold firm.

 
Suggested reading

Gold Is a Better Equity Market Tell Than It’s Being Credited For, J. Tamny, Forbes (November 2, 2025)

As AI Shares Soar, Are We Living Through 1999 Again?, S. McBride, RiskHedge (October 31, 2025)


Any opinions, news, research, analyses, prices or other information ("information") contained on this Blog, constitutes marketing communication and it has not been prepared in accordance with legal requirements designed to promote the independence of investment research. Further, the information contained within this Blog does not contain (and should not be construed as containing) investment advice or an investment recommendation, or an offer of, or solicitation for, a transaction in any financial instrument. LMAX Group has not verified the accuracy or basis-in-fact of any claim or statement made by any third parties as comments for every Blog entry.

LMAX Group will not accept liability for any loss or damage, including without limitation to, any loss of profit, which may arise directly or indirectly from use of or reliance on such information. No representation or warranty is given as to the accuracy or completeness of the above information. While the produced information was obtained from sources deemed to be reliable, LMAX Group does not provide any guarantees about the reliability of such sources. Consequently any person acting on it does so entirely at his or her own risk. It is not a place to slander, use unacceptable language or to promote LMAX Group or any other FX and CFD provider and any such postings, excessive or unjust comments and attacks will not be allowed and will be removed from the site immediately.

Day Image
3rd November 2025 | view in browser
Dollar dominates October, trims yearly losses

The US dollar capped October with its second-strongest monthly gain of the year, rising 2.1% on the DXY index amid sparse economic data and global uncertainties, trimming its annual loss to under 10%.


Performance chart 30day v. USD (%)
Performance Chart
 
 
Technical & fundamental highlights
EURUSD: technical overview

The Euro outlook remains constructive with higher lows sought out on dips in favor of the next major upside extension targeting the 2021 high at 1.2350. Setbacks should be exceptionally well supported ahead of 1.1300.

EURUSD Chart
R2 1.1729 - 17 October high -Strong
R1 1.1669 - 28 October high - Medium
S1 1.1521 - 3 November low - Medium
S2 1.1500 - Psychological - Strong
EURUSD: fundamental overview

Last Friday’s Eurozone October inflation data showed headline inflation easing to 2.1% year-over-year from 2.2%, staying just above the ECB’s 2% target due to slower food and goods price rises, with core inflation steady at 2.4%. The ECB held interest rates unchanged for the third meeting amid trade uncertainties, adopting a data-dependent approach, while forecasts predict inflation dipping to 1.7% in 2026 before rising to 1.9% in 2027. Markets are pricing in less divergence between ECB and Fed policies, pressuring the EURUSD, but support holds unless new catalysts appear. This week brings final October manufacturing PMIs today, services PMIs on Wednesday, plus German factory orders, industrial production, trade data, and Eurozone retail sales through Friday.

 
USDJPY: technical overview

There are signs of a meaningful top in place after the market put in a multi-year high in 2024. At this point, the door is now open for a deeper setback below the 2024 low at 139.58, exposing a retest of the 2023 low. Rallies should be well capped below 155.00.

USDJPY Chart
R2 154.80 - 12 February high - Strong
R1 154.45 - 30 October high - Medium
S1 151.54 - 29 October low - Medium
S2 149.38 - 17 October low - Strong
USDJPY: fundamental overview

Tokyo’s October inflation rose 2.8%, supporting expectations for gradual Bank of Japan rate hikes and helping pause the yen’s sharp decline, while bond yields mixed with two-year at 0.91% after strong demand and 10-year up to 1.66%; Finance Minister Satsuki Katayama warned of rapid yen moves, signaling closer monitoring. Markets remain divided, with hedge funds betting on yen weakening to 160 per dollar by year-end amid Fed-BOJ policy divergence and persistent USDJPY upside, though medium-term views suspect overpriced expectations of expansive fiscal and monetary stimulus under a potential Sanae Takaichi regime, likely constrained by cabinet, finance ministry, and political realities. September wage data due Thursday will be closely watched for BOJ-monitored wage-inflation progress, with Japan on Culture Day holiday today.

 
AUDUSD: technical overview

There are signs of the potential formation of a longer-term base with the market trading down into a meaningful longer-term support zone. Only a monthly close below 0.5500 would give reason for rethink. A monthly close back above 0.7000 will take the big picture pressure off the downside and strengthen case for a bottom.

AUDUSD Chart
R2 0.6629 - 1 October high - Strong
R1 0.6618 - 29 October high - Medium
S1 0.6471 - 16 October low - Medium
S1 0.6440 - 14 October low - Strong
AUDUSD: fundamental overview

The recent Australian CPI data showed inflation rising to 3.2% annually, with trimmed mean up 1.0% quarter-on-quarter—exceeding RBA forecasts and Governor Bullock’s warning threshold—making a rate hold at 3.6% likely on November 4, while pushing any cuts out to mid-2026 unless labor or inflation weakens sharply. Economists expect the RBA to raise short-term inflation forecasts in its upcoming statement, though some see a return to target by late 2026 amid steady GDP growth; critics argue the bank underestimated wage pressures detached from productivity. Recent data highlights resilience: home values jumped 1.1% in October (strongest since June 2023), building approvals surged 12%, and household spending rebounded to 5.1% year-on-year, though monthly gains remain modest and driven by essentials rather than discretionary items.

 
Suggested reading

The Monster Lurking Behind Federal Reserve Rate Cut, L. Navellier, InvestorPlace (November 1, 2025)

Why Another Fed Rate Cut In December Would Be Absurd, P. O’Hare, Briefing (October 31, 2025)


Any opinions, news, research, analyses, prices or other information ("information") contained on this Blog, constitutes marketing communication and it has not been prepared in accordance with legal requirements designed to promote the independence of investment research. Further, the information contained within this Blog does not contain (and should not be construed as containing) investment advice or an investment recommendation, or an offer of, or solicitation for, a transaction in any financial instrument. LMAX Group has not verified the accuracy or basis-in-fact of any claim or statement made by any third parties as comments for every Blog entry.

LMAX Group will not accept liability for any loss or damage, including without limitation to, any loss of profit, which may arise directly or indirectly from use of or reliance on such information. No representation or warranty is given as to the accuracy or completeness of the above information. While the produced information was obtained from sources deemed to be reliable, LMAX Group does not provide any guarantees about the reliability of such sources. Consequently any person acting on it does so entirely at his or her own risk. It is not a place to slander, use unacceptable language or to promote LMAX Group or any other FX and CFD provider and any such postings, excessive or unjust comments and attacks will not be allowed and will be removed from the site immediately.

Day Image
31st October 2025 | view in browser
Markets bet on seasonal Dollar strength

Markets are adjusting to reduced expectations for Federal Reserve rate cuts after Chair Powell emphasized that a December reduction is not guaranteed, boosting the dollar. Historically, the dollar also strengthens in Q4 due to year-end repatriations and liquidity needs.


Performance chart 30day v. USD (%)
Performance Chart
 
 
Technical & fundamental highlights
EURUSD: technical overview

The Euro outlook remains constructive with higher lows sought out on dips in favor of the next major upside extension targeting the 2021 high at 1.2350. Setbacks should be exceptionally well supported ahead of 1.1300.

EURUSD Chart
R2 1.1779 - 1 October high -Strong
R1 1.1729 - 17 October high - Medium
S1 1.1542 - 9 October low - Medium
S2 1.1528 - 5 August low - Strong
EURUSD: fundamental overview

The ECB held its deposit rate at 2%, citing labor market strength, solid balance sheets, and past cuts as buffers against trade disputes and geopolitical risks, while eurozone Q3 GDP rose to 0.2% from 0.1% in Q2, topping forecasts despite U.S. tariffs—with Q4 and 2026 growth expected to accelerate via German fiscal expansion, infrastructure, and private sector stabilization. Markets ignored the predictable ECB decision, instead pricing a slimmer ECB-Fed rate gap after Powell tempered December cut odds, pressuring EURUSD but likely respecting support absent fresh catalysts. Upcoming: October inflation forecast to ease to 2.1% YoY headline and 2.3% core, aligning with ECB views and trending below 2% from Q1 2026 due to tariffs; German September retail sales seen rebounding 0.2% MoM and 2.7% YoY, confirming gradual consumer recovery despite high rates and weak exports.

 
USDJPY: technical overview

There are signs of a meaningful top in place after the market put in a multi-year high in 2024. At this point, the door is now open for a deeper setback below the 2024 low at 139.58, exposing a retest of the 2023 low. Rallies should be well capped below 155.00.

USDJPY Chart
R2 154.80 - 12 February high - Strong
R1 154.45 - 30 October high - Medium
S1 151.54 - 29 October low - Medium
S2 149.38 - 17 October low - Strong
USDJPY: fundamental overview

The Bank of Japan kept its policy rate at 0.5%—with two dissenters pushing for a hike for the second straight meeting—aligning with most forecasts despite new easing-friendly Prime Minister Sanae Takaichi, but the yen plunged as markets saw the seventh delay signaling prolonged normalization, amplified by Fed Chair Powell’s warning against assuming a December U.S. cut. Former Governor Haruhiko Kuroda called the yen “too weak” at 153 per dollar, forecasting a rise to 120–130 on narrowing rate differentials, U.S. cuts, and potential BOJ hikes amid stable 1.5% growth, 2.6% unemployment, and met inflation targets, though hedge funds bet against it, driving massive USDJPY call option volume toward 160 by year-end. Reinforcing the hawkish case, Tokyo core inflation accelerated to 2.8% in October, topping expectations and showing persistent underlying pressures.

 
AUDUSD: technical overview

There are signs of the potential formation of a longer-term base with the market trading down into a meaningful longer-term support zone. Only a monthly close below 0.5500 would give reason for rethink. A monthly close back above 0.7000 will take the big picture pressure off the downside and strengthen case for a bottom.

AUDUSD Chart
R2 0.6629 - 1 October high - Strong
R1 0.6618 - 29 October high - Medium
S1 0.6471 - 16 October low - Medium
S1 0.6440 - 14 October low - Strong
AUDUSD: fundamental overview

Australia’s hotter-than-expected Q3 CPI—with annual inflation at 3.2%, trimmed mean up 1.0% q/q, and September at 3.5%—has flipped RBA expectations to a near-certain hold on November 4, pushing rate cuts to 2026 unless inflation or labor markets soften sharply; the Australian Dollar spiked to three-week highs but retreated below 0.6600 after Fed Chair Powell tempered December cut hopes. The Trump-Xi meeting yielded no fresh catalysts beyond pre-leaked deals, prompting a “sell the fact” reaction rather than sustained risk-on gains, though one major US investment house stays bullish on AUD amid cooling global inflation and easing trade tensions. Supporting the tighter policy outlook, recent PPI acceleration and robust private sector credit growth reinforce persistent inflationary pressures.

 
Suggested reading

Why AI Spending Spree Could Spell Trouble for Investors, L. Swedroe, Morningstar (October 30, 2025)

If It’s a Bubble, So What?!, K. K, The Brooklyn Investor (October 25, 2025)


Any opinions, news, research, analyses, prices or other information ("information") contained on this Blog, constitutes marketing communication and it has not been prepared in accordance with legal requirements designed to promote the independence of investment research. Further, the information contained within this Blog does not contain (and should not be construed as containing) investment advice or an investment recommendation, or an offer of, or solicitation for, a transaction in any financial instrument. LMAX Group has not verified the accuracy or basis-in-fact of any claim or statement made by any third parties as comments for every Blog entry.

LMAX Group will not accept liability for any loss or damage, including without limitation to, any loss of profit, which may arise directly or indirectly from use of or reliance on such information. No representation or warranty is given as to the accuracy or completeness of the above information. While the produced information was obtained from sources deemed to be reliable, LMAX Group does not provide any guarantees about the reliability of such sources. Consequently any person acting on it does so entirely at his or her own risk. It is not a place to slander, use unacceptable language or to promote LMAX Group or any other FX and CFD provider and any such postings, excessive or unjust comments and attacks will not be allowed and will be removed from the site immediately.

Day Image
30th October 2025 | view in browser
Fed cuts, Powell pumps brakes on December

The Federal Reserve cut its benchmark interest rate for the second straight time to 3.75–4%, the lowest in three years, though Chair Powell warned against expecting another reduction in December, emphasizing data-dependent decisions amid internal divisions.


Performance chart 30day v. USD (%)
Performance Chart
 
 
Technical & fundamental highlights
EURUSD: technical overview

The Euro outlook remains constructive with higher lows sought out on dips in favor of the next major upside extension targeting the 2021 high at 1.2350. Setbacks should be exceptionally well supported ahead of 1.1300.

EURUSD Chart
R2 1.1779 - 1 October high -Strong
R1 1.1729 - 17 October high - Medium
S1 1.1542 - 9 October low - Medium
S2 1.1528 - 5 August low - Strong
EURUSD: fundamental overview

The ECB’s upcoming policy meeting is likely a non-event, with rates held steady amid a confident “Goldilocks” outlook where US tariff impacts are seen as temporary and offset by Germany’s fiscal stimulus; President Lagarde will stress policy is “in a good place,” signaling stability and muted rate-cut speculation while cautioning on geopolitical risks, bolstered by stable inflation expectations (1-year CPI at 2.7%, 3-year at 2.5%). This ECB-Fed divergence, combined with easing US-China trade tensions post-Trump-Xi talks, should curb aggressive EURUSD shorting despite Fed cut doubts, while markets eye today’s Q3 eurozone GDP (forecast: 0.1% QoQ, 1.2% YoY) and steady 6.3% unemployment, highlighting sluggish growth amid tariff pressures but potential 2026 relief from German stimulus and easier financing. Meanwhile, the ECB pushes for a 2029 digital euro launch to enhance payment autonomy and reduce reliance on US giants like Visa and PayPal, though political delays (key vote to mid-2026) limit short-term effects; longer-term, successful adoption could mildly bolster EURUSD if it strengthens eurozone prospects.

 
USDJPY: technical overview

There are signs of a meaningful top in place after the market put in a multi-year high in 2024. At this point, the door is now open for a deeper setback below the 2024 low at 139.58, exposing a retest of the 2023 low. Rallies should be well capped below 155.00.

USDJPY Chart
R2 154.80 - 12 February high - Strong
R1 153.27 - 10 October high - Medium
S1 149.38 - 17 October low - Medium
S2 149.03 - 6 October low - Strong
USDJPY: fundamental overview

The Bank of Japan held its policy rate steady at 0.5%, with two board members dissenting for a hike, aligning with most economists’ expectations in the first meeting under new Prime Minister Sanae Takaichi, a monetary easing supporter. Governor Kazuo Ueda’s cautious stance amid political shifts suggests a potential rate increase as soon as December, with his upcoming press conference likely to address yen weakness and adopt a hawkish tone. USDJPY is pushing toward the October high of 153.27, buoyed by possible positive US-China trade talks from the Trump-Xi meeting, though over the medium term, markets may overestimate fiscal expansion under Takaichi, as her coalition partner Ishin pushes for spending discipline to curb yen depreciation.

 
AUDUSD: technical overview

There are signs of the potential formation of a longer-term base with the market trading down into a meaningful longer-term support zone. Only a monthly close below 0.5500 would give reason for rethink. A monthly close back above 0.7000 will take the big picture pressure off the downside and strengthen case for a bottom.

AUDUSD Chart
R2 0.6629 - 1 October high - Strong
R1 0.6608 - 28 October high - Medium
S1 0.6471 - 16 October low - Medium
S1 0.6440 - 14 October low - Strong
AUDUSD: fundamental overview

Australia’s hotter-than-expected Q3 CPI data, with annual inflation rising to 3.2% and core measures exceeding forecasts, has shifted market expectations toward the RBA holding rates steady at its November 4 meeting rather than cutting. The Australian dollar initially surged to three-week highs but later eased below 0.6600 after Fed Chair Powell tempered expectations for a December U.S. rate cut. RBA Governor Bullock had flagged a 0.9% quarterly core reading as concerning, making the 1.0% result likely to prompt a “wait-and-see” approach, with rate cuts now pushed to 2026 unless inflation or labor markets soften significantly. Separately, President Trump’s positive comments on his meeting with President Xi and planned April visit to China are supporting risk-on sentiment, benefiting cyclical currencies like the AUD and NZD.

 
Suggested reading

The Dollar’s Down & These 3 Investments Are Way Up, D. Lefkovitz, Morningstar (October 29, 2025)

There May Be A Stock Market Bubble….Next Year, M. Hulbert, MarketWatch (October 29, 2025)


Any opinions, news, research, analyses, prices or other information ("information") contained on this Blog, constitutes marketing communication and it has not been prepared in accordance with legal requirements designed to promote the independence of investment research. Further, the information contained within this Blog does not contain (and should not be construed as containing) investment advice or an investment recommendation, or an offer of, or solicitation for, a transaction in any financial instrument. LMAX Group has not verified the accuracy or basis-in-fact of any claim or statement made by any third parties as comments for every Blog entry.

LMAX Group will not accept liability for any loss or damage, including without limitation to, any loss of profit, which may arise directly or indirectly from use of or reliance on such information. No representation or warranty is given as to the accuracy or completeness of the above information. While the produced information was obtained from sources deemed to be reliable, LMAX Group does not provide any guarantees about the reliability of such sources. Consequently any person acting on it does so entirely at his or her own risk. It is not a place to slander, use unacceptable language or to promote LMAX Group or any other FX and CFD provider and any such postings, excessive or unjust comments and attacks will not be allowed and will be removed from the site immediately.

Day Image
29th October 2025 | view in browser
Tariffs on trial, US Dollar on tilt

The US and China are poised to showcase a positive outcome from their leaders’ meeting at the upcoming APEC summit, highlighting quick agreements on soybean purchases, fentanyl controls, and tariff extensions, though deeper issues like national security and tech rivalry remain unresolved, merely delaying a shift to a multipolar world without derailing the current risk-on sentiment.


Performance chart 30day v. USD (%)
Performance Chart
 
 
Technical & fundamental highlights
EURUSD: technical overview

The Euro outlook remains constructive with higher lows sought out on dips in favor of the next major upside extension targeting the 2021 high at 1.2350. Setbacks should be exceptionally well supported ahead of 1.1300.

EURUSD Chart
R2 1.1779 - 1 October high -Strong
R1 1.1729 - 17 October high - Medium
S1 1.1542 - 9 October low - Medium
S2 1.1528 - 5 August low - Strong
EURUSD: fundamental overview

The ECB is holding firm on its “Goldilocks” outlook, expecting U.S. tariff effects to fade quickly with Germany’s fiscal stimulus, backing unchanged rates at the October 30 meeting, while Lagarde likely stresses policy is “in a good place”—signaling inflation is largely tamed and cuts are off the table—despite underlying trade and geopolitical risks; stable inflation expectations (1-year at 2.7%, 3-year at 2.5%) reinforce this steady stance. The ECB-Fed rate gap, hopes for U.S.-China trade de-escalation after a Trump-Xi meeting, and France’s political compromise on corporate tax hikes to trim its deficit are all boosting the euro. However, November’s GfK Consumer Confidence unexpectedly fell to -24.1 (from a revised -22.5 prior, worse than -22.0 forecast) on job security fears, signaling private consumption recovery will stay weak despite a slight uptick in purchase willingness.

 
USDJPY: technical overview

There are signs of a meaningful top in place after the market put in a multi-year high in 2024. At this point, the door is now open for a deeper setback below the 2024 low at 139.58, exposing a retest of the 2023 low. Rallies should be well capped below 155.00.

USDJPY Chart
R2 154.80 - 12 February high - Strong
R1 153.27 - 10 October high - Medium
S1 149.38 - 17 October low - Medium
S2 149.03 - 6 October low - Strong
USDJPY: fundamental overview

The USDJPY rally stalled near the key October 10 high of 153.27 as traders grew cautious ahead of the Fed’s expected 25bps rate cuts this meeting and in December, contrasted with the BoJ likely holding rates but possibly signaling a hawkish tilt, prompting profit-taking; concerns from Japan’s Economics Minister about FX volatility and US Treasury Secretary Bessent’s calls for BoJ flexibility to curb yen weakness fueled intervention speculation, while failure to break 153.27 could trigger CTA liquidations. Longer-term, markets may underestimate potential BoJ hikes amid robust inflation and wage growth, with Governor Ueda possibly hinting hawkishly and a Takaichi regime prioritizing fiscal discipline over unchecked stimulus despite coalition pressures. This week’s US-China trade optimism post-APEC could briefly weigh on the yen by boosting risk sentiment, but deeper unresolved tensions suggest limited aggressive yen recovery.

 
AUDUSD: technical overview

There are signs of the potential formation of a longer-term base with the market trading down into a meaningful longer-term support zone. Only a monthly close below 0.5500 would give reason for rethink. A monthly close back above 0.7000 will take the big picture pressure off the downside and strengthen case for a bottom.

AUDUSD Chart
R2 0.6629 - 1 October high - Strong
R1 0.6608 - 28 October high - Medium
S1 0.6471 - 16 October low - Medium
S1 0.6440 - 14 October low - Strong
AUDUSD: fundamental overview

The Australian Dollar is trading with an upside bias, fueled by positive risk-on sentiment and optimism for a “win-win” outcome in upcoming US-China presidential talks, supporting trade-sensitive currencies. RBA Governor Bullock’s cautious, hawkish comments—highlighting sticky inflation, a shallower easing path than peers, and the need to balance jobs and prices—boosted the pair further, with markets expecting a rate pause. Today’s hotter-than-expected Q3 inflation data (1.3% QoQ, 3.2% YoY, core at 3.0%) pushed annual CPI to 3.5%, above the RBA’s target and ruling out near-term cuts. If the Fed delivers dovish guidance on Wednesday, AUDUSD bulls could see a third boost, targeting a retest of the September 30 high.

 
Suggested reading

The great dam removal, S. Morris, Financial Times (October 28, 2025)

What Every Investor Needs to Know About the Gold Rally, K. Fisher, NY Post (October 27, 2025)


Any opinions, news, research, analyses, prices or other information ("information") contained on this Blog, constitutes marketing communication and it has not been prepared in accordance with legal requirements designed to promote the independence of investment research. Further, the information contained within this Blog does not contain (and should not be construed as containing) investment advice or an investment recommendation, or an offer of, or solicitation for, a transaction in any financial instrument. LMAX Group has not verified the accuracy or basis-in-fact of any claim or statement made by any third parties as comments for every Blog entry.

LMAX Group will not accept liability for any loss or damage, including without limitation to, any loss of profit, which may arise directly or indirectly from use of or reliance on such information. No representation or warranty is given as to the accuracy or completeness of the above information. While the produced information was obtained from sources deemed to be reliable, LMAX Group does not provide any guarantees about the reliability of such sources. Consequently any person acting on it does so entirely at his or her own risk. It is not a place to slander, use unacceptable language or to promote LMAX Group or any other FX and CFD provider and any such postings, excessive or unjust comments and attacks will not be allowed and will be removed from the site immediately.

Day Image
28th October 2025 | view in browser
US-China thaw sparks risk-on rally

A recent “very successful” framework agreed by U.S. and Chinese officials for the upcoming Trump-Xi summit in South Korea has sparked optimism, lifting risk assets and raising hopes for a meaningful easing of trade tensions, with both leaders also planning follow-up talks in Washington and Beijing and even reviewing a global peace framework.


Performance chart 30day v. USD (%)
Performance Chart
 
 
Technical & fundamental highlights
EURUSD: technical overview

The Euro outlook remains constructive with higher lows sought out on dips in favor of the next major upside extension targeting the 2021 high at 1.2350. Setbacks should be exceptionally well supported ahead of 1.1300.

EURUSD Chart
R2 1.1779 - 1 October high -Strong
R1 1.1729 - 17 October high - Medium
S1 1.1542 - 9 October low - Medium
S2 1.1528 - 5 August low - Strong
EURUSD: fundamental overview

The ECB is confident in its “Goldilocks” scenario, expecting U.S. tariff effects to be short-lived and offset by Germany’s fiscal stimulus, supporting unchanged rates at the October 30 meeting, with President Lagarde likely to stress policy is “in a good place”—signaling stability, patience, and inflation largely under control—while cautioning on geopolitical risks; this ECB-Fed rate divergence and anticipated U.S.-China trade de-escalation should keep EURUSD bullish. German business sentiment improved in October, with the Ifo index rising to 88.4 (above forecasts) on stronger future expectations led by services, aligning with PMI data showing the fastest private-sector growth in over two years, though Q3 GDP likely stagnated, while consumer confidence continues a slow recovery with November GfK forecast at -22.0 (from -22.3), supported by better wage outlooks and inflation easing to 2.5%, despite ongoing household caution.

 
USDJPY: technical overview

There are signs of a meaningful top in place after the market put in a multi-year high in 2024. At this point, the door is now open for a deeper setback below the 2024 low at 139.58, exposing a retest of the 2023 low. Rallies should be well capped below 155.00.

USDJPY Chart
R2 154.80 - 12 February high - Strong
R1 153.28 - 10 October high - Medium
S1 149.38 - 17 October low - Medium
S2 149.03 - 6 October low - Strong
USDJPY: fundamental overview

The USDJPY rally, driven by Japan’s new PM Sanae Takaichi’s expected fiscal expansion and monetary stimulus echoing Abenomics—plus the U.S.-Japan yield gap—remains fragile. Upside is limited by risks including potential fiscal discipline from coalition partner Ishin, a hawkish Bank of Japan signal at its October 29–30 meeting amid cost-of-living pressures, and Fed rate cuts eroding the dollar’s edge. Near-term, yen bears dominate as Trump endorses Takaichi’s defense spending hike to 2% of GDP by next March, and improved US-China ties post-APEC boost risk appetite, pressuring the safe-haven yen.

 
AUDUSD: technical overview

There are signs of the potential formation of a longer-term base with the market trading down into a meaningful longer-term support zone. Only a monthly close below 0.5500 would give reason for rethink. A monthly close back above 0.7000 will take the big picture pressure off the downside and strengthen case for a bottom.

AUDUSD Chart
R2 0.6629 - 1 October high - Strong
R1 0.6573 - 10 October high - Medium
S1 0.6471 - 16 October low - Medium
S1 0.6440 - 14 October low - Strong
AUDUSD: fundamental overview

The Australian Dollar rallied yesterday on news of a successful US-China framework for their upcoming summit in South Korea, sparking a risk-on market mood. The pair gained further support from RBA Governor Bullock’s cautious comments ahead of the November meeting, where she stressed balancing employment and sticky inflation (with unemployment at 4.5% and core inflation at 2.7%), noting Australia’s milder tightening cycle could mean shallower easing. Markets viewed her hawkish tone—emphasizing new forecasts and potential action on inflation deviations—as reducing the odds of a near-term rate cut from 64% to 38%. If the Fed delivers dovish guidance on Wednesday, AUDUSD could see a third boost, targeting a retest of the September 30 lower high around 0.6629.

 
Suggested reading

Wall Street, China Trample On Dollarization & Federal Reserve, J. Tamny, Forbes (October 26, 2025)

The Red Flags That Signal the Faux Market Disruptors, S. McBride, RiskHedge (October 24, 2025)


Any opinions, news, research, analyses, prices or other information ("information") contained on this Blog, constitutes marketing communication and it has not been prepared in accordance with legal requirements designed to promote the independence of investment research. Further, the information contained within this Blog does not contain (and should not be construed as containing) investment advice or an investment recommendation, or an offer of, or solicitation for, a transaction in any financial instrument. LMAX Group has not verified the accuracy or basis-in-fact of any claim or statement made by any third parties as comments for every Blog entry.

LMAX Group will not accept liability for any loss or damage, including without limitation to, any loss of profit, which may arise directly or indirectly from use of or reliance on such information. No representation or warranty is given as to the accuracy or completeness of the above information. While the produced information was obtained from sources deemed to be reliable, LMAX Group does not provide any guarantees about the reliability of such sources. Consequently any person acting on it does so entirely at his or her own risk. It is not a place to slander, use unacceptable language or to promote LMAX Group or any other FX and CFD provider and any such postings, excessive or unjust comments and attacks will not be allowed and will be removed from the site immediately.