Day Image
20th May 2025 | view in browser
US Dollar dips as Fed stays cautious

The market has been focused on U.S. fiscal and bond market developments, with fading concerns over Moody’s downgrade and easing U.S.-China trade tensions reducing haven demand, while tariff-related worries subside.


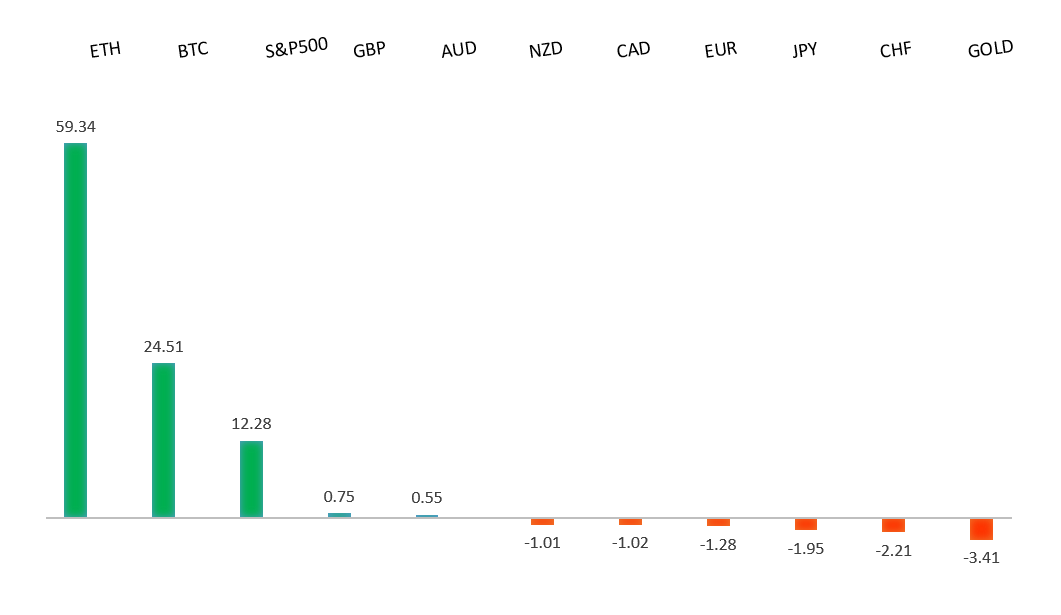
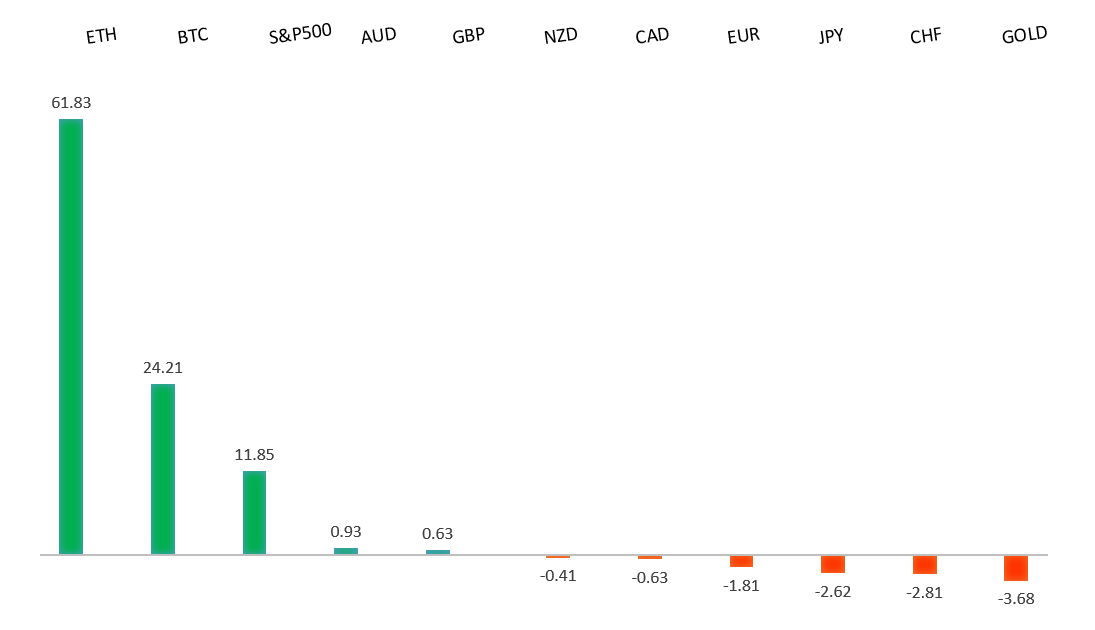
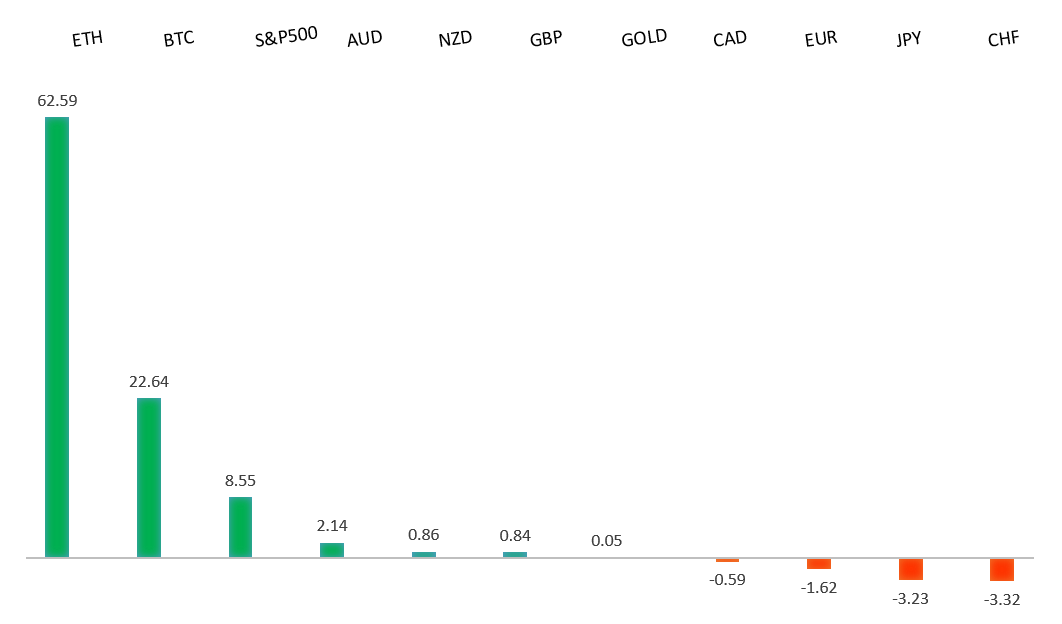
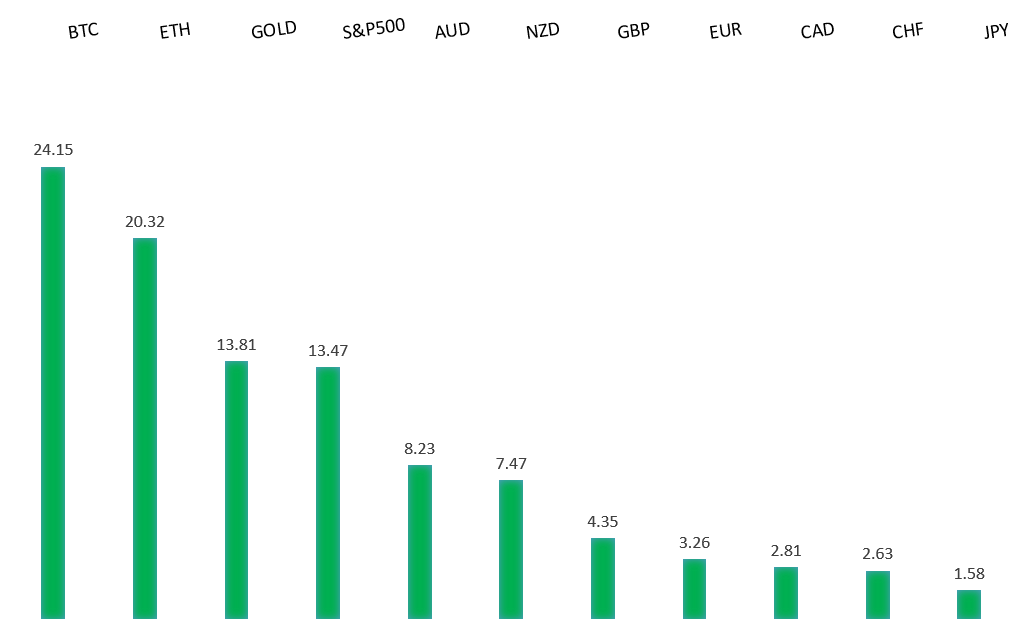
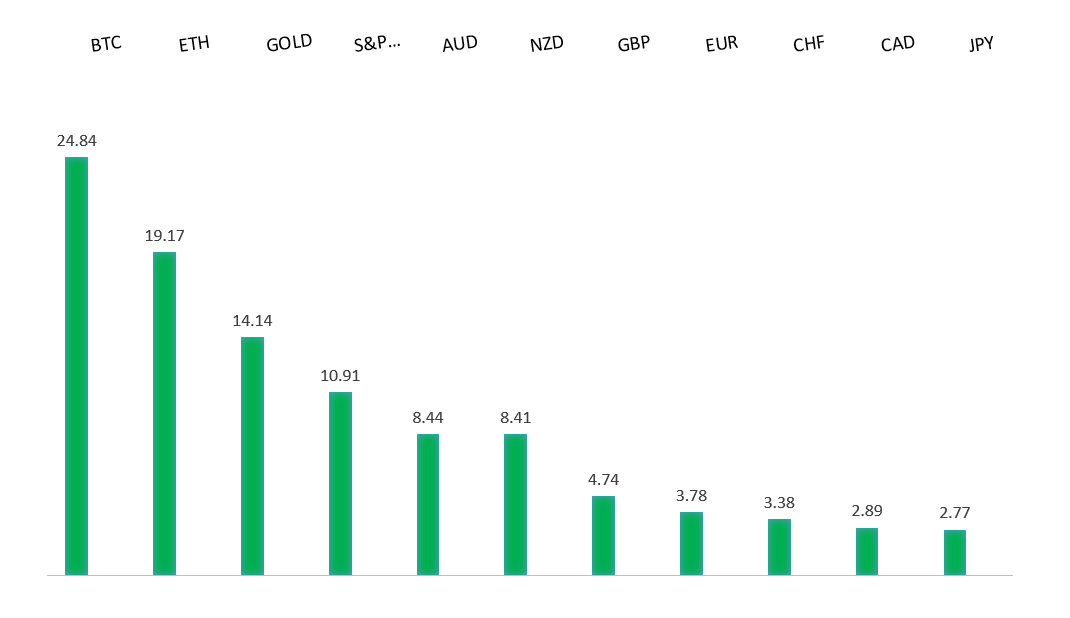
Performance chart 30day v. USD (%)
Performance Chart
 
 
Technical & fundamental highlights
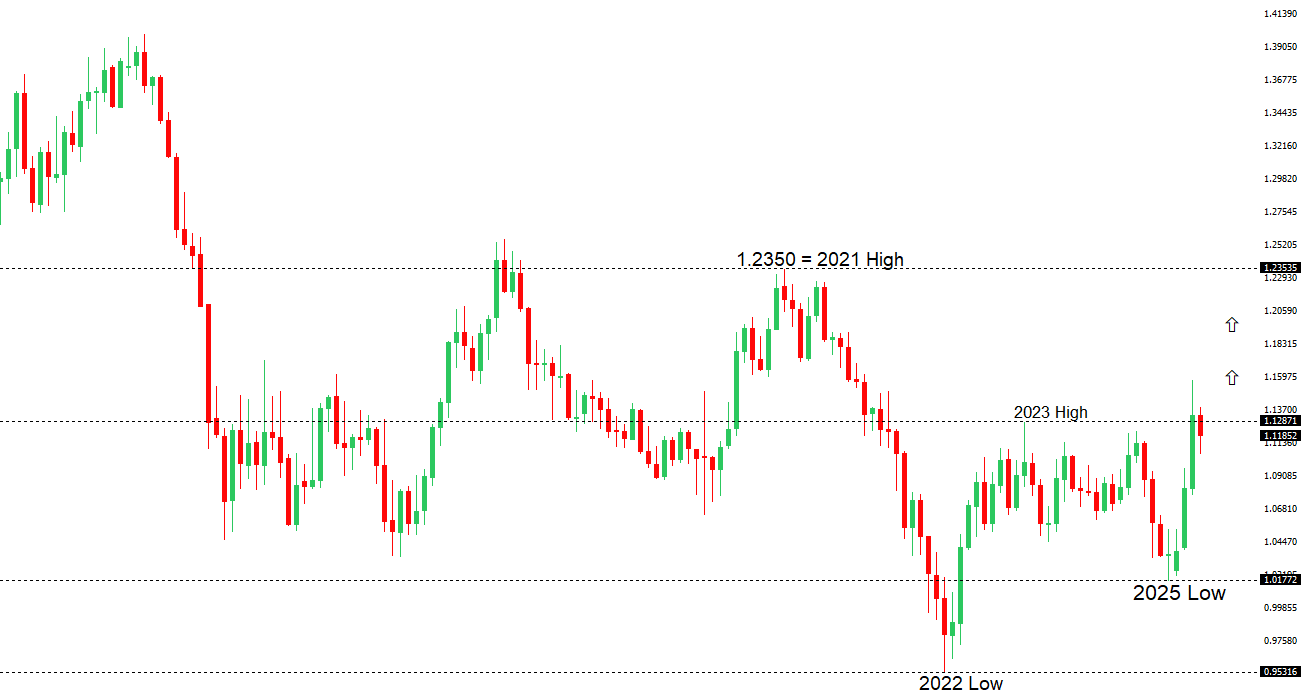
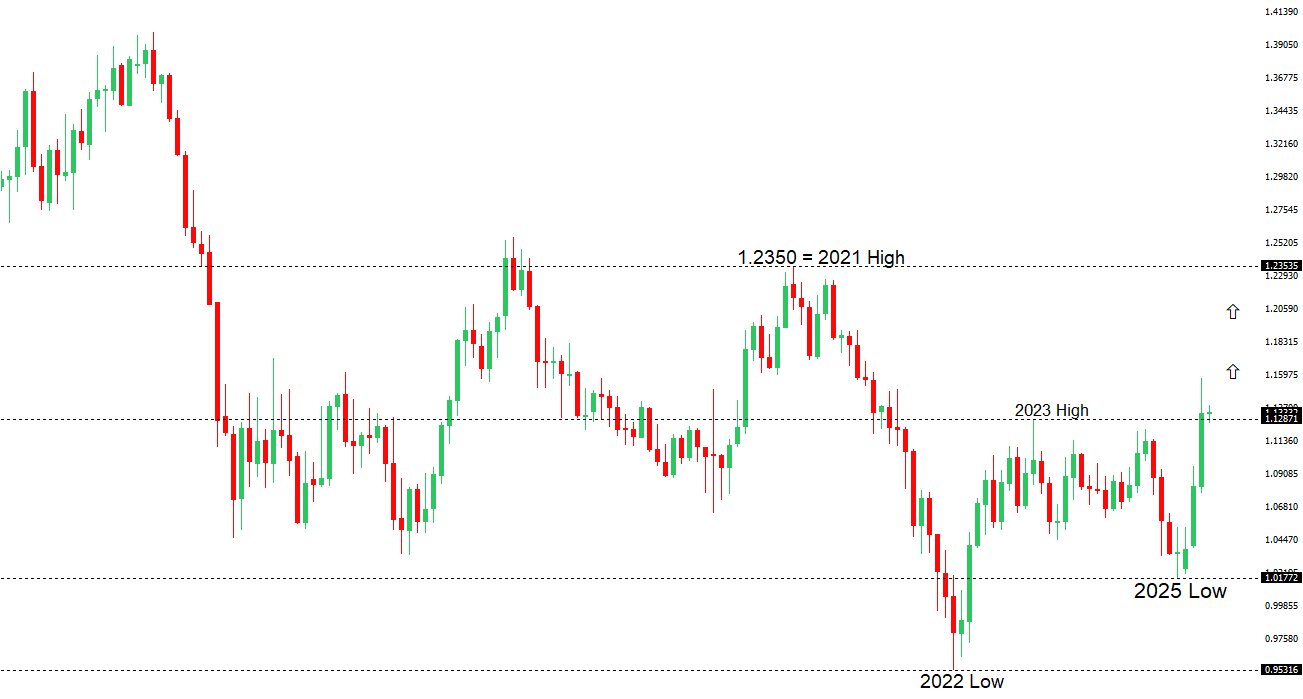
EURUSD: technical overview

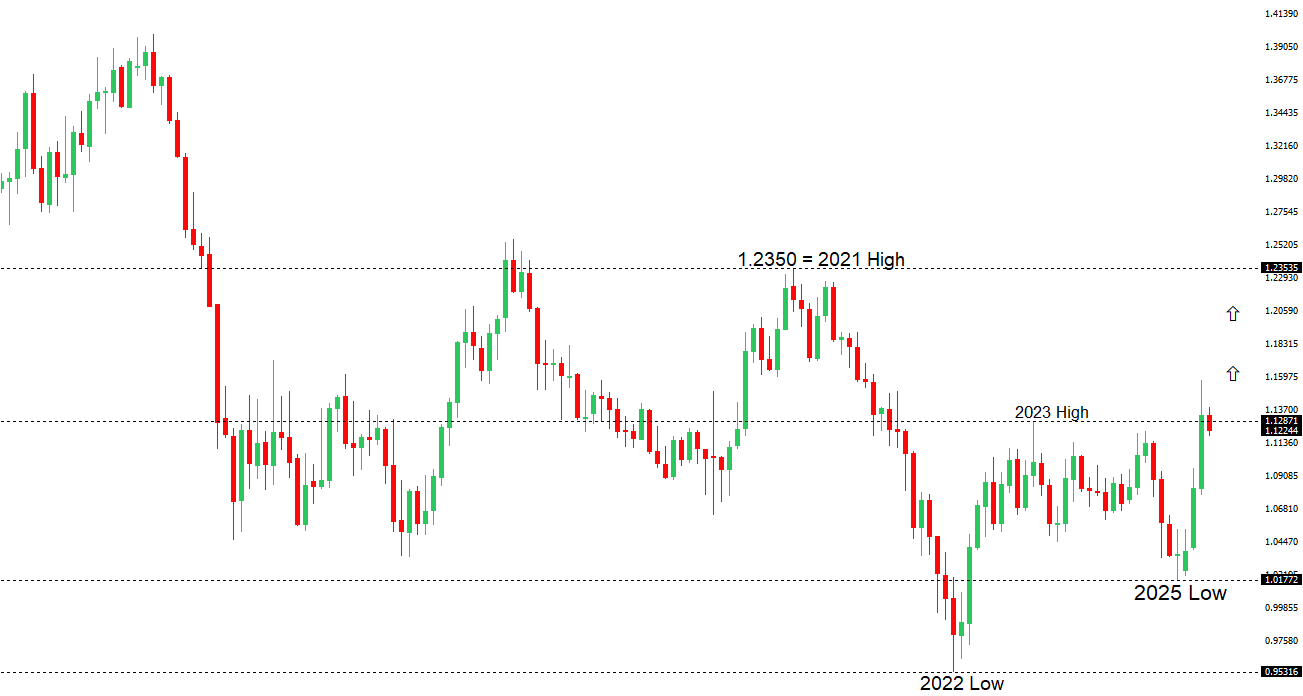
The Euro has finally broken out from a multi-month consolidation off a critical longer-term low. This latest push through the 2023 high lends further support to the case for a meaningful bottom, setting the stage for a bullish structural shift and the next major upside extension targeting the 2021 high at 1.2350. Setbacks should be exceptionally well supported below 1.1000.

EURUSD Chart
R2 1.1382 - 6 May high - Medium
R1 1.1293 - 9 May high - Medium
S1 1.1065 - 12 May low - Medium
S2 1.1000 - Psychological - Strong
EURUSD: fundamental overview

The ECB President’s view of the euro’s strength as an opportunity suggests tolerance for further appreciation, potentially nearing 1.20. The European Commission cut its eurozone GDP forecast to 0.9% for 2025 and 1.4% for 2026, citing U.S. tariffs, with inflation projected at 1.7% in 2026, possibly prompting ECB rate cuts. A new EU-UK deal boosting defense and trade eased post-Brexit tensions, while April inflation held steady at 2.2% and May’s Consumer Confidence is expected to rise.

 
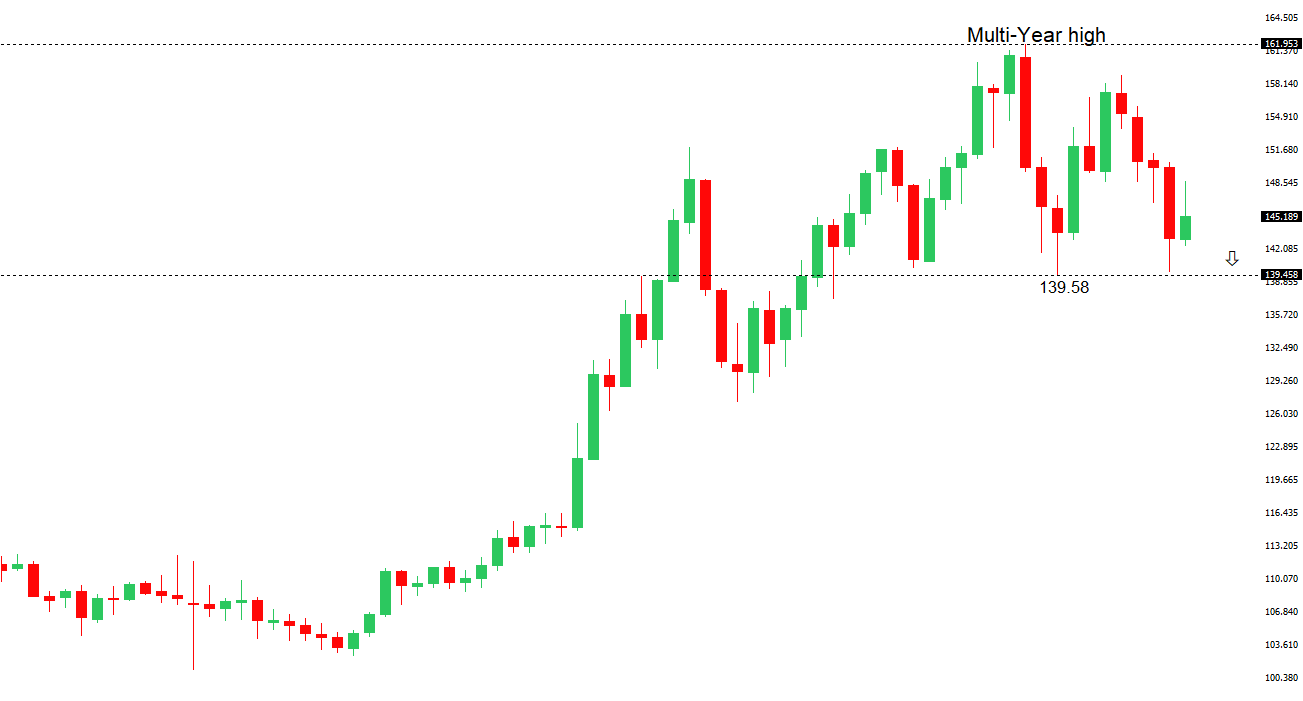
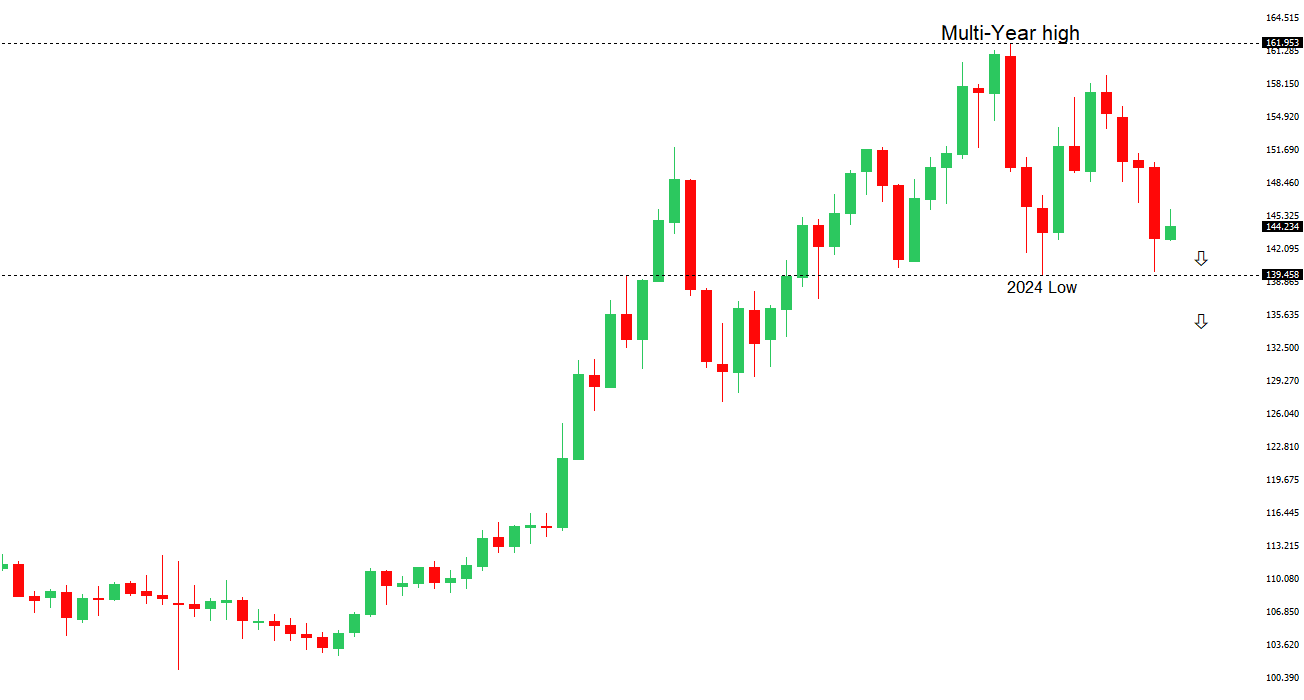
USDJPY: technical overview

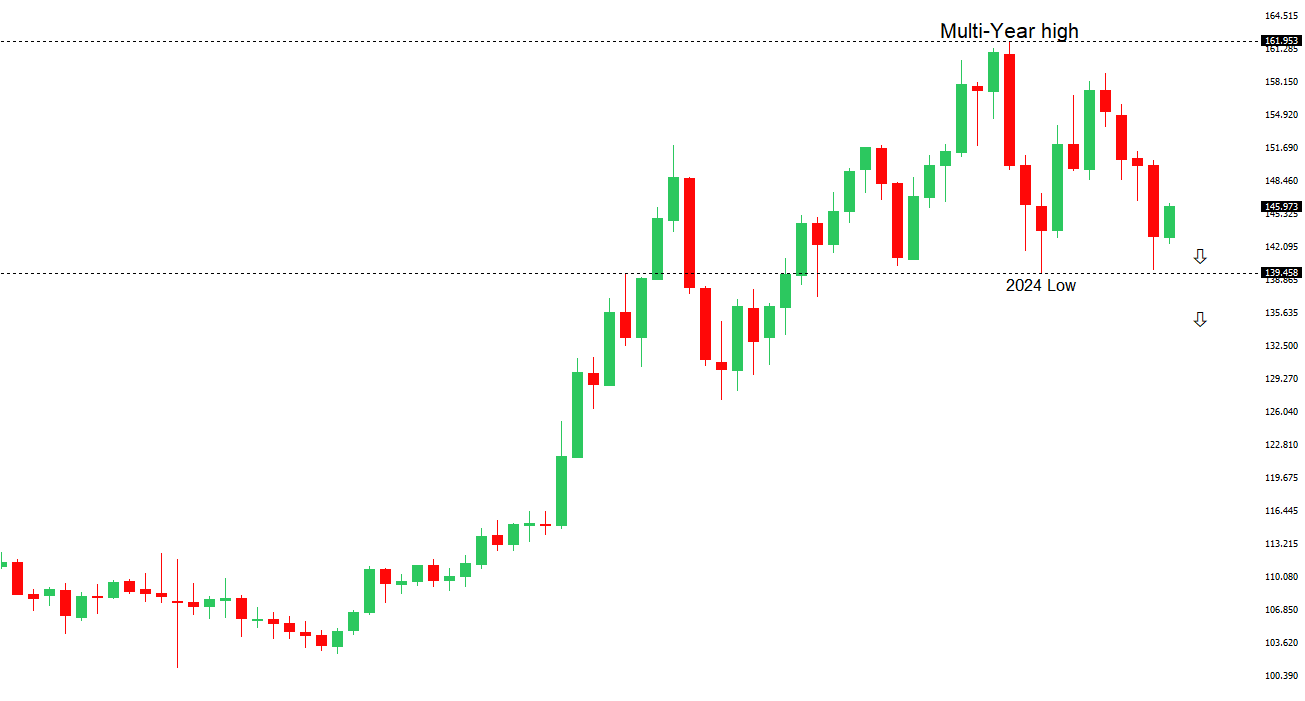
There are signs of a meaningful top in place after the market put in a multi-year high in 2024. At this point, the door is now open for a deeper setback below the 2024 low at 139.58 over the coming sessions exposing a retest of the 2023 low. Rallies should be well capped below 150.00.

USDJPY Chart
R2 150.00 - Psychological - Strong
R1 148.65 - 12 May high - Medium
S1 144.81 - 19 May low - Medium
S2 143.44 - 8 May low - Medium
USDJPY: fundamental overview

Speculation of Asian currency appreciation, especially the yen, is growing as Japan and South Korea discuss currency matters with the U.S. amid trade talks, with traders betting on stronger Asian currencies as part of U.S. trade agendas. Japan’s Finance Minister Kato will meet U.S. Treasury Secretary Bessent at the G7 meeting (May 20-22, 2025), while a weak GDP print and unresolved U.S. auto tariffs keep the BOJ cautious on rate hikes. A trade deal removing the 25% car tariff could shift focus to BOJ rate hikes, with upcoming inflation and trade data likely to complicate its stance.

 
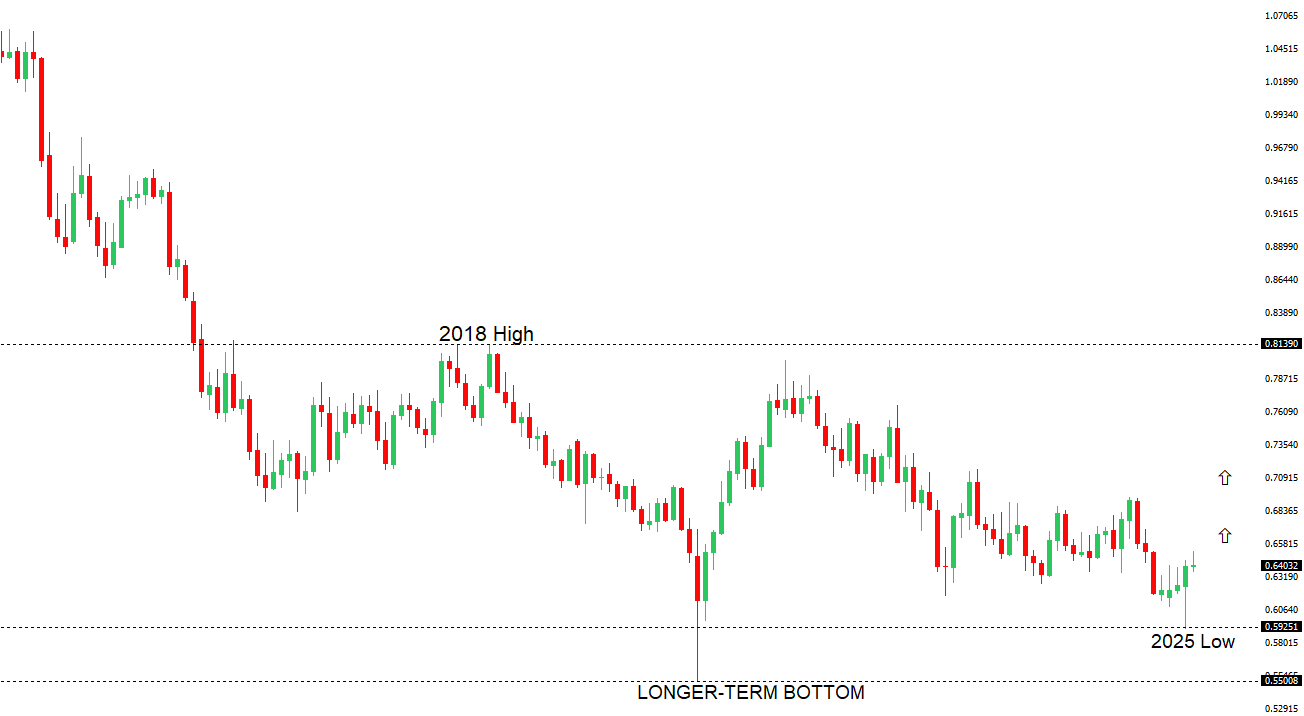
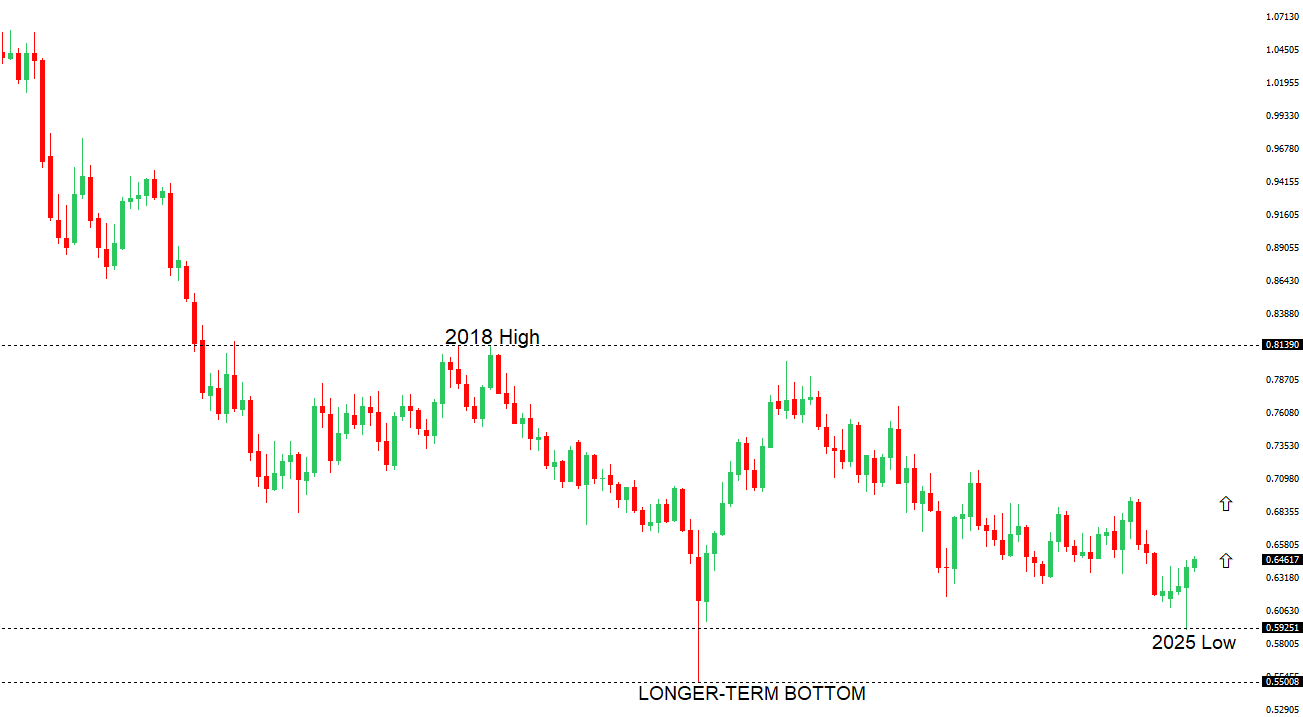
AUDUSD: technical overview

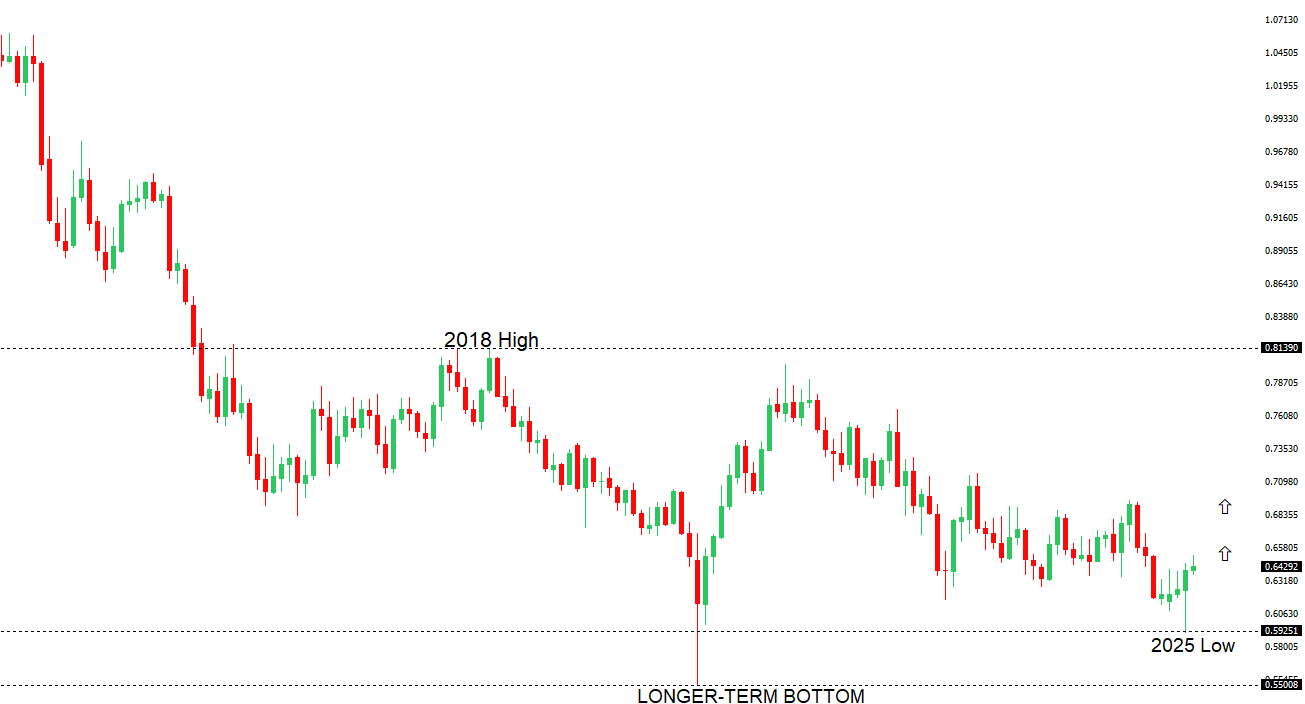
There are signs of the potential formation of a longer-term base with the market trading down into a meaningful longer-term support zone. Only a monthly close below 0.5500 would give reason for rethink. A monthly close back above 0.7000 will take the big picture pressure off the downside and strengthen case for a bottom.

AUDUSD Chart
R2 0.6550 - 25 November high - Strong
R1 0.6515 - 7 May/2025 high - Medium
S1 0.6344 - 24 April low - Medium
S1 0.6275 - 14 April low - Strong
AUDUSD: fundamental overview

Markets are nearly certain of a 25bps rate cut at the upcoming Reserve Bank of Australia meeting, lowering the Official Cash Rate (OCR) from 4.10% to 3.85%, despite strong job and wage data, as global growth concerns from the “Liberation Day” tariff shock and weak domestic indicators like retail sales and productivity outweigh labor market strength. Core inflation fell to 2.9% in Q1 2025, within the RBA’s 2-3% target for the first time since 2021, giving the RBA room to ease policy, though a hawkish cut is expected due to lingering inflation and labor market concerns, with markets pricing in two more cuts to reach 3.35% by year-end. A U.S.-China trade truce and potential currency appreciation in Asia, particularly in South Korea and Japan, could support a stronger Chinese yuan, boosting the Australian dollar as a yuan proxy, while a rising risk premium on U.S. assets may keep the U.S. dollar weak.

 
Suggested reading

Donald Trump Vs. Joe Biden: Who Was Better On Inflation?, J. Tamny, Forbes (May 18, 2025)

Trump’s Gulf gamble, A. Snyder, Axios (May 18, 2025)


Any opinions, news, research, analyses, prices or other information ("information") contained on this Blog, constitutes marketing communication and it has not been prepared in accordance with legal requirements designed to promote the independence of investment research. Further, the information contained within this Blog does not contain (and should not be construed as containing) investment advice or an investment recommendation, or an offer of, or solicitation for, a transaction in any financial instrument. LMAX Group has not verified the accuracy or basis-in-fact of any claim or statement made by any third parties as comments for every Blog entry.

LMAX Group will not accept liability for any loss or damage, including without limitation to, any loss of profit, which may arise directly or indirectly from use of or reliance on such information. No representation or warranty is given as to the accuracy or completeness of the above information. While the produced information was obtained from sources deemed to be reliable, LMAX Group does not provide any guarantees about the reliability of such sources. Consequently any person acting on it does so entirely at his or her own risk. It is not a place to slander, use unacceptable language or to promote LMAX Group or any other FX and CFD provider and any such postings, excessive or unjust comments and attacks will not be allowed and will be removed from the site immediately.

Day Image
19th May 2025 | view in browser
USD dips on Moody’s downgrade

The US Dollar weakened across major currencies following Moody’s downgrade of the US long-term issuer rating, citing a decade-long rise in government debt and interest payments, with US stock futures, particularly the Nasdaq falling sharply amid warnings of slower GDP growth due to tariffs.


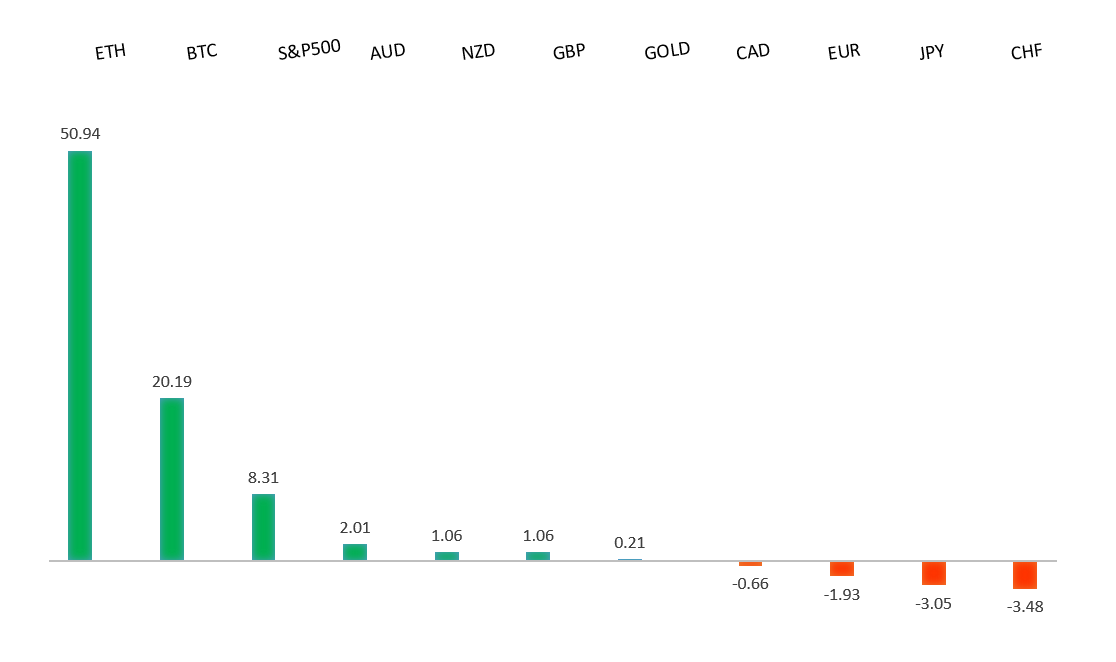
Performance chart 30day v. USD (%)
Performance Chart
 
 
Technical & fundamental highlights
EURUSD: technical overview

The Euro has finally broken out from a multi-month consolidation off a critical longer-term low. This latest push through the 2023 high lends further support to the case for a meaningful bottom, setting the stage for a bullish structural shift and the next major upside extension targeting the 2021 high at 1.2350. Setbacks should be exceptionally well supported below 1.1000.

EURUSD Chart
R1 1.1293 - 9 May high - Medium
R1 1.1266 - 14 May high - Medium
S1 1.1065 - 12 May low - Medium
S2 1.1000 - Psychological - Strong
EURUSD: fundamental overview

The narrowing Eur10yr-Us10yr yield spread has tempered EURUSD bullishness, with Trump’s tariffs fueling expectations of a dovish ECB, though recent US-EU tariff talk progress offers hope. ECB President Lagarde views the euro’s strength, driven by erratic US policies, as a chance to enhance Europe’s financial stability, advocating for a digital euro and deeper fiscal coordination to rival the dollar. Germany’s fiscal stimulus, backed by Chancellor Merz’s debt brake suspension, is set to bolster the euro, contrasting with US debt concerns, while the ECB prepares alternative scenarios for June 2025 projections to navigate trade uncertainties. Geopolitically, Russia and Ukraine plan a 1,000-prisoner swap but lack a ceasefire, with European powers coordinating with a hesitant US on further Russian sanctions. This week, key Eurozone data, including the Spring Economic Forecast, April ECB policy accounts, and May PMI and IFO releases, will shed light on the economic toll of US tariffs.

 
USDJPY: technical overview

There are signs of a meaningful top in place after the market put in a multi-year high in 2024. At this point, the door is now open for a deeper setback below the 2024 low at 139.58 over the coming sessions exposing a retest of the 2023 low. Rallies should be well capped below 150.00.

USDJPY Chart
R2 150.00 - Psychological - Strong
R1 148.65 - 12 May high - Medium
S1 145.00 - Figure - Medium
S1 144.81 - 19 May low - Medium
USDJPY: fundamental overview

Speculation is growing that the US is pushing for stronger Asian currencies, particularly the yen, as part of trade agreements, despite Japan’s Finance Minister Katsunobu Kato affirming with US Treasury Secretary Scott Bessent that exchange rates should be market-driven. This sentiment, fueled by ongoing US-Japan and US-South Korea currency talks, could lift the yen if trade deals progress, with markets eager for insights from Kato’s potential meeting with Bessent at the G7 Finance Ministers meeting (May 20-22). Japan’s Q1 2025 GDP contraction of -0.7% annualized has put the Bank of Japan on a cautious footing, with Credit Agricole’s Takuji Aida predicting no rate hikes until January 2026, pending July-September economic data and a possible technical recession. A successful trade negotiation removing the 25% US auto tariff, a key hurdle, could shift focus back to BOJ rate hikes, though Prime Minister Shigeru Ishiba and negotiator Ryosei Akazawa stress Japan won’t rush or compromise on national interests. This week, markets will scrutinize Japan’s April Trade Balance, March Core Machine Orders, May preliminary PMI Manufacturing and Services, and April inflation data, expected to remain elevated, for clues on economic resilience amid Trump’s tariffs.

 
AUDUSD: technical overview

There are signs of the potential formation of a longer-term base with the market trading down into a meaningful longer-term support zone. Only a monthly close below 0.5500 would give reason for rethink. A monthly close back above 0.7000 will take the big picture pressure off the downside and strengthen case for a bottom.

AUDUSD Chart
R2 0.6550 - 25 November high - Strong
R1 0.6515 - 7 May/2025 high - Medium
S1 0.6344 - 24 April low - Medium
S1 0.6275 - 14 April low - Strong
AUDUSD: fundamental overview

Markets are pricing in a near-certain 25bps rate cut at the RBA’s May 20, 2025, meeting, lowering the OCR from 4.10% to 3.85%, despite robust job and wage data, as the “Liberation Day” tariff shock and global growth concerns outweigh domestic labor market strength. Weak indicators like flat hours worked, retail sales, and household spending, coupled with disappointing productivity growth, suggest a less resilient economy, while core inflation’s drop to 2.9%—within the RBA’s 2-3% target for the first time since 2021—gives room for easing without reigniting price pressures, with two more cuts expected by year-end to reach 3.35%. The US-China trade truce bolsters Australia’s export sector, and a potential yuan appreciation, driven by Asian currency talks involving South Korea and Japan, could lift antipodean currencies, further supported by a weakened US dollar following Moody’s downgrade.

 
Suggested reading

What Higher Inflation Means for Stock/Bond Correlations, A. Arnott, Morningstar (May 6, 2025)

The US Dollar’s Fall from Grace, S. Dziubinski, Morningstar (May 16, 2025)


Any opinions, news, research, analyses, prices or other information ("information") contained on this Blog, constitutes marketing communication and it has not been prepared in accordance with legal requirements designed to promote the independence of investment research. Further, the information contained within this Blog does not contain (and should not be construed as containing) investment advice or an investment recommendation, or an offer of, or solicitation for, a transaction in any financial instrument. LMAX Group has not verified the accuracy or basis-in-fact of any claim or statement made by any third parties as comments for every Blog entry.

LMAX Group will not accept liability for any loss or damage, including without limitation to, any loss of profit, which may arise directly or indirectly from use of or reliance on such information. No representation or warranty is given as to the accuracy or completeness of the above information. While the produced information was obtained from sources deemed to be reliable, LMAX Group does not provide any guarantees about the reliability of such sources. Consequently any person acting on it does so entirely at his or her own risk. It is not a place to slander, use unacceptable language or to promote LMAX Group or any other FX and CFD provider and any such postings, excessive or unjust comments and attacks will not be allowed and will be removed from the site immediately.

Day Image
16th May 2025 | view in browser
Soft US data boosts rate cut bets

Soft US economic data, including weaker-than-expected April retail sales and PPI, fueled expectations of Fed rate cuts, with futures pricing in ~57bp by end-2025, boosting bonds and pressuring the US dollar


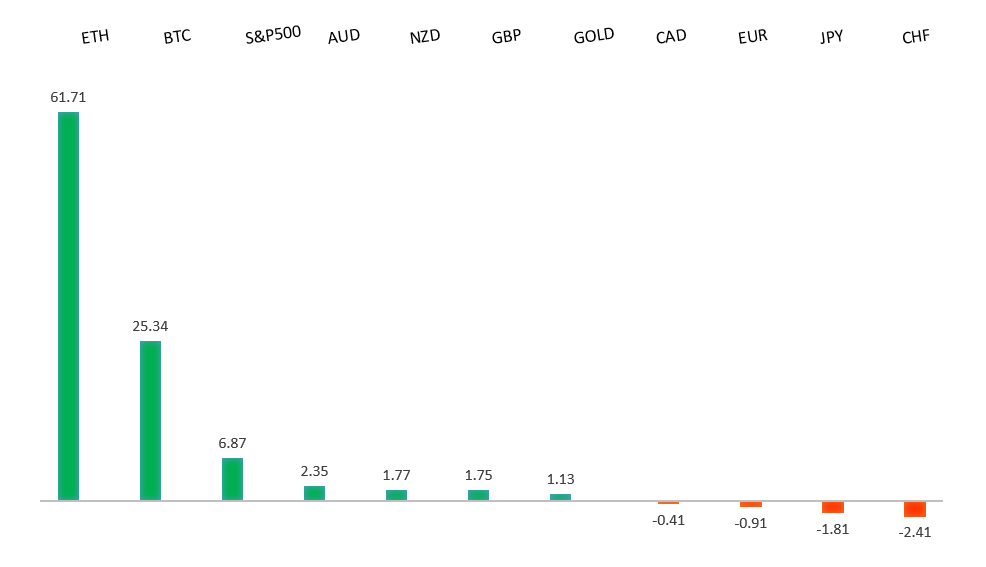
Performance chart 30day v. USD (%)
Performance Chart
 
 
Technical & fundamental highlights
EURUSD: technical overview

The Euro has finally broken out from a multi-month consolidation off a critical longer-term low. This latest push through the 2023 high lends further support to the case for a meaningful bottom, setting the stage for a bullish structural shift and the next major upside extension targeting the 2021 high at 1.2350. Setbacks should be exceptionally well supported below 1.1000.

EURUSD Chart
R1 1.1293 - 9 May high - Medium
R1 1.1266 - 14 May high - Medium
S1 1.1065 - 12 May low - Medium
S2 1.1000 - Psychological - Strong
EURUSD: fundamental overview

The Eurozone’s Q1 GDP growth was revised down to 0.3%, missing forecasts, yet marked five quarters of expansion, bolstered by robust March industrial production (2.6% MoM, 3.6% YoY) and steady employment gains (0.3% QoQ, 0.8% YoY), signaling cautious optimism that may lead ECB hawks to tread carefully on rate changes amid geopolitical trade risks. Meanwhile, the ECB targets early 2026 to finalize plans for a digital euro, aiming for a launch within two to three years to reduce reliance on U.S. digital payment systems, seen as a vulnerability after Trump’s Transatlantic alliance exit, while Russia-Ukraine ceasefire hopes dim as Putin ignores demands and Trump shows no sign of backing heavier sanctions.

 
USDJPY: technical overview

There are signs of a meaningful top in place after the market put in a multi-year high in 2024. At this point, the door is now open for a deeper setback below the 2024 low at 139.58 over the coming sessions exposing a retest of the 2023 low. Rallies should be well capped below 150.00.

USDJPY Chart
R2 150.00 - Psychological - Strong
R1 148.65 - 12 May high - Medium
S1 145.00 - Figure - Medium
S1 144.82 - 9 May low - Medium
USDJPY: fundamental overview

USDJPY is tracking the narrowing US-Japan 10-year yield gap, with Japan’s yields nearing two-week highs and US yields easing after data signaled slowing US growth. Japan’s Q1 GDP contracted more than expected at -0.7% annualized, raising concerns about a technical recession and likely delaying BOJ rate hikes until at least January, as trade talks with the US remain unresolved. Japan’s Finance Minister Kato aims to discuss currency volatility with US Treasury Secretary Bessent at the G7 meeting in Canada, while PM Ishiba targets a July trade deal but resists agreements retaining high US auto tariffs. A successful deal could revive BOJ hike expectations, while the yen may benefit if Asian currency appreciation talks reignite, amid a global slowdown boosting haven demand.

 
AUDUSD: technical overview

There are signs of the potential formation of a longer-term base with the market trading down into a meaningful longer-term support zone. Only a monthly close below 0.5500 would give reason for rethink. A monthly close back above 0.7000 will take the big picture pressure off the downside and strengthen case for a bottom.

AUDUSD Chart
R2 0.6550 - 25 November high - Strong
R1 0.6515 - 7 May/2025 high - Medium
S1 0.6344 - 24 April low - Medium
S1 0.6275 - 14 April low - Strong
AUDUSD: fundamental overview

The PBOC has kept the yuan fixing near 7.2, signaling reluctance to allow rapid appreciation that could hurt Chinese export competitiveness, with yesterday’s weaker fix marking the first in four sessions, tempering bullish bets on yuan proxies like antipodean currencies. However, a temporary US-China trade truce and talks of currency appreciation among Asian exporters like South Korea and Japan could ease China’s concerns, potentially allowing faster yuan gains and boosting the yen, won, and antipodeans. This truce also supports Australia’s export sector, while former RBA board member Warwick McKibbin urged the RBA to hold rates steady next week, citing Australia’s fiscal stimulus, strong employment, and inflation near target amid global uncertainty.

 
Suggested reading

The $40bn bitcoin bet, K. Martin, Financial Times (May 14, 2025)

The US Dollar’s Fall from Grace, Project Syndicate (May 14, 2025)


Any opinions, news, research, analyses, prices or other information ("information") contained on this Blog, constitutes marketing communication and it has not been prepared in accordance with legal requirements designed to promote the independence of investment research. Further, the information contained within this Blog does not contain (and should not be construed as containing) investment advice or an investment recommendation, or an offer of, or solicitation for, a transaction in any financial instrument. LMAX Group has not verified the accuracy or basis-in-fact of any claim or statement made by any third parties as comments for every Blog entry.

LMAX Group will not accept liability for any loss or damage, including without limitation to, any loss of profit, which may arise directly or indirectly from use of or reliance on such information. No representation or warranty is given as to the accuracy or completeness of the above information. While the produced information was obtained from sources deemed to be reliable, LMAX Group does not provide any guarantees about the reliability of such sources. Consequently any person acting on it does so entirely at his or her own risk. It is not a place to slander, use unacceptable language or to promote LMAX Group or any other FX and CFD provider and any such postings, excessive or unjust comments and attacks will not be allowed and will be removed from the site immediately.

Day Image
15th May 2025 | view in browser
Dollar wobbles as CPI softens and Fed eyes dovish tilt

Softer-than-expected US CPI data and expectations of converging economic growth and lower interest rates continue to hinder the dollar’s recovery.


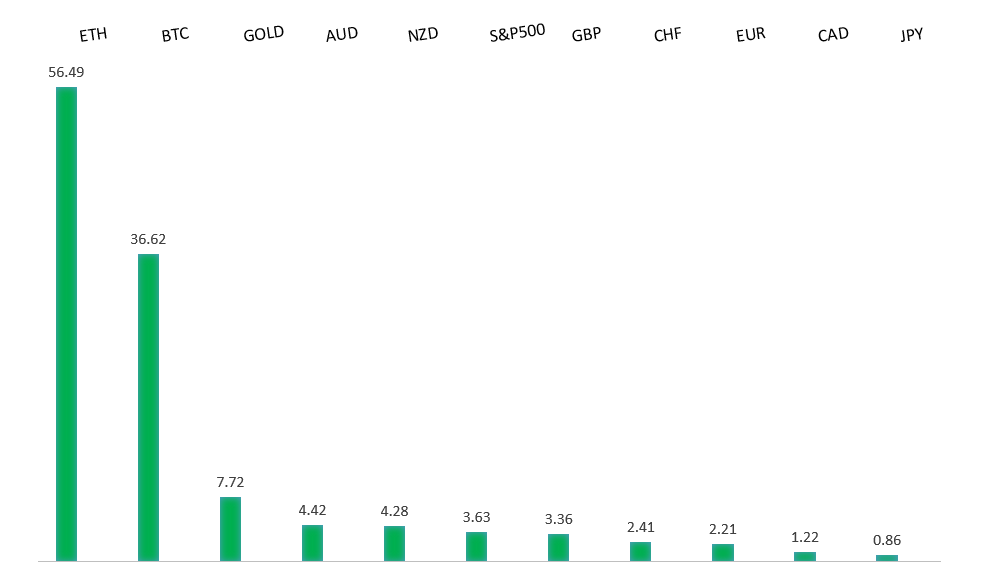
Performance chart 30day v. USD (%)
Performance Chart
 
 
Technical & fundamental highlights
EURUSD: technical overview

The Euro has finally broken out from a multi-month consolidation off a critical longer-term low. This latest push through the 2023 high lends further support to the case for a meaningful bottom, setting the stage for a bullish structural shift and the next major upside extension targeting the 2021 high at 1.2350. Setbacks should be exceptionally well supported below 1.1000.

EURUSD Chart
R1 1.1293 - 9 May high - Medium
R1 1.1243 - 12 May high - Medium
S1 1.1065 - 12 May low - Medium
S2 1.1000 - Psychological - Strong
EURUSD: fundamental overview

Recent softer-than-expected US CPI data has fueled speculation the Federal Reserve may adopt a more dovish stance, potentially weakening the dollar. Discussions between US and South Korean officials on exchange rate policies, alongside Japan’s finance minister’s comments on currency matters, have heightened market suspicions the Trump administration may favor a weaker dollar to facilitate trade deals, despite assurances from Treasury Secretary Bessent of a strong dollar policy. This perception, reinforced by earlier Asian currency strength in May, could prompt Asian nations with substantial dollar reserves—estimated at $2.5 trillion by Eurizon SLJ Capital’s Stephen Jen—to unwind positions or hedge, boosting demand for the euro, yen, and gold. Meanwhile, ECB supervisors are urging European banks to prepare for potential US dollar shortages under a less cooperative Trump administration, while German Chancellor Merz announced plans to boost defense spending to over €60 billion annually, aiming to transform Germany’s military into Europe’s strongest to counter Russian threats and support Ukraine.

 
USDJPY: technical overview

There are signs of a meaningful top in place after the market put in a multi-year high in 2024. At this point, the door is now open for a deeper setback below the 2024 low at 139.58 over the coming sessions exposing a retest of the 2023 low. Rallies should be well capped below 150.00.

USDJPY Chart
R2 150.00 - Psychological - Strong
R1 148.65 - 12 May high - Medium
S1 145.70 - 12 May low - Medium
S1 144.82 - 9 May low - Medium
USDJPY: fundamental overview

USDJPY is tracking the narrowing spread between US and Japanese 10-year yields, with Japan’s yields reaching a two-week high. ING analysts are predicting the yen will strengthen, eyeing USDJPY 140.00, as the Bank of Japan is expected to resume rate hikes by 25 basis points in Q3 while the Federal Reserve may restart rate cuts. Renewed talks between the US and Asian economies, including Japan and South Korea, on currency matters are reviving May’s “currency appreciation for trade accords” narrative, which previously drove the Bloomberg Asia Dollar Index higher, with the yen poised to benefit significantly. Japan’s Prime Minister Ishiba aims to secure a trade deal with the US by July, coinciding with the end of the “Liberation Day” tariff pause and Japan’s upper house elections, though high auto tariffs could delay an agreement to avoid political backlash. A successful trade deal could shift market focus back to BOJ rate hikes, as tariff uncertainties have been a key obstacle.

 
AUDUSD: technical overview

There are signs of the potential formation of a longer-term base with the market trading down into a meaningful longer-term support zone. Only a monthly close below 0.5500 would give reason for rethink. A monthly close back above 0.7000 will take the big picture pressure off the downside and strengthen case for a bottom.

AUDUSD Chart
R2 0.6550 - 25 November high - Strong
R1 0.6515 - 7 May/2025 high - Medium
S1 0.6344 - 24 April low - Medium
S1 0.6275 - 14 April low - Strong
AUDUSD: fundamental overview

The People’s Bank of China set the yuan’s daily reference rate at 7.1956, weaker than the Bloomberg survey’s expectation of 7.1842, marking the first such divergence since November and signaling cautious management to prevent rapid yuan appreciation that could harm export competitiveness amid economic stabilization efforts. This stance supported a rebound in offshore USDCNH and limited gains in antipodean currencies, though a temporary trade truce and renewed currency appreciation talks among Asian competitors like Japan and South Korea could ease China’s concerns, potentially allowing faster yuan appreciation and boosting antipodean currencies. In Australia, April’s employment surged by 89,000, with full-time jobs up 59,500, pushing the participation rate to a near-record 67.1% while unemployment held at 4.1%; despite consumer inflation expectations easing to 4.1%, persistent price pressures and global tariff risks may not deter the Reserve Bank of Australia from a likely rate cut on May 20, though robust jobs data could temper expectations for further easing this year.

 
Suggested reading

The $40bn bitcoin bet, K. Martin, Financial Times (May 14, 2025)

The China Deal Doesn’t Solve The Fed’s Problem, B. Dudley, Bloomberg (May 14, 2025)


Any opinions, news, research, analyses, prices or other information ("information") contained on this Blog, constitutes marketing communication and it has not been prepared in accordance with legal requirements designed to promote the independence of investment research. Further, the information contained within this Blog does not contain (and should not be construed as containing) investment advice or an investment recommendation, or an offer of, or solicitation for, a transaction in any financial instrument. LMAX Group has not verified the accuracy or basis-in-fact of any claim or statement made by any third parties as comments for every Blog entry.

LMAX Group will not accept liability for any loss or damage, including without limitation to, any loss of profit, which may arise directly or indirectly from use of or reliance on such information. No representation or warranty is given as to the accuracy or completeness of the above information. While the produced information was obtained from sources deemed to be reliable, LMAX Group does not provide any guarantees about the reliability of such sources. Consequently any person acting on it does so entirely at his or her own risk. It is not a place to slander, use unacceptable language or to promote LMAX Group or any other FX and CFD provider and any such postings, excessive or unjust comments and attacks will not be allowed and will be removed from the site immediately.

Day Image
14th May 2025 | view in browser
Cautious optimism fuels risk-on

In a landscape marked by cautious optimism, investors are gently embracing a risk-on sentiment, buoyed by progress in U.S. trade negotiations with key partners and a lack of immediate economic catalysts, though uncertainty lingers over the Trump administration’s tariff policies.


Performance chart 30day v. USD (%)
Performance Chart
 
 
Technical & fundamental highlights
EURUSD: technical overview

The Euro has finally broken out from a multi-month consolidation off a critical longer-term low. This latest push through the 2023 high lends further support to the case for a meaningful bottom, setting the stage for a bullish structural shift and the next major upside extension targeting the 2021 high at 1.2350. Setbacks should be exceptionally well supported below 1.1000.

EURUSD Chart
R1 1.1293 - 9 May high - Medium
R1 1.1243 - 12 May high - Medium
S1 1.1065 - 12 May low - Medium
S2 1.1000 - Psychological - Strong
EURUSD: fundamental overview

U.S. Treasury Secretary Bessent’s remarks suggest trade negotiations with the EU face challenges due to a “collective action problem,” hinting at stalled progress and a lower priority for a swift deal, possibly reflecting the Trump administration’s aggressive stance amid favorable market conditions. Despite this, Bessent remains optimistic about eventual resolution, while the administration’s “good cop, bad cop” tactic—marked by Trump’s bold tariff threats and Bessent’s calming assurances—signals uncertainty in policy direction, with markets wary of potential 1.5–2.0% GDP contraction if reciprocal tariffs resume. In Europe, Germany’s ZEW Expectations Index surged to 25.2 in May, buoyed by softened U.S.-China tariffs, ECB easing, and Chancellor Merz’s fiscal expansion plans, though the ZEW Current Situation Index at -82.0 underscores ongoing manufacturing and infrastructure challenges. Potential Istanbul peace talks involving Trump, Putin, and Zelensky could further reduce geopolitical risks, boosting the euro, while Russia faces additional EU sanctions if talks falter.

 
USDJPY: technical overview

There are signs of a meaningful top in place after the market put in a multi-year high in 2024. At this point, the door is now open for a deeper setback below the 2024 low at 139.58 over the coming sessions exposing a retest of the 2023 low. Rallies should be well capped below 150.00.

USDJPY Chart
R2 150.00 - Psychological - Strong
R1 148.65 - 12 May high - Medium
S1 145.70 - 12 May low - Medium
S1 144.82 - 9 May low - Medium
USDJPY: fundamental overview

A significant de-escalation in U.S.-China trade tensions, marked by a 90-day tariff pause, has invigorated global risk appetite, prompting traders to scale back record-high net yen longs (176,859 contracts, CFTC, May 6, 2025) and bolstering the Chinese yuan to a six-month high, reflecting optimism in China’s export prospects. Japan’s Finance Minister Kato’s planned currency discussions with U.S. Treasury Secretary Bessent at the G7 meeting in Canada, alongside softer U.S. CPI data and President Trump’s push for Federal Reserve rate cuts, have fueled hopes for yen stabilization, potentially allowing modest appreciation without undermining Japan’s export competitiveness. Prime Minister Ishiba aims for a U.S. trade agreement by July 2025, contingent on resolving auto tariffs, which could clear the path for Bank of Japan rate hikes, while Japan’s April PPI (4.0% YoY, 0.2% MoM) signals easing inflation, supporting the BOJ’s cautious stance amid strengthening Asia ex-Japan market share.

 
AUDUSD: technical overview

There are signs of the potential formation of a longer-term base with the market trading down into a meaningful longer-term support zone. Only a monthly close below 0.5500 would give reason for rethink. A monthly close back above 0.7000 will take the big picture pressure off the downside and strengthen case for a bottom.

AUDUSD Chart
R2 0.6550 - 25 November high - Strong
R1 0.6515 - 7 May/2025 high - Medium
S1 0.6344 - 24 April low - Medium
S1 0.6275 - 14 April low - Strong
AUDUSD: fundamental overview

The de-escalation of U.S.-China trade tensions, highlighted by a 90-day tariff pause, promises greater economic growth benefits for the global economy than for the U.S., as noted by Deutsche Bank’s George Saravelos, while the People’s Bank of China’s fixing of the yuan at a robust 7.1991 USDCNY—the strongest since April—bolsters the Chinese currency and supports antipodean currencies like the Australian dollar. In Australia, steady inflation within the Reserve Bank of Australia’s 2–3% target band fuels expectations for a rate cut on May 20, 2025, though reduced tariff pressures have scaled back anticipated 2025 cuts from 100 to 79 basis points, reflecting optimism in regional growth. The first quarter’s Wage Price Index rose 3.4% year-on-year, signaling persistent labor market tightness within RBA projections, while a 1.6% quarterly decline in home loan values underscores housing market challenges, reinforcing Governor Bullock’s commitment to data-driven policy in this dynamic trade environment.

 
Suggested reading

The $40bn bitcoin bet, K. Martin, Financial Times (May 14, 2025)

The Economics of Oil Refinery Shutting Down In California, M. Bernick, Forbes (May 13, 2025)


Any opinions, news, research, analyses, prices or other information ("information") contained on this Blog, constitutes marketing communication and it has not been prepared in accordance with legal requirements designed to promote the independence of investment research. Further, the information contained within this Blog does not contain (and should not be construed as containing) investment advice or an investment recommendation, or an offer of, or solicitation for, a transaction in any financial instrument. LMAX Group has not verified the accuracy or basis-in-fact of any claim or statement made by any third parties as comments for every Blog entry.

LMAX Group will not accept liability for any loss or damage, including without limitation to, any loss of profit, which may arise directly or indirectly from use of or reliance on such information. No representation or warranty is given as to the accuracy or completeness of the above information. While the produced information was obtained from sources deemed to be reliable, LMAX Group does not provide any guarantees about the reliability of such sources. Consequently any person acting on it does so entirely at his or her own risk. It is not a place to slander, use unacceptable language or to promote LMAX Group or any other FX and CFD provider and any such postings, excessive or unjust comments and attacks will not be allowed and will be removed from the site immediately.

Day Image
13th May 2025 | view in browser
Not completely out of the woods

The US-China tariff reduction to 30% and 10% for 90 days fueled risk-on sentiment in Asia-Pacific markets, lifting regional stocks, though Treasury yields and the US Dollar slightly retreated from Monday’s surge.


Performance chart 30day v. USD (%)
Performance Chart
 
 
Technical & fundamental highlights
EURUSD: technical overview

The Euro has finally broken out from a multi-month consolidation off a critical longer-term low. This latest push through the 2023 high lends further support to the case for a meaningful bottom, setting the stage for a bullish structural shift and the next major upside extension targeting the 2021 high at 1.2350. Setbacks should be exceptionally well supported below 1.1000.

EURUSD Chart
R1 1.1293 - 9 May high - Medium
R1 1.1243 - 12 May high - Medium
S1 1.1065 - 12 May low - Medium
S2 1.1000 - Psychological - Strong
EURUSD: fundamental overview

Easing US-China trade tensions have weakened the Dollar-bearish “Sell America” narrative, prompting EURUSD to retreat, though Europe’s unified fiscal push and a global capital shift bolster the Euro’s long-term strength. Trump’s tariff policies threaten the Dollar’s dominance, while markets trim ECB rate cut bets to 45 bps for 2025, with forecasts eyeing 1.75% by September as inflation dips. April’s grim ZEW surveys for Germany (-14) and the Eurozone (-18.5) highlight trade worries, with May’s outlook modestly improved but still cautious.

 
USDJPY: technical overview

There are signs of a meaningful top in place after the market put in a multi-year high in 2024. At this point, the door is now open for a deeper setback below the 2024 low at 139.58 over the coming sessions exposing a retest of the 2023 low. Rallies should be well capped below 150.00.

USDJPY Chart
R2 150.00 - Psychological - Strong
R1 148.65 - 12 May high - Medium
S1 145.70 - 12 May low - Medium
S1 144.82 - 9 May low - Medium
USDJPY: fundamental overview

The US-China trade de-escalation has boosted risk appetite, prompting traders to scale back record-high net long yen positions (176,859 contracts as of May 6), while Japan’s weak March data—0.4% MoM household spending, 2.1% YoY drop in earnings, and a Confidence Index fall to 31.2—may keep the BOJ on hold. Stalled US-Japan trade talks, with the US offering only to negotiate the 14% Japan-specific tariff, face hurdles, particularly on auto tariffs, though PM Ishiba targets a July deal. A successful agreement could shift focus to BOJ rate hikes, while Finance Minister Kato plans currency discussions with US Treasury at the G7.

 
AUDUSD: technical overview

There are signs of the potential formation of a longer-term base with the market trading down into a meaningful longer-term support zone. Only a monthly close below 0.5500 would give reason for rethink. A monthly close back above 0.7000 will take the big picture pressure off the downside and strengthen case for a bottom.

AUDUSD Chart
R2 0.6550 - 25 November high - Strong
R1 0.6515 - 7 May/2025 high - Medium
S1 0.6344 - 24 April low - Medium
S1 0.6275 - 14 April low - Strong
AUDUSD: fundamental overview

The US-China trade de-escalation lifted the US Dollar, paring AUDUSD gains, though reduced trade tensions favor Australia’s growth, per Deutsche Bank, with AUDUSD stabilizing as the PBOC fixed the yuan at USDCNY 7.1991. The RBA is expected to cut rates on May 20 as inflation holds steady, with 2025 rate cut bets trimmed to 82 bps from 100 bps, while Governor Bullock stresses data-driven policy. May’s consumer confidence rose to 92.1, buoyed by market rallies and rate cut hopes, but remains pessimistic below 100, while April’s business confidence (-1) and conditions (2) reflect cautious sentiment amid weak demand and rising costs.

 
Suggested reading

We’re all engaged in a strategic rivalry with China, R. Khalaf, Financial Times (May 12, 2025)

How the Dollar and Yuan Both Crash?, M. Shedlock, Mish Talk (May 12, 2025)


Any opinions, news, research, analyses, prices or other information ("information") contained on this Blog, constitutes marketing communication and it has not been prepared in accordance with legal requirements designed to promote the independence of investment research. Further, the information contained within this Blog does not contain (and should not be construed as containing) investment advice or an investment recommendation, or an offer of, or solicitation for, a transaction in any financial instrument. LMAX Group has not verified the accuracy or basis-in-fact of any claim or statement made by any third parties as comments for every Blog entry.

LMAX Group will not accept liability for any loss or damage, including without limitation to, any loss of profit, which may arise directly or indirectly from use of or reliance on such information. No representation or warranty is given as to the accuracy or completeness of the above information. While the produced information was obtained from sources deemed to be reliable, LMAX Group does not provide any guarantees about the reliability of such sources. Consequently any person acting on it does so entirely at his or her own risk. It is not a place to slander, use unacceptable language or to promote LMAX Group or any other FX and CFD provider and any such postings, excessive or unjust comments and attacks will not be allowed and will be removed from the site immediately.

Day Image
12th May 2025 | view in browser
US-China trade talk progress boosts sentiment

Asian markets have kicked the week off on a positive note, driven by progress in U.S.-China trade negotiations held in Switzerland. The White House signaled an upcoming trade agreement, with the U.S. Treasury Secretary and Chinese Vice Premier noting significant advancements, boosting regional market sentiment.


Performance chart 30day v. USD (%)
Performance Chart
 
 
Technical & fundamental highlights
EURUSD: technical overview

The Euro has finally broken out from a multi-month consolidation off a critical longer-term low. This latest push through the 2023 high lends further support to the case for a meaningful bottom, setting the stage for a bullish structural shift and the next major upside extension targeting the 2021 high at 1.2350. Setbacks should be exceptionally well supported below 1.1000.

EURUSD Chart
R1 1.1574 - 21 April/2025 high - Strong
R1 1.1382 - 2 May high - Medium
S1 1.1181 - 11 April low - Medium
S2 1.1148 - 3 April high - Strong
EURUSD: fundamental overview

Ukraine, supported by European nations and U.S. President Trump, has called for a 30-day unconditional ceasefire to facilitate peace negotiations, with new sanctions threatened against Russia if rejected. Russian President Putin proposed direct talks with Ukraine in Istanbul on May 15, and Ukraine’s President Zelenskiy, backed by Trump, will attend to pursue a potential ceasefire agreement. A de-escalation in the Russia-Ukraine conflict and U.S.-China trade tensions could boost Eurozone prospects, strengthening EURUSD. ECB officials, including Simkus and Rehn, anticipate weaker economic growth and support further rate cuts if disinflation persists, though hawkish members like Schnabel caution about inflation risks from rising protectionism and defense spending. Germany and Eurozone’s May ZEW Survey Expectations are expected to show cautious improvement after April’s sharp decline, driven by trade uncertainties, with Germany’s Current Situation Index reflecting slight gains from fiscal stimulus.

 
USDJPY: technical overview

There are signs of a meaningful top in place after the market put in a multi-year high in 2024. At this point, the door is now open for a deeper setback below the 2024 low at 139.58 over the coming sessions exposing a retest of the 2023 low. Rallies should be well capped below 150.00.

USDJPY Chart
R2 148.28 - 9 April high - Strong
R1 146.29 - 12 May high - Medium
S1 142.35 - 6 May low - Medium
S1 141.97 - 29 April low - Medium
USDJPY: fundamental overview

The Yen may remain sensitive to U.S.-China trade developments, with potential de-escalation reducing yen haven demand. Japan’s March nominal wages grew 2.1% year-on-year, below expectations, while real wages fell 2.1%, and April exports slowed to 2.3% growth, signaling caution for BOJ rate hikes amid trade uncertainties. Despite weak data, BOJ Governor Ueda emphasizes raising rates if economic conditions align, with inflation pressures persistent, but trade talks with the U.S. face challenges as Japan seeks tariff relief. U.S.-Japan negotiations have stalled, with the U.S. rejecting full tariff exemptions and focusing only on reducing Japan’s 14% specific tariff, while further talks are planned for May and a potential leaders’ meeting at the G7 summit in June. Japan’s PM Ishiba aims for a trade deal by July, coinciding with the end of a 90-day tariff pause and Japan’s elections.

 
AUDUSD: technical overview

There are signs of the potential formation of a longer-term base with the market trading down into a meaningful longer-term support zone. Only a monthly close below 0.5500 would give reason for rethink. A monthly close back above 0.7000 will take the big picture pressure off the downside and strengthen case for a bottom.

AUDUSD Chart
R2 0.6550 - 25 November high - Strong
R1 0.6515 - 7 May/2025 high - Medium
S1 0.6344 - 24 April low - Medium
S1 0.6275 - 14 April low - Strong
AUDUSD: fundamental overview

Iron ore prices are sliding toward the $80s per ton as China’s steel association confirms mill production cuts, pressuring the Australian dollar due to iron ore’s role as Australia’s key export. Markets are optimistic about U.S.-China trade de-escalation and a potential Russia-Ukraine ceasefire, boosting global equity futures and supporting antipodean currencies. With inflation within the RBA’s target range, a rate cut is anticipated at the May 20 meeting, though Governor Bullock stresses data-driven decisions amid tariff-related growth and inflation risks. Australia’s economic ties to China suggest a slowdown may overshadow inflation concerns, with Chinese exports potentially redirecting to Australia, while OIS markets project 93 basis points of rate cuts in 2025.

 
Suggested reading

Warren Buffett Versus American Capitalism, J. Authers, Bloomberg (May 9, 2025)

The Most Profitable Dividend Strategy Is the Simplest, S. Jakab, WSJ (May 9, 2025)


Any opinions, news, research, analyses, prices or other information ("information") contained on this Blog, constitutes marketing communication and it has not been prepared in accordance with legal requirements designed to promote the independence of investment research. Further, the information contained within this Blog does not contain (and should not be construed as containing) investment advice or an investment recommendation, or an offer of, or solicitation for, a transaction in any financial instrument. LMAX Group has not verified the accuracy or basis-in-fact of any claim or statement made by any third parties as comments for every Blog entry.

LMAX Group will not accept liability for any loss or damage, including without limitation to, any loss of profit, which may arise directly or indirectly from use of or reliance on such information. No representation or warranty is given as to the accuracy or completeness of the above information. While the produced information was obtained from sources deemed to be reliable, LMAX Group does not provide any guarantees about the reliability of such sources. Consequently any person acting on it does so entirely at his or her own risk. It is not a place to slander, use unacceptable language or to promote LMAX Group or any other FX and CFD provider and any such postings, excessive or unjust comments and attacks will not be allowed and will be removed from the site immediately.

Day Image
9th May 2025 | view in browser
Risk-on mood grows as trade deals take shape

Markets have been supported by Thursday’s tariff-related developments, particularly the U.S.-UK trade framework announcement, which sparked risk-on sentiment and reduced demand for safe-haven assets.


Performance chart 30day v. USD (%)
Performance Chart
 
 
Technical & fundamental highlights
EURUSD: technical overview

The Euro has finally broken out from a multi-month consolidation off a critical longer-term low. This latest push through the 2023 high lends further support to the case for a meaningful bottom, setting the stage for a bullish structural shift and the next major upside extension targeting the 2021 high at 1.2350. Setbacks should be exceptionally well supported below 1.1000.

EURUSD Chart
R1 1.1574 - 21 April/2025 high - Strong
R1 1.1382 - 2 May high - Medium
S1 1.1181 - 11 April low - Medium
S2 1.1148 - 3 April high - Strong
EURUSD: fundamental overview

Germany’s industrial production surged in March, rising 3% against a forecast of 0.8%, buoyed by strong factory orders and gains across sectors, especially autos. However, analysts caution looming U.S. tariffs and structural challenges may temper a sustained manufacturing recovery. Globally, markets are easing from a “Sell America” stance, with the dollar regaining ground against G10 and Asian currencies, though this is seen as a pause in a broader shift away from U.S. assets. Ray Dalio notes nations are forging alternative trade and geopolitical plans to reduce U.S. reliance, a trend reinforced by moves like the ASEAN+3 push for inter-regional trade and the UK-India trade deal. These developments, alongside potential dollar hedging by Asian nations, could weaken the dollar’s dominance over time, boosting demand for the euro and other major assets. Meanwhile, the ECB faces sobering warnings of Russian military risks, with experts urging Europe to accelerate its defense and fiscal spending plans within a four-to-five-year window.

 
USDJPY: technical overview

There are signs of a meaningful top in place after the market put in a multi-year high in 2024. At this point, the door is now open for a deeper setback below the 2024 low at 139.58 over the coming sessions exposing a retest of the 2023 low. Rallies should be well capped below 150.00.

USDJPY Chart
R2 148.28 - 9 April high - Strong
R1 146.19 - 9 May high - Medium
S1 142.35 - 6 May low - Medium
S1 141.97 - 29 April low - Medium
USDJPY: fundamental overview

Market optimism surged as risk-on sentiment took hold, fueled by Trump’s announcement of a US-UK trade framework, sparking hopes of more deals to come and prompting a retreat from haven bets. In Japan, March wage data showed nominal cash earnings rising 2.1% year-on-year, below the forecasted 2.5%, while real wages fell 2.1%, worse than expected, reinforcing the Bank of Japan’s cautious stance on rate hikes amid U.S. tariff uncertainties. The BOJ’s March meeting minutes revealed a divided board, with some members urging caution due to potential tariff-related economic risks, while others emphasized the need for nimble or decisive action, highlighting a lack of consensus on the timing of the next rate hike. Governor Ueda reiterated the BOJ will raise rates if economic projections hold, with inflation pressures remaining elevated. Japan’s trade talks with the U.S. are critical, but recent reports indicate the U.S. rejected Japan’s bid for a full tariff exemption, offering only to negotiate a reduction in the 14% Japan-specific tariff. Intensive talks are set for mid-May, with a possible leaders’ meeting at the G7 summit in June. The BOJ will release a summary of its April 30-May 1 meeting opinions on May 13.

 
AUDUSD: technical overview

There are signs of the potential formation of a longer-term base with the market trading down into a meaningful longer-term support zone. Only a monthly close below 0.5500 would give reason for rethink. A monthly close back above 0.7000 will take the big picture pressure off the downside and strengthen case for a bottom.

AUDUSD Chart
R2 0.6550 - 25 November high - Strong
R1 0.6515 - 7 May/2025 high - Medium
S1 0.6344 - 24 April low - Medium
S1 0.6275 - 14 April low - Strong
AUDUSD: fundamental overview

Australian dollar investors are closely watching the upcoming US-China trade talks in Switzerland, where Treasury Secretary Scott Bessent and China hawk Jamieson Greer will meet Vice Premier He Lifeng, with outcomes uncertain due to differing negotiating styles. In Australia, firm March CPI, robust Q1 PPI, and rising April consumer inflation expectations (4.2% from 3.6%) suggest the Reserve Bank of Australia may reconsider market expectations of 101bps in rate cuts for 2025, especially as Governor Bullock stresses a data-driven approach amid inflation within the target band. Markets anticipate an RBA rate cut at the May 20 meeting, but persistent inflationary signals could temper this outlook.

 
Suggested reading

Rising Gold Warns Markets: Fed Must Cut Reserve Rates Now, S. Forbes, Forbes (May 7, 2025)

Don’t Sell in May to Breakeven, Fisher Investments (May 7, 2025)


Any opinions, news, research, analyses, prices or other information ("information") contained on this Blog, constitutes marketing communication and it has not been prepared in accordance with legal requirements designed to promote the independence of investment research. Further, the information contained within this Blog does not contain (and should not be construed as containing) investment advice or an investment recommendation, or an offer of, or solicitation for, a transaction in any financial instrument. LMAX Group has not verified the accuracy or basis-in-fact of any claim or statement made by any third parties as comments for every Blog entry.

LMAX Group will not accept liability for any loss or damage, including without limitation to, any loss of profit, which may arise directly or indirectly from use of or reliance on such information. No representation or warranty is given as to the accuracy or completeness of the above information. While the produced information was obtained from sources deemed to be reliable, LMAX Group does not provide any guarantees about the reliability of such sources. Consequently any person acting on it does so entirely at his or her own risk. It is not a place to slander, use unacceptable language or to promote LMAX Group or any other FX and CFD provider and any such postings, excessive or unjust comments and attacks will not be allowed and will be removed from the site immediately.

Day Image
8th May 2025 | view in browser
Fed holds rates, flags tariff risks

The Fed’s recent decision to hold rates steady has highlighted tariff-driven risks, with the Fed Chair noting potential short-lived inflation but signaling a data-dependent stance, as markets price in 77 basis points of cuts by year-end, likely delayed until Q3 when tariff impacts become clearer.


Performance chart 30day v. USD (%)
Performance Chart
 
 
Technical & fundamental highlights
EURUSD: technical overview

The Euro has finally broken out from a multi-month consolidation off a critical longer-term low. This latest push through the 2023 high lends further support to the case for a meaningful bottom, setting the stage for a bullish structural shift and the next major upside extension targeting the 2021 high at 1.2350. Setbacks should be exceptionally well supported below 1.1000.

EURUSD Chart
R1 1.1574 - 21 April/2025 high - Strong
R1 1.1426 - 28 April high - Medium
S1 1.1266 - 1 May low - Medium
S2 1.1148 - 3 April high - Strong
EURUSD: fundamental overview

Asian currencies have paused their rally against the dollar, but the Bloomberg Asia Dollar Index’s clear uptrend suggests potential for further gains, possibly driving reserve flows into the Euro, Yen, and Gold as dollar-rich Asian nations look to hedge. Ukraine is contemplating shifting its currency, the hryvnia, from a dollar peg to a closer Euro alignment, reflecting its growing European ties and global trade fragmentation. In the Eurozone, March retail sales met expectations at -0.1% MoM and 1.6% YoY, signaling cautious consumer spending due to trade uncertainty and sluggish income growth, while Germany’s factory orders surged 3.6% MoM—exceeding the 1.3% forecast—hinting at industrial stabilization despite looming tariff threats, and its Construction PMI rose to 45.1, the highest in over two years, though still in contraction.

 
USDJPY: technical overview

There are signs of a meaningful top in place after the market put in a multi-year high in 2024. At this point, the door is now open for a deeper setback below the 2024 low at 139.58 over the coming sessions exposing a retest of the 2023 low. Rallies should be well capped below 150.00.

USDJPY Chart
R2 148.28 - 9 April high - Strong
R1 145.93 - 2 May high - Medium
S1 142.35 - 6 May low - Medium
S1 141.97 - 29 April low - Medium
USDJPY: fundamental overview

The Bank of Japan’s March meeting minutes revealed a lack of consensus on the timing of future rate hikes, with board members expressing caution over the potential negative impacts of U.S. tariffs on Japan’s economy, some urging nimble action and others suggesting a shift to a neutral stance after a possible hike. Governor Ueda reaffirmed the BOJ’s intent to raise borrowing costs if economic projections hold, despite elevated inflation pressures, with outcomes heavily dependent on U.S.-Japan trade talks, where the U.S. has rejected Japan’s full tariff exemption, offering only to negotiate a reduction in the 14% Japan-specific tariff, though negotiator Ryosei Akazawa remains hopeful for a June agreement. The BOJ will release a summary of opinions from its April 30-May 1 meeting on May 13, shedding further light on its stance amid ongoing trade uncertainties.

 
AUDUSD: technical overview

There are signs of the potential formation of a longer-term base with the market trading down into a meaningful longer-term support zone. Only a monthly close below 0.5500 would give reason for rethink. A monthly close back above 0.7000 will take the big picture pressure off the downside and strengthen case for a bottom.

AUDUSD Chart
R2 0.6550 - 25 November high - Strong
R1 0.6515 - 7 May/2025 high - Medium
S1 0.6344 - 24 April low - Medium
S1 0.6275 - 14 April low - Strong
AUDUSD: fundamental overview

We’ve seen some profit taking on the Australian Dollar as the U.S. and China begin trade war negotiations in Switzerland, with Treasury Secretary Bessent and China-skeptic negotiator Greer meeting Vice Premier He Lifeng. Outcomes remain uncertain and Trump, during David Perdue’s swearing-in as ambassador to China, denied U.S. initiation of talks and rejected tariff reductions. The ASEAN Plus Three group pledged to counter global trade shocks through increased regional trade, aligning with a broader Asian push to reduce dollar dependency, while the Bloomberg Asia Dollar Index’s pause doesn’t rule out further dollar hedging, potentially supporting the Yuan and, by extension, the Australian Dollar as a Yuan proxy. Certainly, China’s recent economic stimulus measures have been supporting the Australian Dollar as well.

 
Suggested reading

Can the office make a comeback?, Financial Times (May 6, 2025)

Exclusive look at May’s Disruption Investor, S. McBride, RiskHedge (May 5, 2025)


Any opinions, news, research, analyses, prices or other information ("information") contained on this Blog, constitutes marketing communication and it has not been prepared in accordance with legal requirements designed to promote the independence of investment research. Further, the information contained within this Blog does not contain (and should not be construed as containing) investment advice or an investment recommendation, or an offer of, or solicitation for, a transaction in any financial instrument. LMAX Group has not verified the accuracy or basis-in-fact of any claim or statement made by any third parties as comments for every Blog entry.

LMAX Group will not accept liability for any loss or damage, including without limitation to, any loss of profit, which may arise directly or indirectly from use of or reliance on such information. No representation or warranty is given as to the accuracy or completeness of the above information. While the produced information was obtained from sources deemed to be reliable, LMAX Group does not provide any guarantees about the reliability of such sources. Consequently any person acting on it does so entirely at his or her own risk. It is not a place to slander, use unacceptable language or to promote LMAX Group or any other FX and CFD provider and any such postings, excessive or unjust comments and attacks will not be allowed and will be removed from the site immediately.

Day Image
7th May 2025 | view in browser
US stock futures surge on Trump tariff shift

The US Dollar is holding steady as the day gets going, while U.S. equity futures are on the rise, buoyed by President Trump’s shift toward prescribing tariff levels and trade concessions to avoid higher duties, signaling a departure from prolonged negotiations.


Performance chart 30day v. USD (%)
Performance Chart
 
 
Technical & fundamental highlights
EURUSD: technical overview

The Euro has finally broken out from a multi-month consolidation off a critical longer-term low. This latest push through the 2023 high lends further support to the case for a meaningful bottom, setting the stage for a bullish structural shift and the next major upside extension targeting the 2021 high at 1.2350. Setbacks should be exceptionally well supported below 1.1000.

EURUSD Chart
R1 1.1574 - 21 April/2025 high - Strong
R1 1.1426 - 28 April high - Medium
S1 1.1266 - 1 May low - Medium
S2 1.1148 - 3 April high - Strong
EURUSD: fundamental overview

Friedrich Merz, after a surprising initial defeat in the first round of voting was elected Chancellor in a second round, though the earlier setback hints at coalition fractures that may challenge his policy mandate. The Euro remains stable, buoyed by a broader dollar unwind in Asian markets, with the Bloomberg Asia Dollar Index trending upward since April, potentially driving reserve flows to the Euro. Meanwhile, the EU braces for heightened trade tensions as Trump’s investigations may increase US tariffs on €549 billion of EU goods, up by €170 billion, even as transatlantic levy negotiations continue. Economic indicators loom, with Eurozone March retail sales expected to decline amid cautious consumer sentiment, trade disputes, and stubborn services inflation, while Germany’s March factory orders and April HCOB Construction PMI signal gradual stabilization, supported by debt brake reforms and anticipated infrastructure spending.

 
USDJPY: technical overview

There are signs of a meaningful top in place after the market put in a multi-year high in 2024. At this point, the door is now open for a deeper setback below the 2024 low at 139.58 over the coming sessions exposing a retest of the 2023 low. Rallies should be well capped below 150.00.

USDJPY Chart
R2 148.28 - 9 April high - Strong
R1 145.93 - 2 May high - Medium
S1 142.35 - 6 May low - Medium
S1 141.97 - 29 April low - Medium
USDJPY: fundamental overview

USDJPY marked its third consecutive decline as Asian currencies, led by an undervalued Chinese Yuan, strengthen against the dollar, fueling speculation of a broader currency appreciation tied to a potential trade accord. The Bank of Japan, grappling with global trade uncertainties, delayed its 2% inflation target, slashed growth forecasts to 0.5%, and pushed back rate hike expectations, though Governor Ueda clarified that this delay doesn’t preclude future hikes, with Bloomberg Economics anticipating a BOJ rate increase to 1.25% by next year. Meanwhile, U.S.-Japan trade talks falter as the U.S. rejects Japan’s full tariff exemption, offering only to negotiate a reduction in the 14% Japan-specific tariff, raising concerns about broader market turbulence if the U.S. takes a hardline stance with allies. On the data front, April’s finalized PMI Composite and Services PMI were slightly revised upward to 51.2 and 52.4, respectively, while markets await the FOMC meeting and Fed Chair Powell’s guidance, with U.S. OIS markets pricing in 79 basis points of rate cuts for 2025.

 
AUDUSD: technical overview

There are signs of the potential formation of a longer-term base with the market trading down into a meaningful longer-term support zone. Only a monthly close below 0.5500 would give reason for rethink. A monthly close back above 0.7000 will take the big picture pressure off the downside and strengthen case for a bottom.

AUDUSD Chart
R2 0.6550 - 25 November high - Strong
R1 0.6515 - 7 May/2025 high - Medium
S1 0.6344 - 24 April low - Medium
S1 0.6275 - 14 April low - Strong
AUDUSD: fundamental overview

The Australian dollar rose following news of thawing trade tensions between its key partners, the U.S. and China, as Treasury Secretary Bessent and trade hawk Jamieson Greer prepare to negotiate with China’s Vice Premier He Lifeng in Switzerland, though outcomes remain uncertain. China’s recent measures, including cuts to its policy rate and reserve ratio, alongside a strengthening Yuan breaching its 200-day moving average, further bolstered the antipodeans, with the Australian dollar gaining as a Yuan proxy amid talks of Asian currency appreciation for trade deals. Meanwhile, markets eye the upcoming Fed meeting, where solid payrolls and ISM Services data may lead Powell to maintain rates despite Trump’s pressure, though tariff-related economic risks and a potential peak in U.S. data—evidenced by expected declines in sectors like leisure, trade, and construction—could eventually push the Fed toward rate cuts, potentially weakening the dollar further.

 
Suggested reading

Trump’s Dollar Grievances Eerily Echo Nixon’s, J. Calhoun, Alhambra (May 4, 2025)

Macroeconomists Despise Macroeconomics, J. Tamny, RCM (May 6, 2025)


Any opinions, news, research, analyses, prices or other information ("information") contained on this Blog, constitutes marketing communication and it has not been prepared in accordance with legal requirements designed to promote the independence of investment research. Further, the information contained within this Blog does not contain (and should not be construed as containing) investment advice or an investment recommendation, or an offer of, or solicitation for, a transaction in any financial instrument. LMAX Group has not verified the accuracy or basis-in-fact of any claim or statement made by any third parties as comments for every Blog entry.

LMAX Group will not accept liability for any loss or damage, including without limitation to, any loss of profit, which may arise directly or indirectly from use of or reliance on such information. No representation or warranty is given as to the accuracy or completeness of the above information. While the produced information was obtained from sources deemed to be reliable, LMAX Group does not provide any guarantees about the reliability of such sources. Consequently any person acting on it does so entirely at his or her own risk. It is not a place to slander, use unacceptable language or to promote LMAX Group or any other FX and CFD provider and any such postings, excessive or unjust comments and attacks will not be allowed and will be removed from the site immediately.