| ||
| 28th July 2026 | view in browser | ||
| Oil tumbles, but markets refuse to chase the move | ||
| Markets head into Tuesday cautiously, with the sharp drop in oil failing to spark a broader risk-on move as investors remain focused on the Federal Reserve and lingering geopolitical uncertainty. | ||
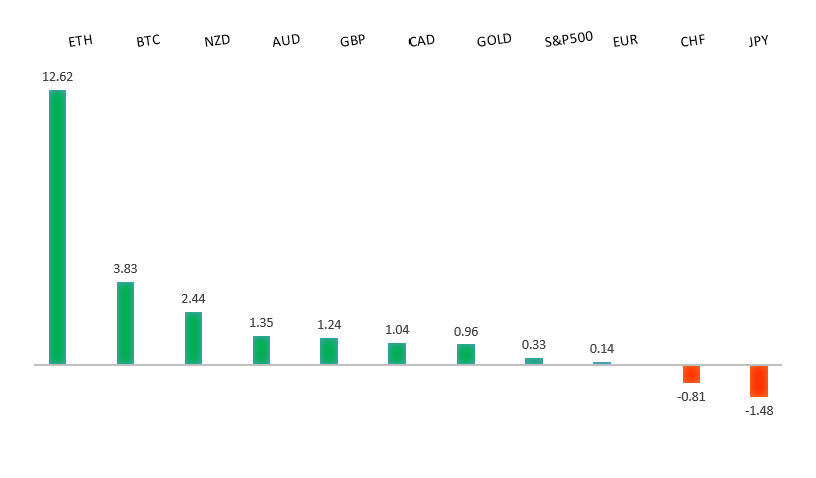
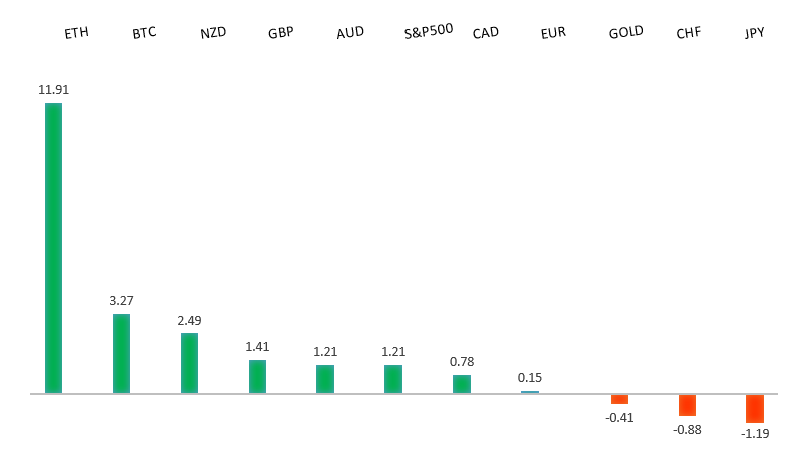
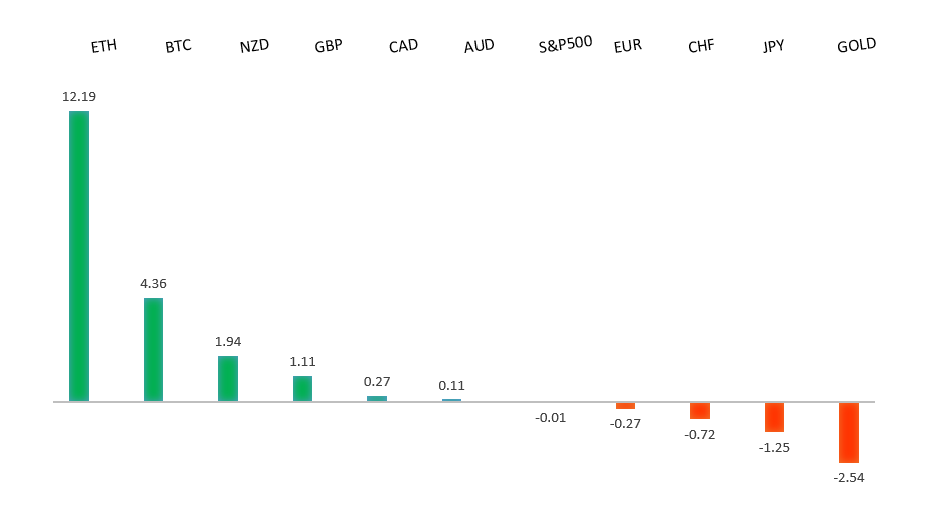
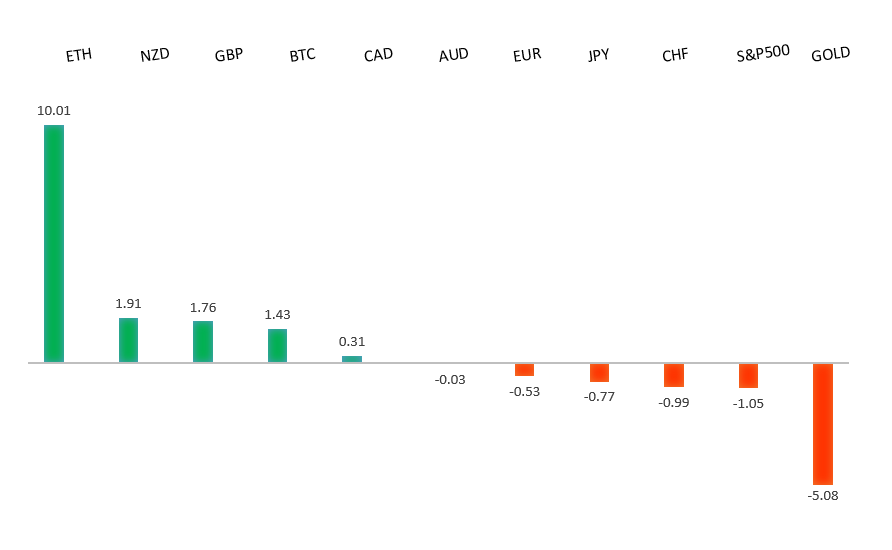
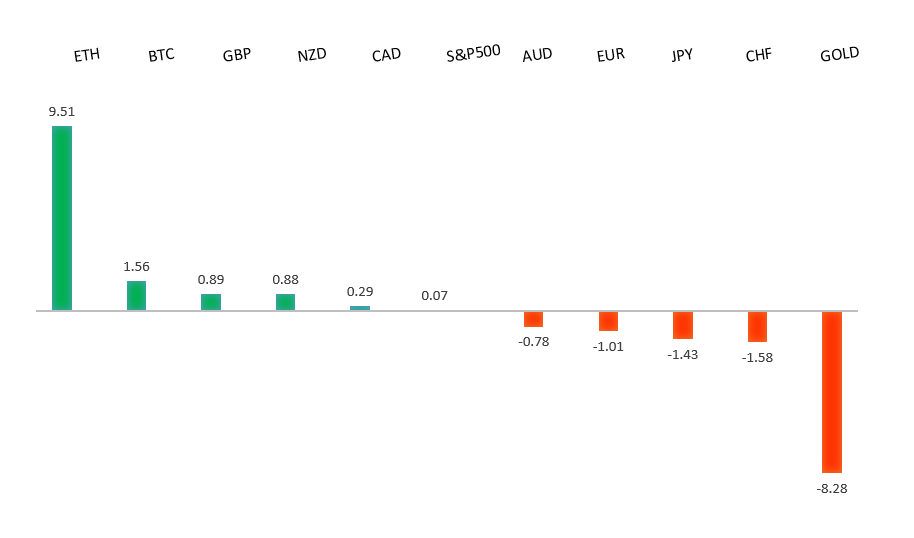
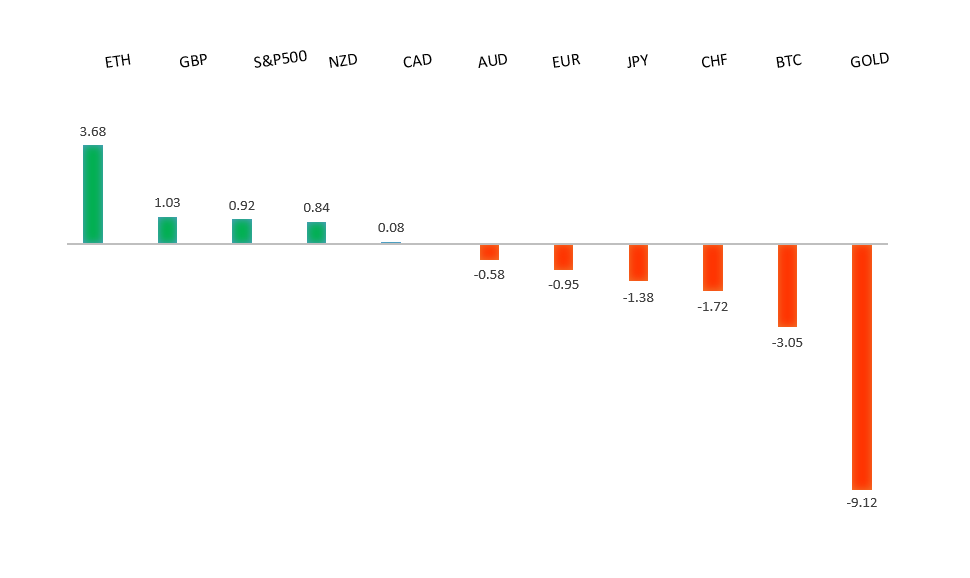
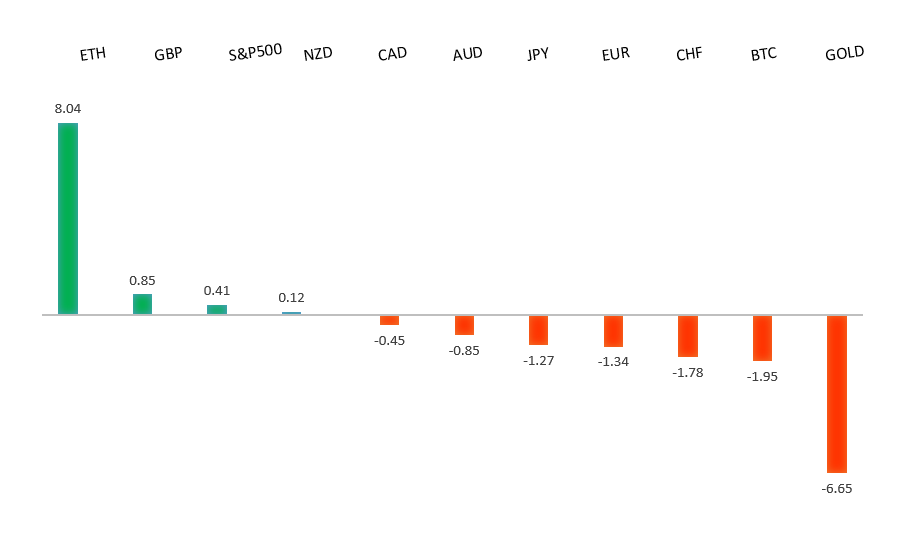
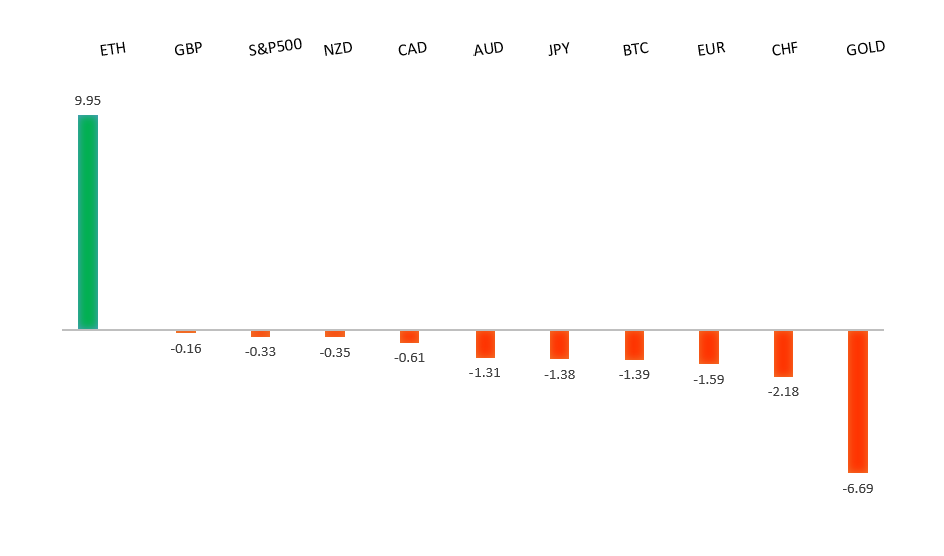
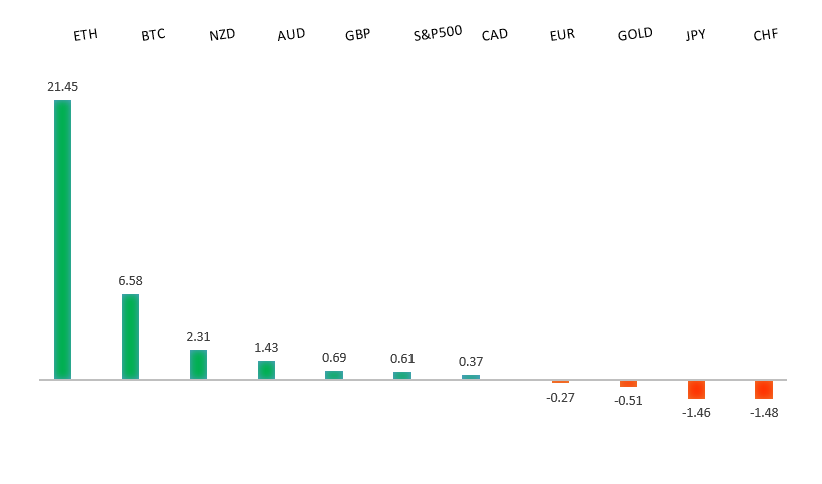
| Performance chart 30day v. USD (%) | ||
 | ||
| Technical & fundamental highlights | ||
| EURUSD: technical overview | ||
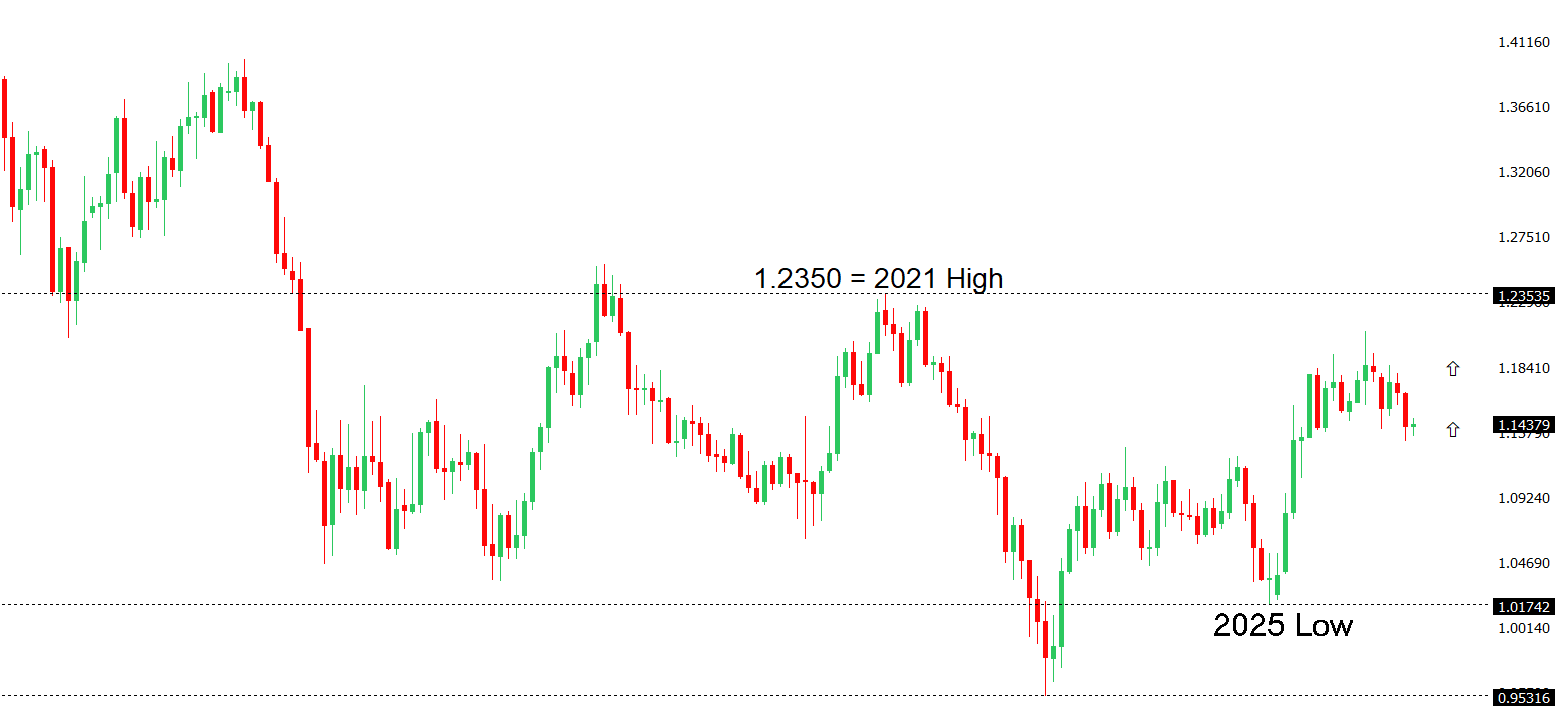
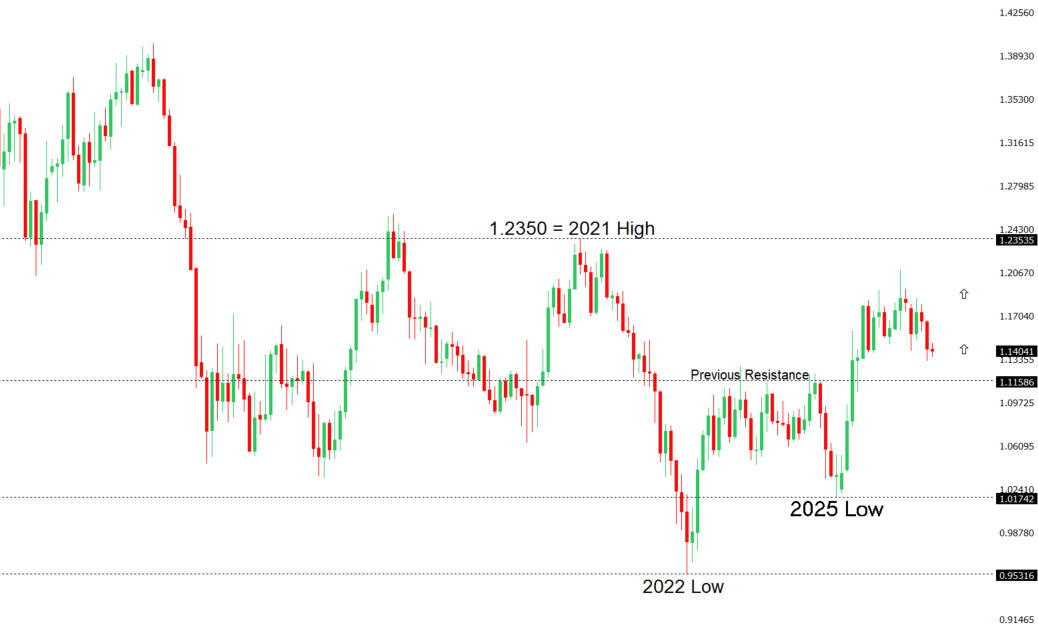
| The Euro outlook remains constructive with higher lows sought out on dips in favor of the next major upside extension targeting the 2021 high at 1.2350. Setbacks should be exceptionally well supported ahead of 1.1300. | ||
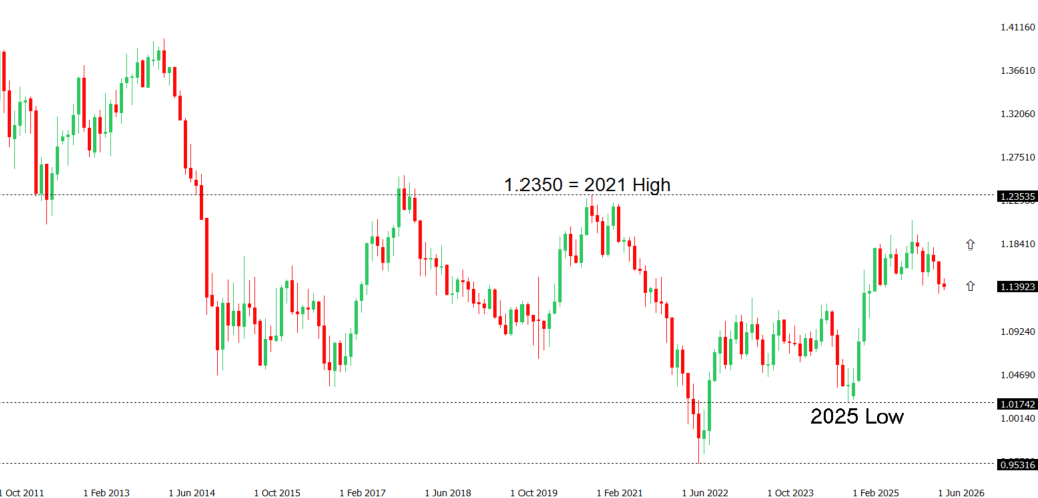 | ||
| R2 1.1529 - 18 June high - Medium R1 1.1483 - 15 July high - Medium S1 1.1325 - 24 June/2026 low - Medium S2 1.1300 - Figure - Medium | ||
| EURUSD: fundamental overview | ||
| The euro remains under modest pressure as investors continue to balance a cautious European Central Bank against a broadly resilient US Dollar and lingering geopolitical uncertainty. While the ECB left interest rates unchanged after June’s hike, policymakers reiterated that inflation risks remain tilted higher because of elevated energy prices while emphasizing that future policy decisions will remain data dependent. At the same time, expectations that the Federal Reserve could still tighten policy further, with markets assigning meaningful odds of another rate hike in the months ahead, continue to underpin the Dollar and limit EURUSD upside. Developments in the Middle East remain a key driver for the single currency, with ongoing US military action against Iran and concerns over regional stability keeping safe-haven demand for the Dollar elevated, although hopes for de-escalation and lower oil prices have helped stabilize sentiment at the start of the week. Meanwhile, renewed US tariff proposals targeting major trading partners, including the European Union, have added another layer of uncertainty for the euro area outlook, while Germany’s latest Ifo survey reinforced that the economy retains recovery potential but remains vulnerable to persistently high energy costs if geopolitical tensions continue to disrupt global oil markets. Looking ahead, markets will closely watch incoming US data, including consumer confidence, alongside any fresh headlines from the Middle East for near-term direction in EURUSD. | ||
| GBPUSD: technical overview | ||
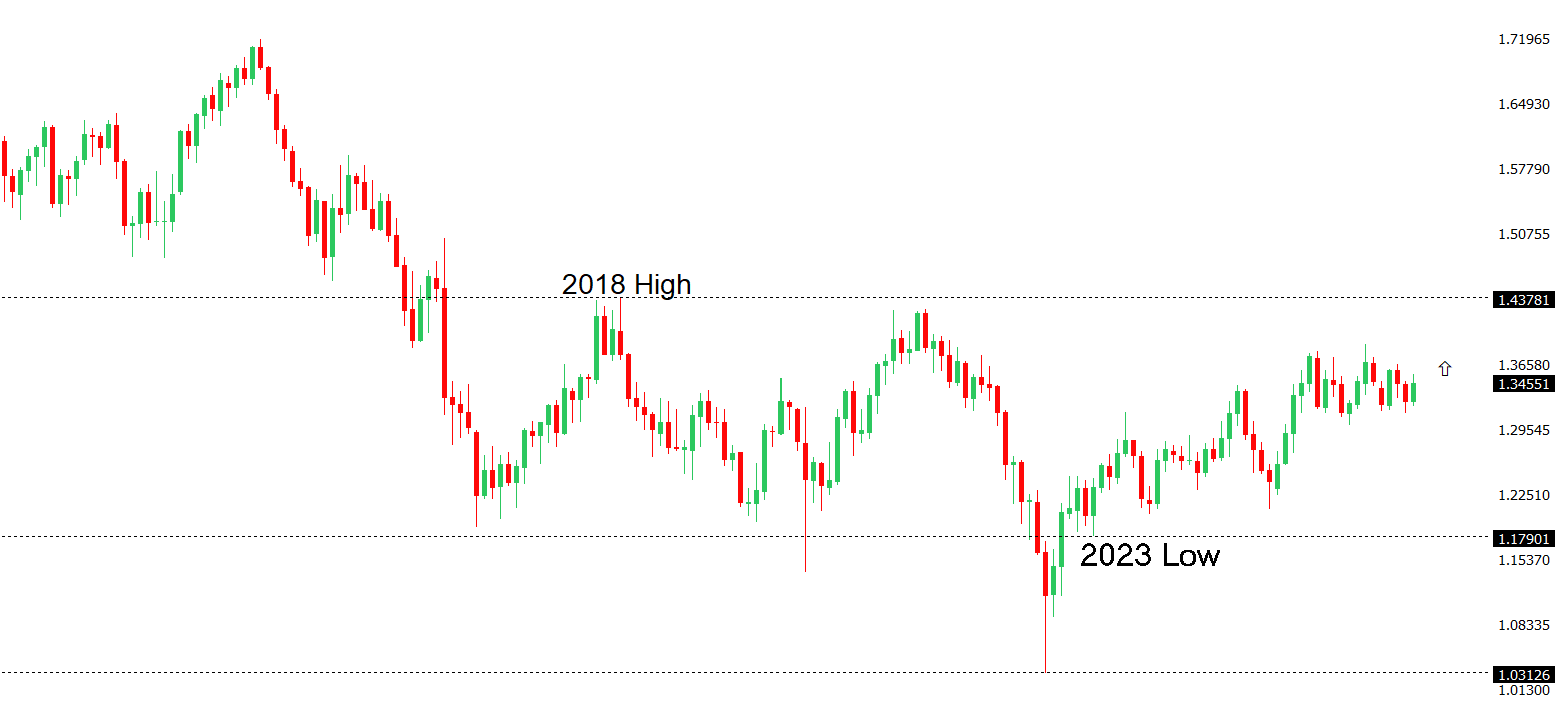
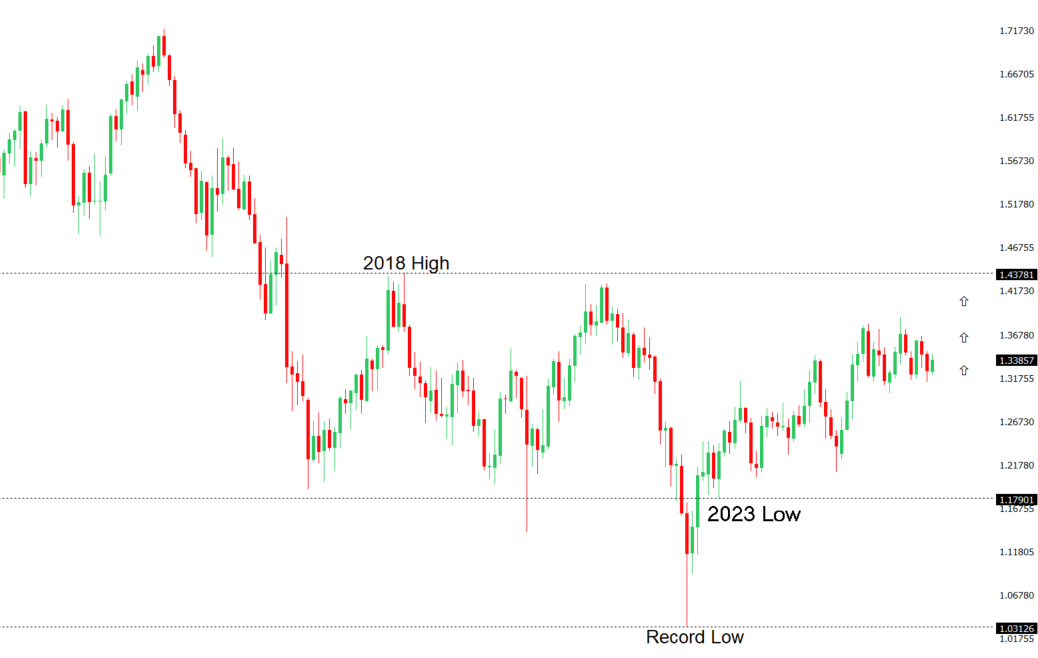
| The Pound remains exceptionally well supported on dips into the 1.3000 area, with the price largely consolidating above the psychological barrier and previous resistance turned support in the form of the 2023 high. Look for the market to continue be well supported on dips ahead of the next major upside extension through the yearly high at 1.3870 and towards a retest of the 2018 high at 1.4377 further up. Only a monthly close below 1.3000 negates. | ||
 | ||
| R2 1.3452 - 10 July high - Strong R1 1.3396 - 22 July high - Medium S1 1.3273 - 22 June high - Medium S2 1.3200 - Figure - Medium | ||
| GBPUSD: fundamental overview | ||
| The pound remains under modest pressure against the US dollar as markets continue to favor the greenback amid a cautious global risk backdrop and expectations that the Bank of England will leave interest rates unchanged at 3.75% at this week’s policy meeting. Recent softer UK inflation data, easing oil prices following a temporary de-escalation in Middle East tensions, and expectations that policymakers will take a wait-and-see approach have reduced the urgency for additional BoE tightening, with markets still pricing in only one or possibly two quarter-point rate hikes by the end of 2026. At the same time, lingering geopolitical uncertainty, political uncertainty in the UK, and a generally defensive tone across financial markets have supported safe-haven demand for the US dollar, while investors also remain focused on upcoming UK data, including retail sales and other activity indicators, for clues on whether the UK economy is resilient enough to keep the prospect of further BoE tightening alive later this year. | ||
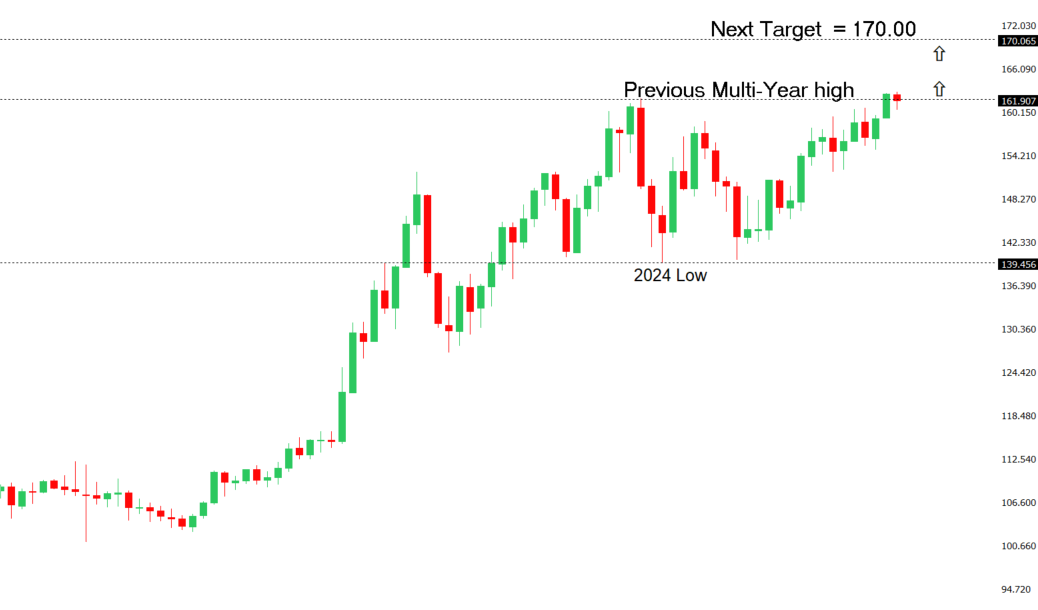
| USDJPY: technical overview | ||
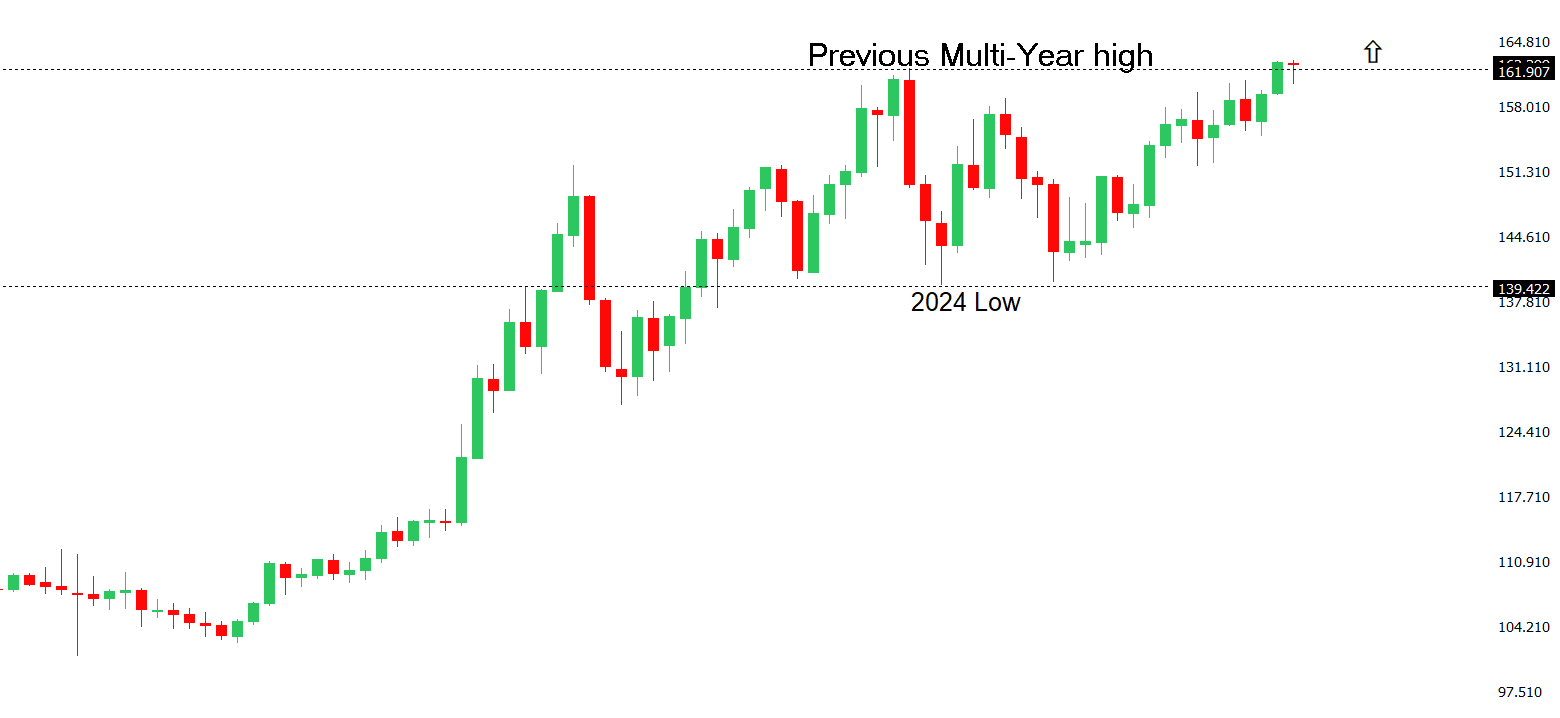
| The major pair has extended its run to fresh multi-decade highs, with the latest push through 160.00 opening the door for further upside towards 165.00-170.00. At the same time, daily studies are looking quite stretched, suggesting we could see a healthy correction on the horizon. A break back below 160.48 would now strengthen the case for a larger pullback. Until then, the market will continue to be focused on additional gains. | ||
 | ||
| R2 165.00 - Psychological - Strong R1 163.99 - Multi-Year high/23 July 2026 - Medium S1 162.43 - 21 July low - Medium S2 161.28 - 10 July low - Medium | ||
| USDJPY: fundamental overview | ||
| The yen remains under pressure as the wide interest rate differential between Japan and the United States continues to outweigh the Bank of Japan’s gradual tightening cycle. Although the BoJ has already lifted its policy rate to 1.00%—the highest level since 1995—and is expected to continue raising rates gradually over the coming years, policymakers have reiterated that any further normalization will remain measured, limiting support for the currency. At the same time, elevated US Treasury yields and resilient expectations that the Federal Reserve will keep policy restrictive have sustained demand for the US dollar, while ongoing geopolitical uncertainty has reinforced the greenback’s safe-haven appeal. Japanese officials continue to warn they stand ready to act against excessive currency volatility, keeping the risk of verbal or direct FX intervention alive, but markets remain focused on the persistent yield gap, which continues to favor USDJPY despite the BoJ’s tightening path. | ||
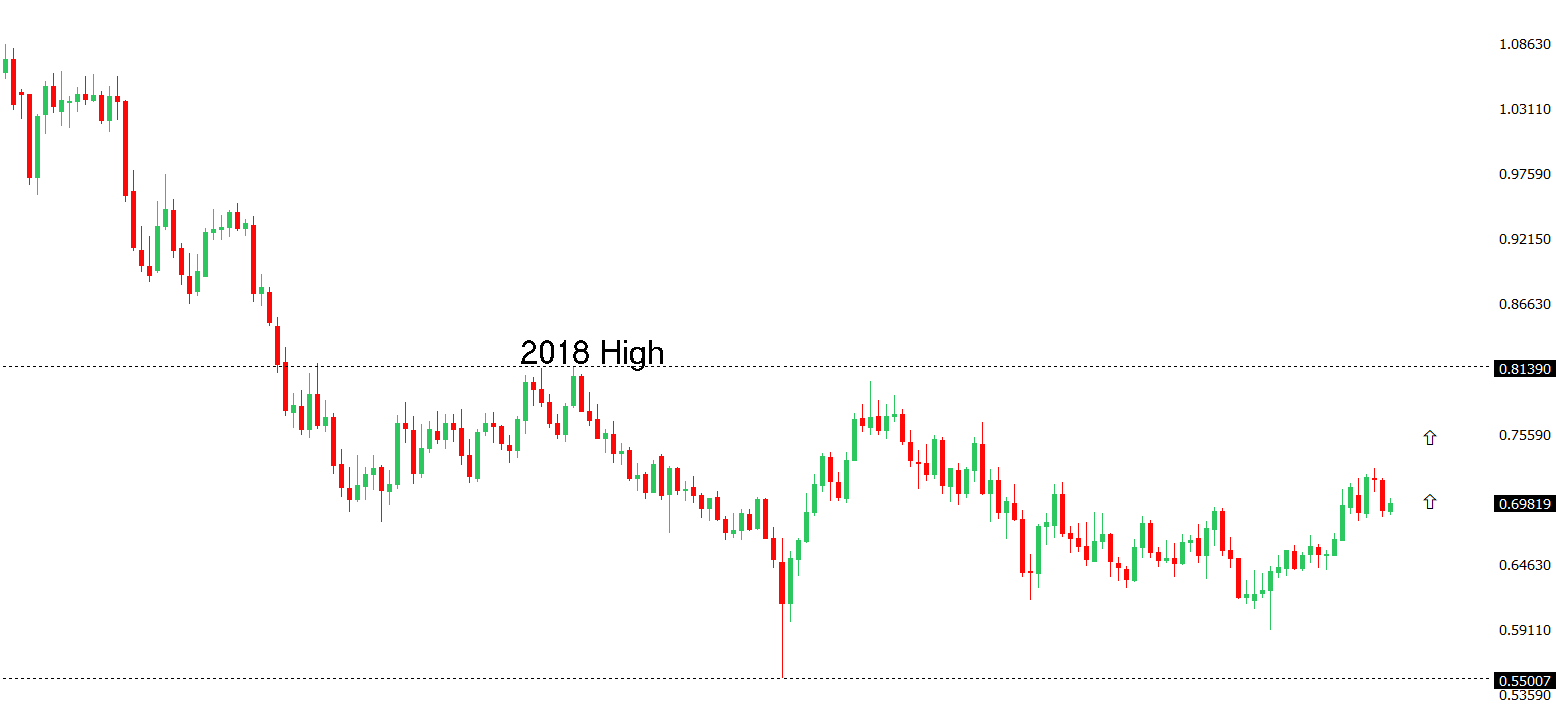
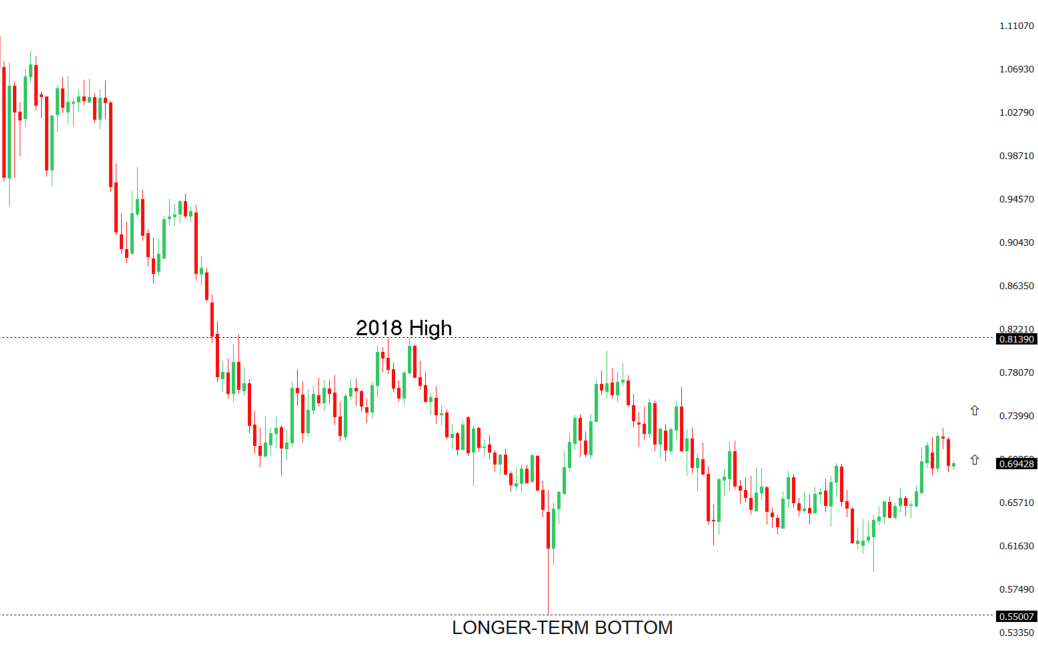
| AUDUSD: technical overview | ||
| There are signs of the formation of a longer-term base with the market recovering out from a meaningful longer-term support zone. The latest monthly close back above 0.7000 takes the big picture pressure off the downside and strengthens the case for a bottom, with the focus now on a push towards 0.8000. Setbacks should now be well supported ahead of 0.6700. | ||
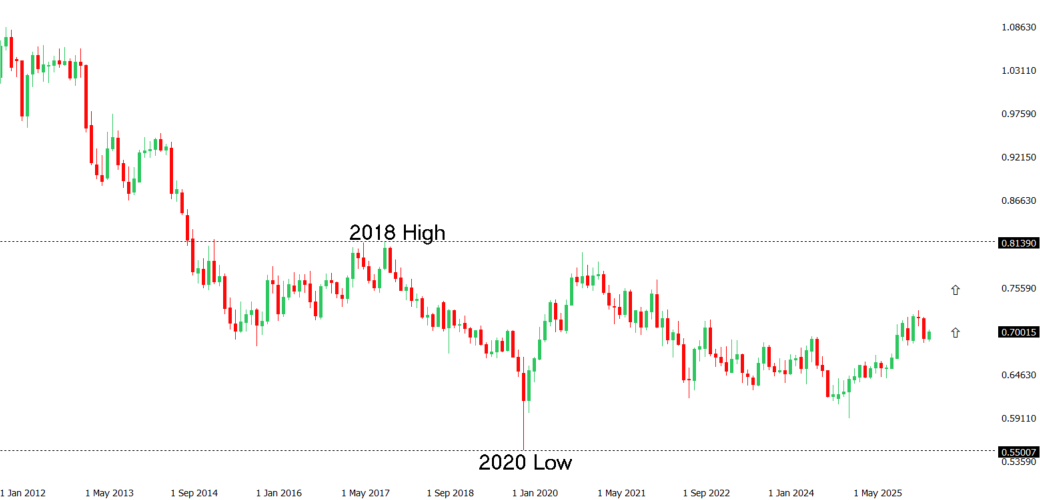 | ||
| R2 0.7089 - 15 June high - Strong R1 0.7027 - 21 July high - Medium S1 0.6912 - 14 July low - Medium S2 0.6865 - 30 June low - Strong | ||
| AUDUSD: fundamental overview | ||
| The Australian dollar has started the week on a slightly firmer footing, supported by easing geopolitical tensions, and an improvement in broader risk sentiment. Domestically, the backdrop remains constructive, with resilient labor market conditions, expanding manufacturing and services PMIs, and an RBA that continues to signal it remains prepared to tighten policy further should inflation prove more persistent than expected. Markets will now turn their focus to Governor Michele Bullock’s remarks and, more importantly, this week’s Australian CPI report, which could materially reshape expectations for additional RBA tightening later this year. External factors also remain important, with stable Chinese economic data providing a neutral backdrop rather than a major catalyst for the Aussie. While AUDUSD continues to struggle around the psychologically important 0.7000 level, the combination of supportive domestic fundamentals, lingering expectations for further RBA tightening, and a sizeable speculative short position leaves scope for further gains should Australian inflation surprise to the upside or US Dollar weakness persist. Conversely, a softer inflation print or renewed strength in the Greenback driven by higher US yields or deteriorating risk sentiment would likely see the Australian dollar surrender recent gains. | ||
| Suggested reading | ||
| How AI Has Completely Re-Written Rules of Stock Market, A. Rosenberg, Barron’s (July 24, 2026) Is Kevin Warsh’s Silence the Beginning of the End for the Fed?, J. Tamny, Forbes (July 26, 2026) | ||