Day Image
14th July 2026 | view in browser
CPI and Fed Chair testimony amplify risks

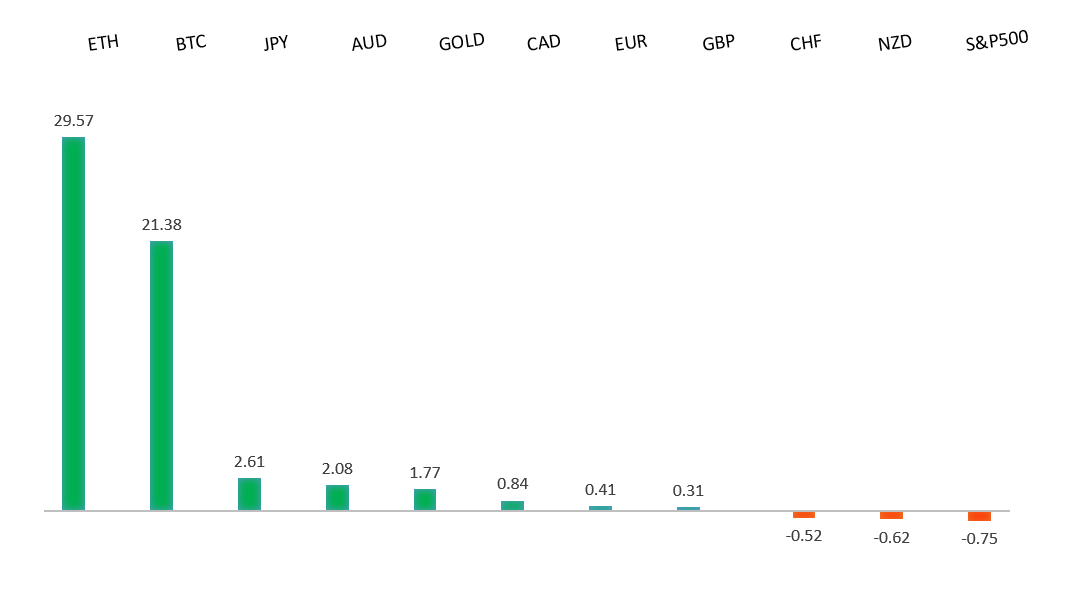
Markets head into Tuesday with a defensive bias as escalating US-Iran tensions, surging oil prices and rising Fed rate expectations drive broad dollar strength, higher Treasury yields and pressure on global equities ahead of key US inflation data.


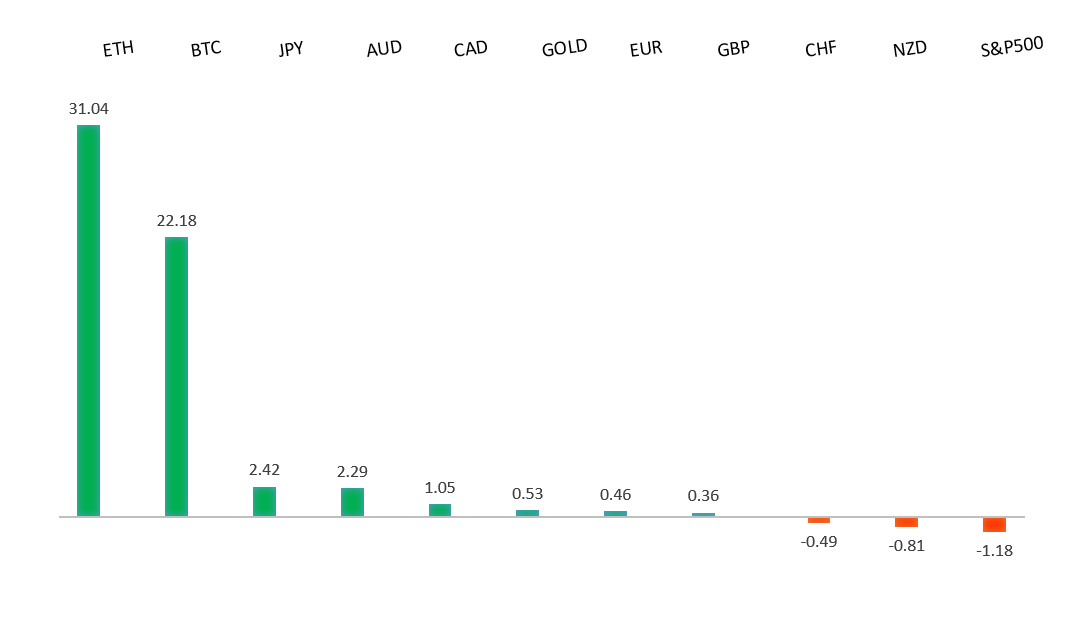
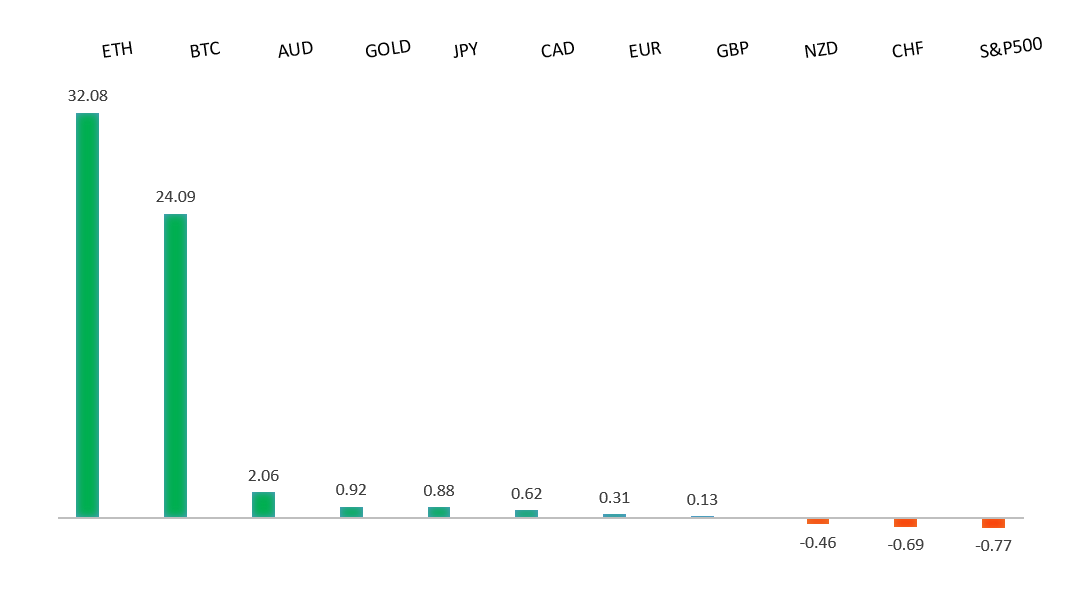
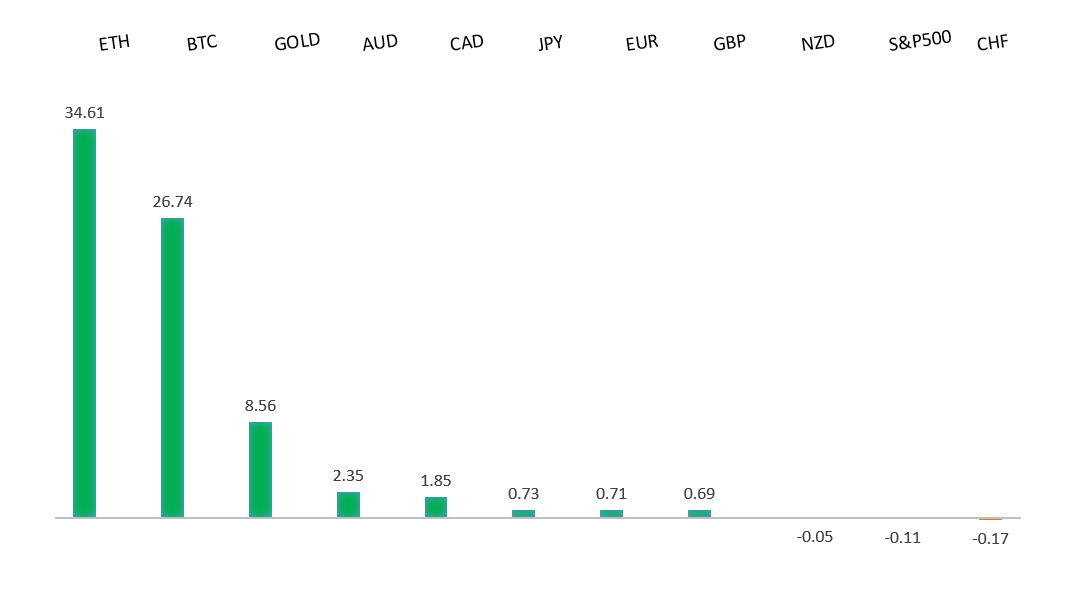
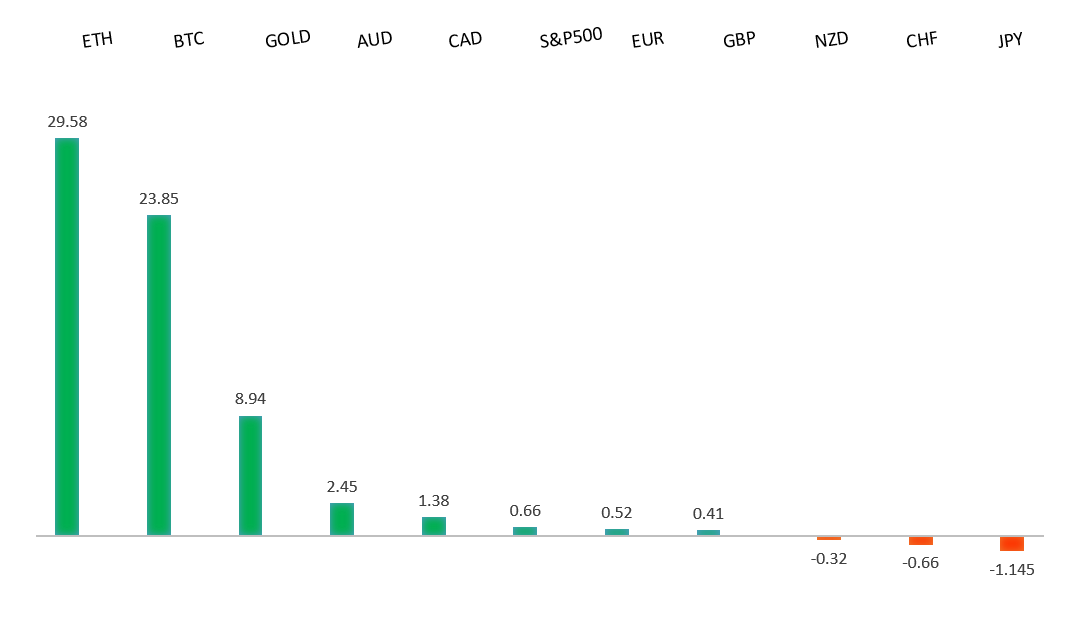
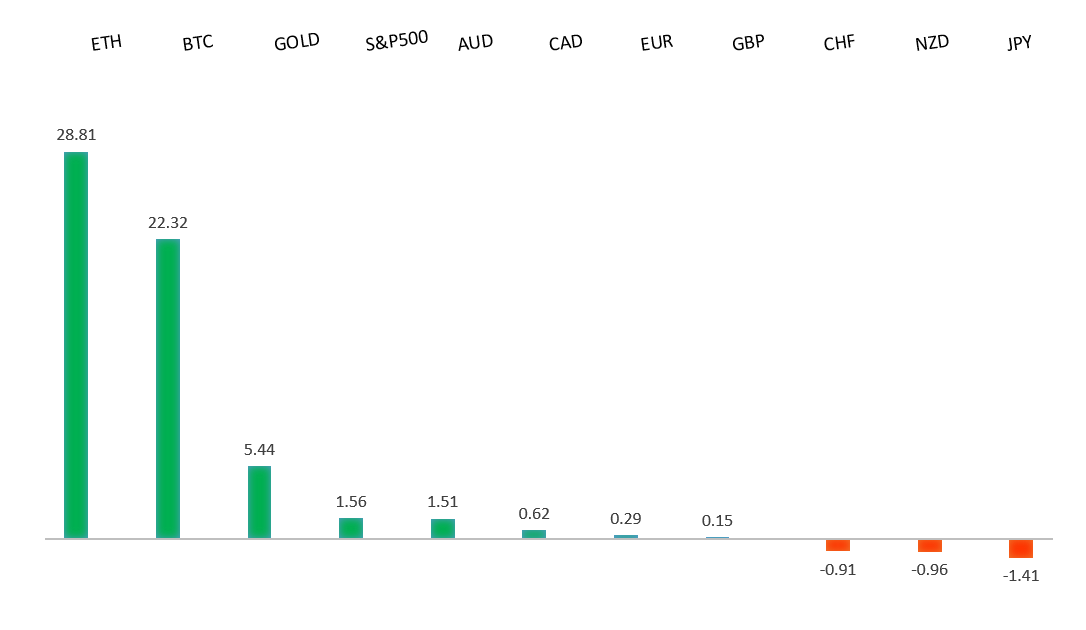
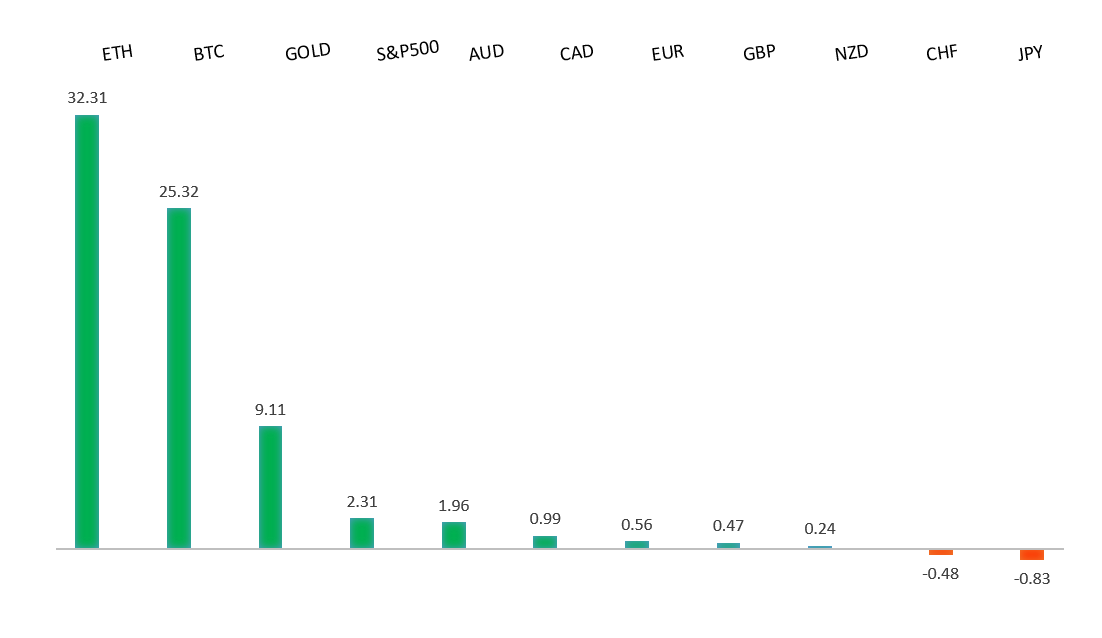
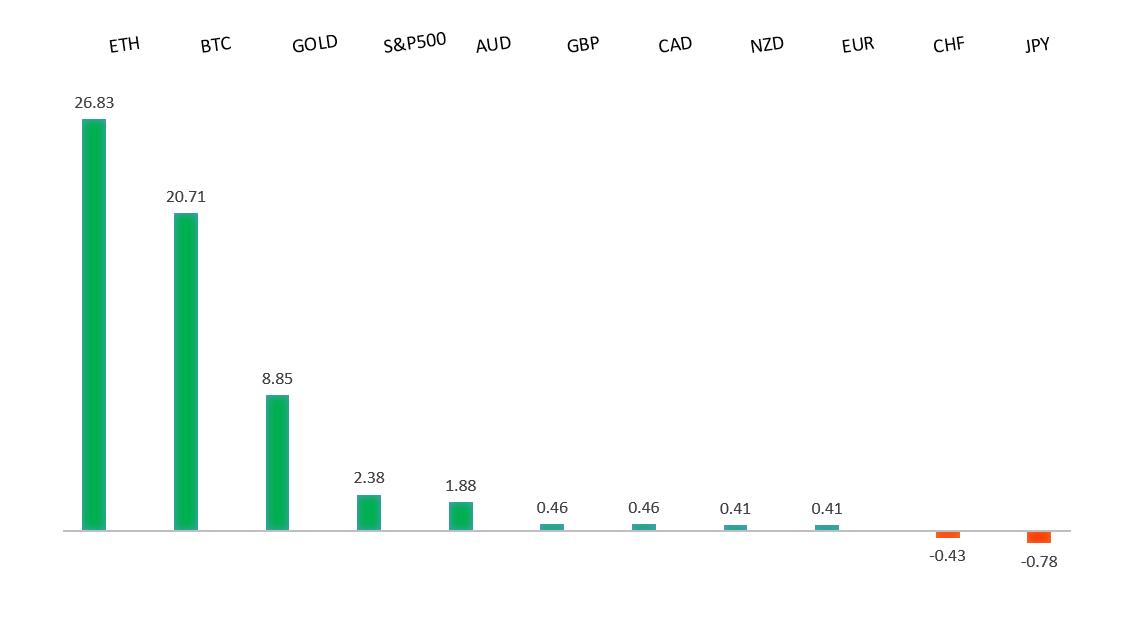
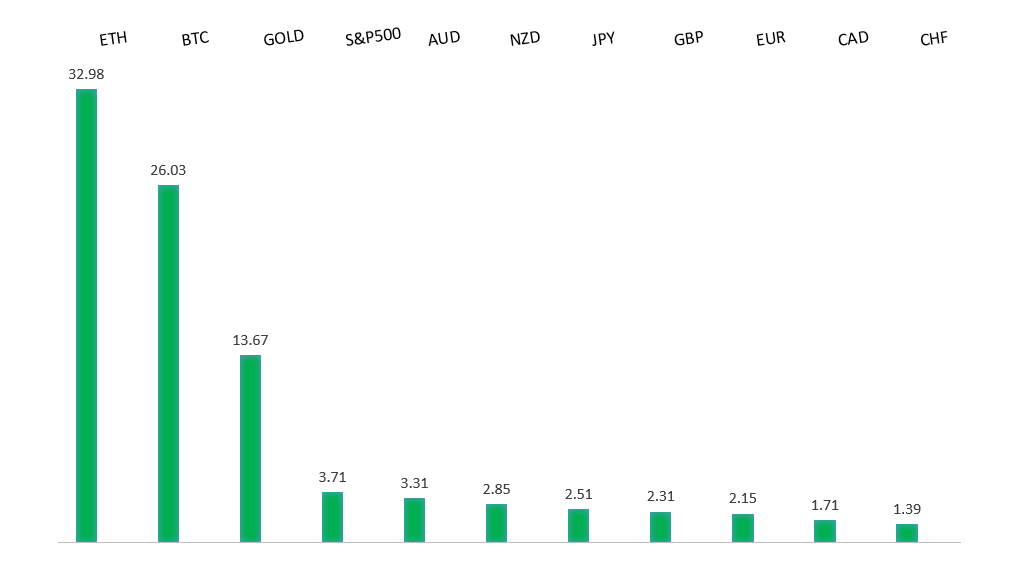
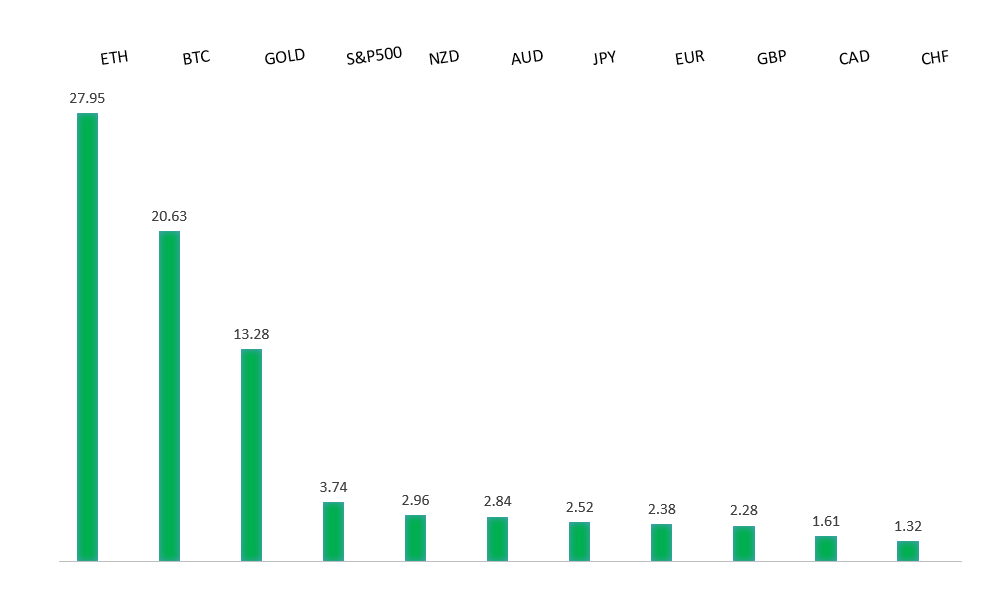
Performance chart 30day v. USD (%)
Performance Chart
 
 
Technical & fundamental highlights
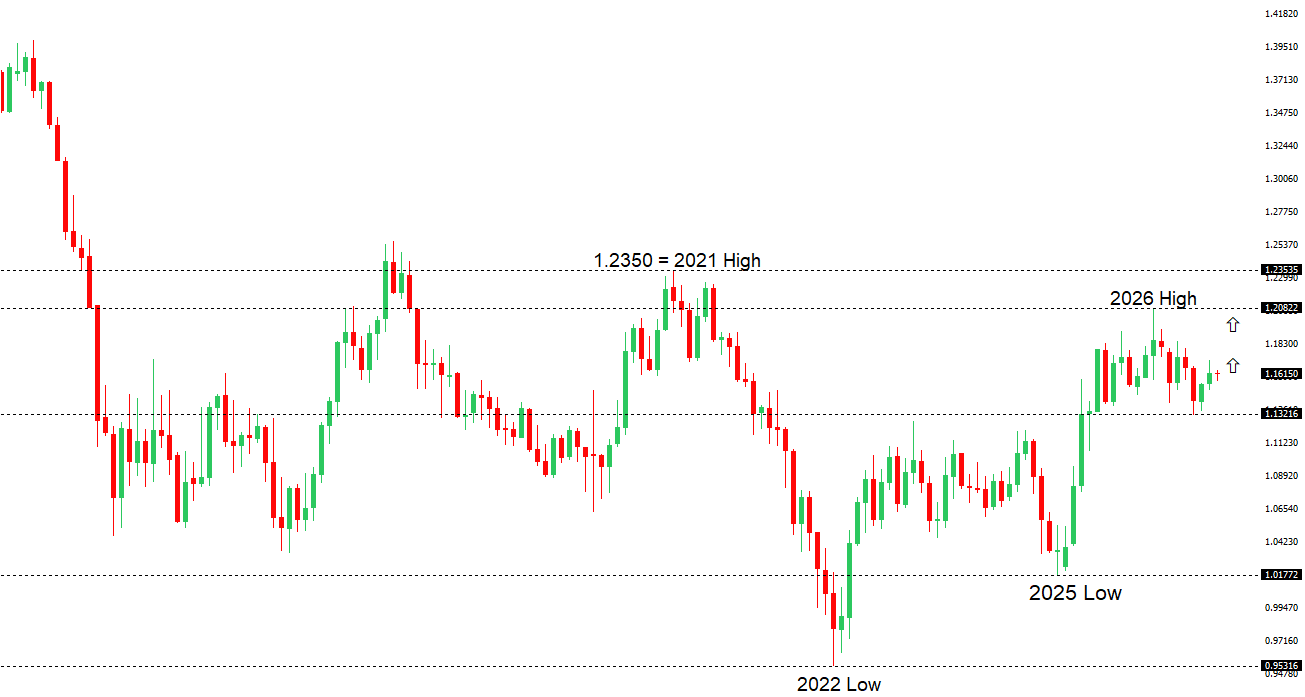
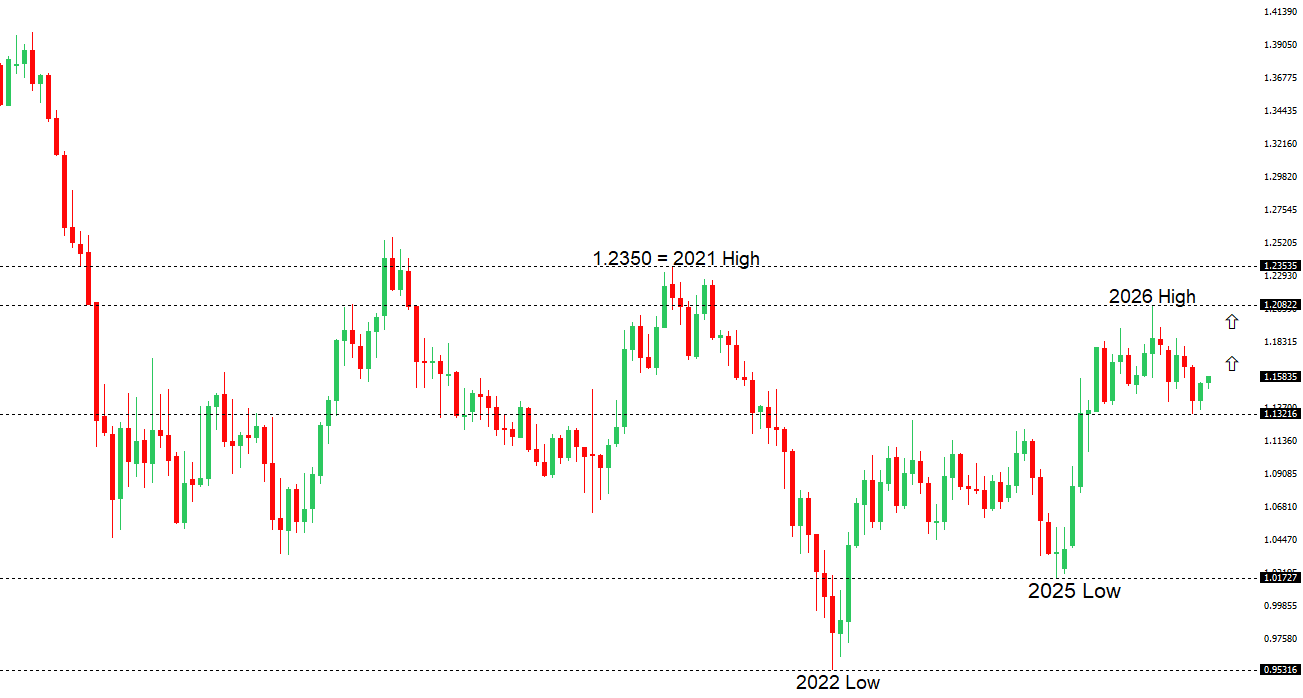
EURUSD: technical overview

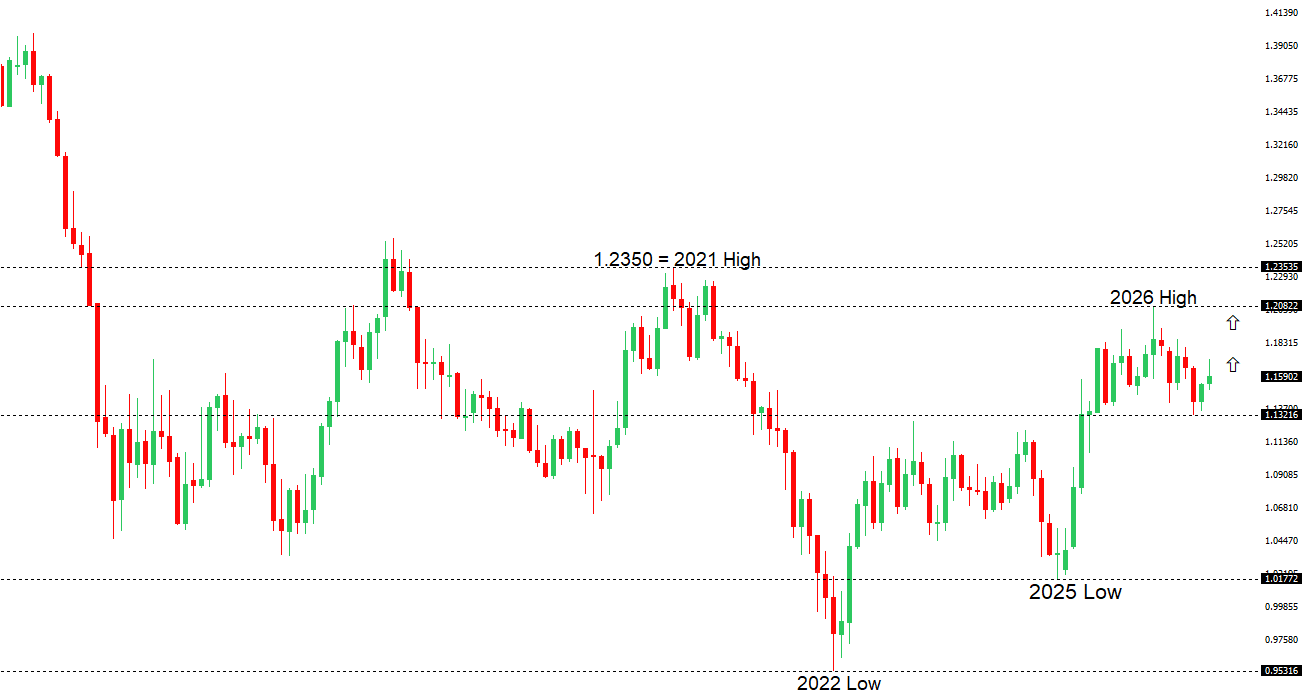
The Euro outlook remains constructive with higher lows sought out on dips in favor of the next major upside extension targeting the 2021 high at 1.2350. Setbacks should be exceptionally well supported ahead of 1.1300.

EURUSD Chart
R2 1.1529 - 18 June high - Medium
R1 1.1473 - 2 July high - Medium
S1 1.1325 - 24 June/2026 low - Medium
S2 1.1300 - Figure - Medium
EURUSD: fundamental overview

The euro remains broadly supported by resilient Eurozone fundamentals and the ECB’s comparatively hawkish stance, though gains against the US dollar are proving difficult to extend ahead of key US inflation data. Markets continue to weigh the prospect that the ECB will keep policy restrictive for longer than many of its global peers, offering underlying support to the single currency. However, renewed geopolitical tensions following fresh US military strikes against Iran have boosted demand for traditional safe havens, lending support to the dollar and tempering euro upside. As a result, attention is now firmly on the latest US CPI report, with a softer-than-expected inflation reading likely to weigh on the dollar by reducing expectations for further Fed tightening, while a stronger print would reinforce the case for higher US rates and could see EURUSD come back under renewed pressure.

 
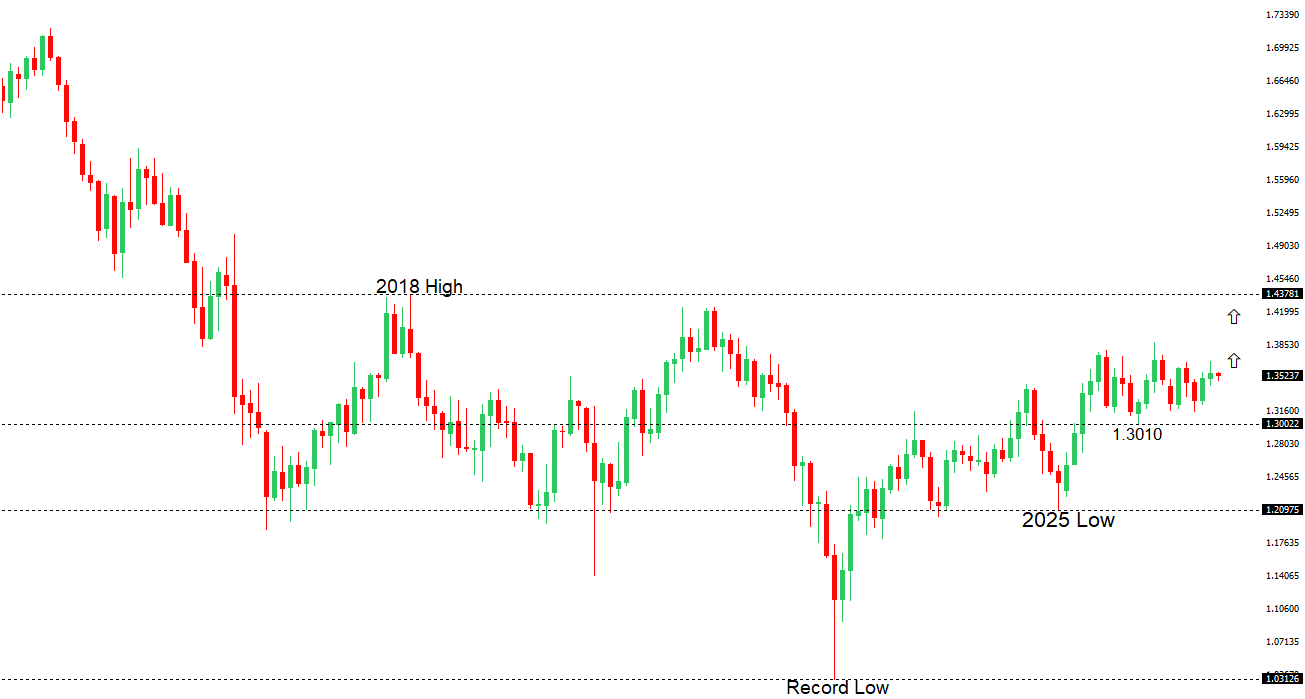
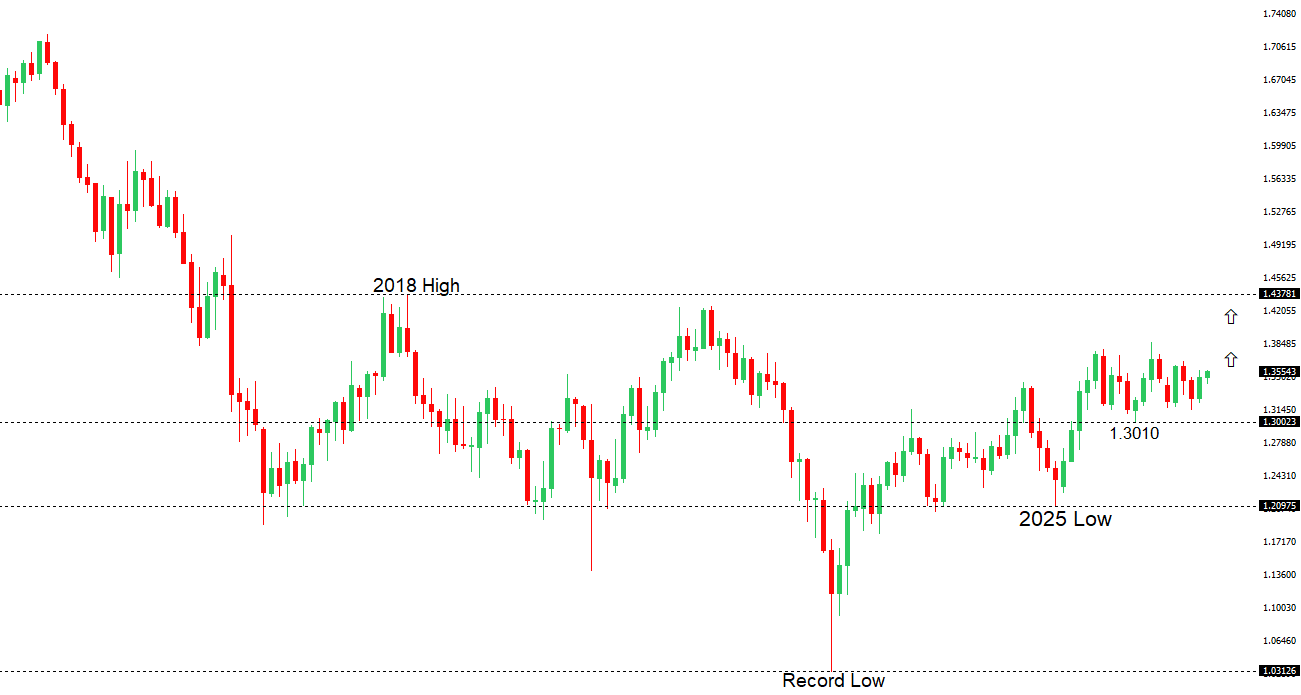
GBPUSD: technical overview

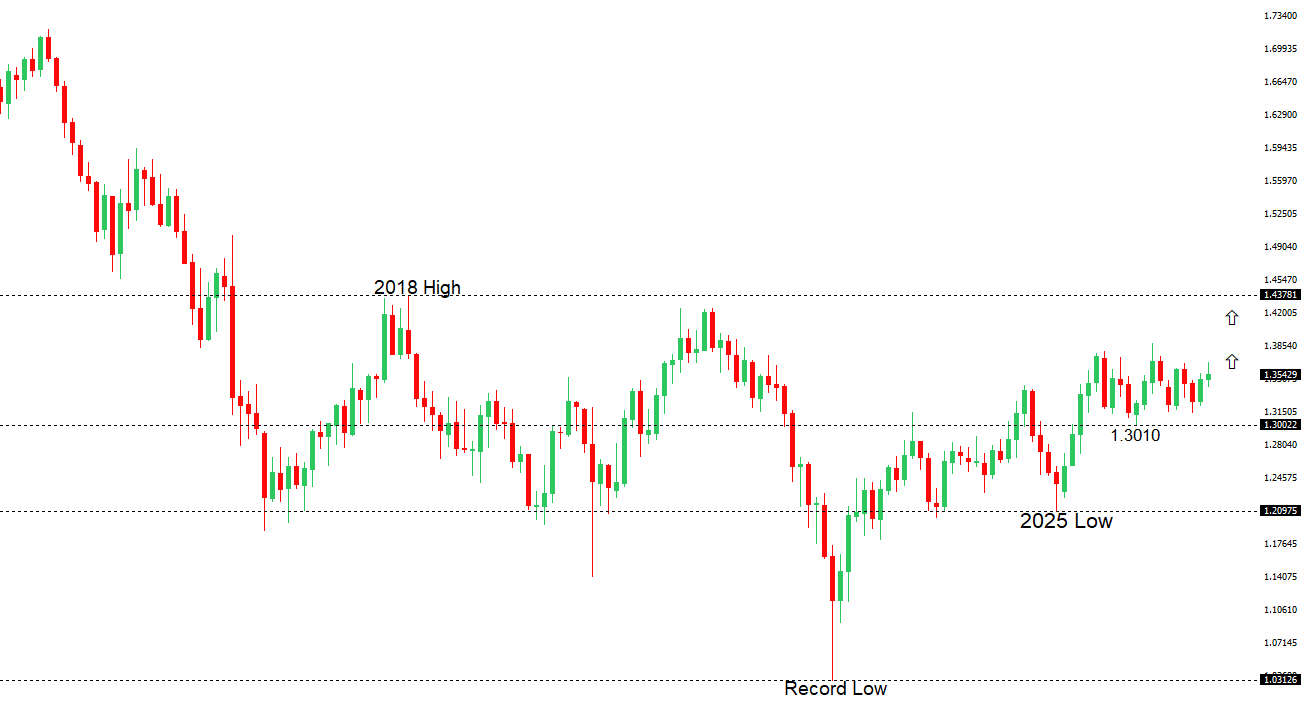
The Pound remains exceptionally well supported on dips into the 1.3000 area, with the price largely consolidating above the psychological barrier and previous resistance turned support in the form of the 2023 high. Look for the market to continue be well supported on dips ahead of the next major upside extension through the yearly high at 1.3870 and towards a retest of the 2018 high at 1.4377 further up. Only a monthly close below 1.3000 negates.

GBPUSD Chart
R2 1.3461 - 15 June high - Medium
R1 1.3452 - 10 July high - Medium
S1 1.3322 - 8 July low - Medium
S2 1.3273 - 22 June high - Medium
GBPUSD: fundamental overview

The pound remains largely driven by external rather than domestic factors, with Sterling under pressure as a stronger US dollar benefits from safe-haven demand following the latest escalation in US-Iran tensions and renewed concerns over energy supply disruptions through the Strait of Hormuz. Higher oil prices have reinforced expectations that inflation could remain elevated, supporting a more hawkish Federal Reserve outlook and limiting upside in GBPUSD ahead of today’s key US CPI report and Fed communication. Domestically, political uncertainty has eased after Andy Burnham secured overwhelming Labour backing to become the UK’s next prime minister, although attention is already shifting toward the government’s economic agenda after business groups urged swift action to tackle the UK’s persistently high industrial energy costs, which they argue are weighing on investment. Meanwhile, the latest retail spending data painted a mixed picture, with consumer spending supported by warm weather and the World Cup but overall retail sales growth slowing from May, suggesting underlying demand remains soft despite temporary boosts. Expectations that the Bank of England will maintain a restrictive policy stance continue to provide some support for Sterling, but with UK data taking a back seat, the pound remains primarily at the mercy of US dollar dynamics and evolving global risk sentiment.

 
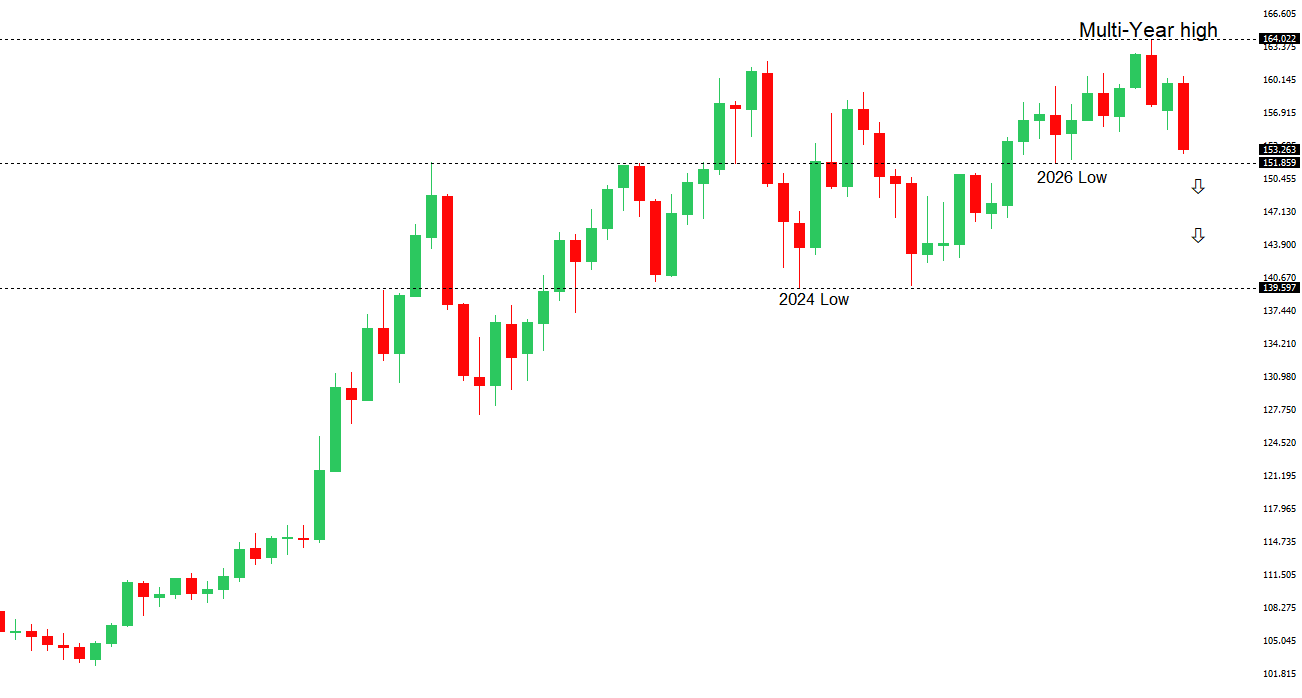
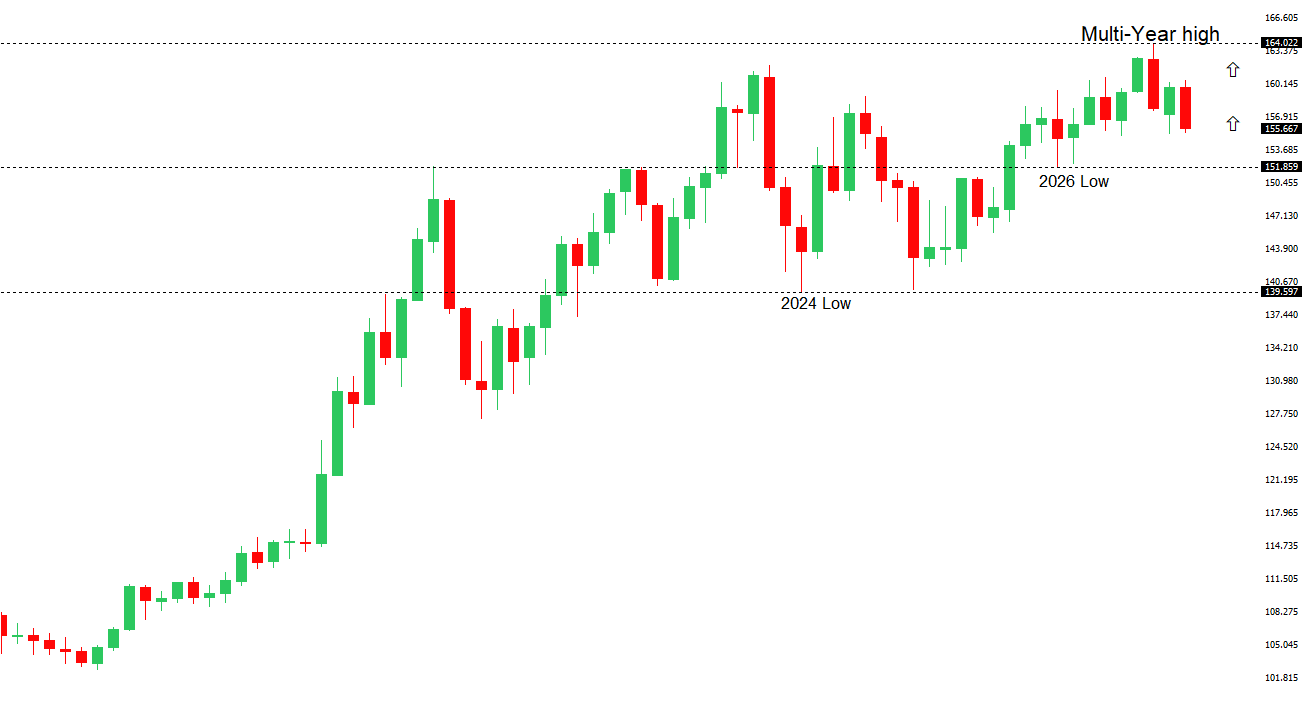
USDJPY: technical overview

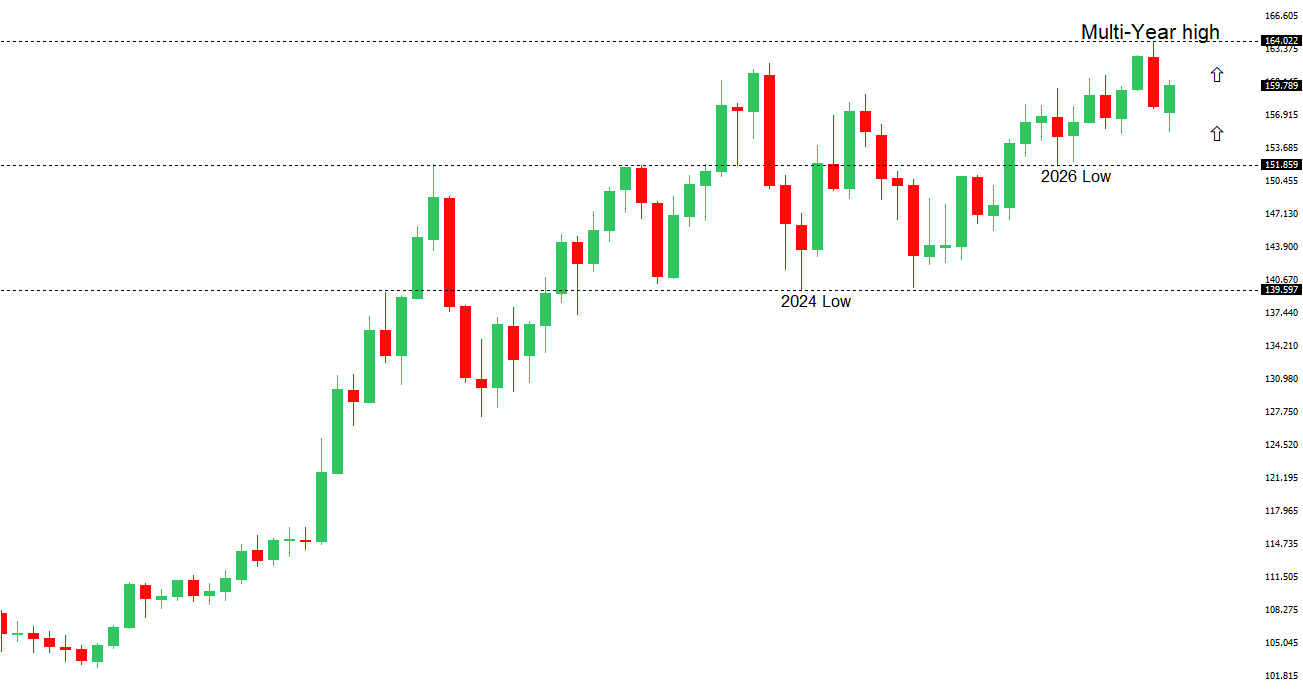
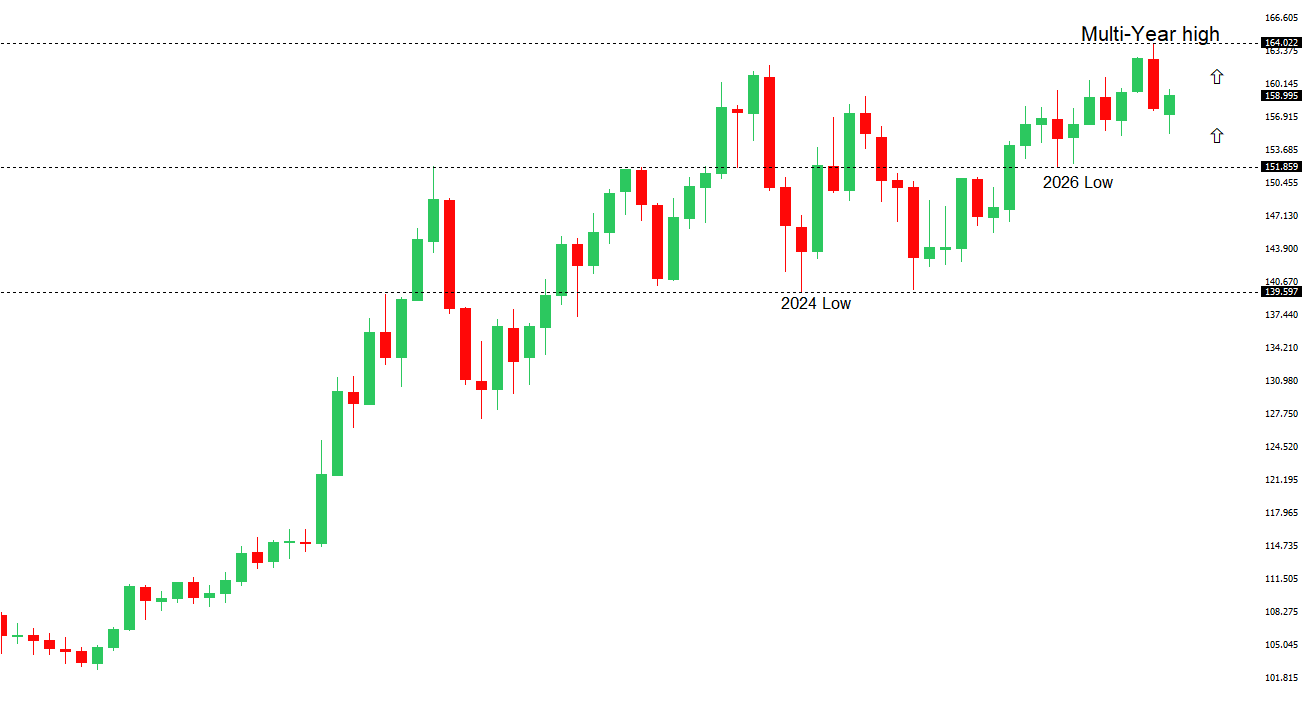
The major pair has extended its run to fresh multi-decade highs, with the latest push through 160.00 opening the door for further upside towards 165.00-170.00. At the same time, daily studies are looking quite stretched, suggesting we could see a healthy correction on the horizon. A break back below 160.48 would now strengthen the case for a larger pullback. Until then, the market will continue to be focused on additional gains.

USDJPY Chart
R2 163.00 - Figure - Medium
R1 162.84 - Multi-Year high/1 July 2026 - Strong
S1 161.28 - 10 July low - Medium
S2 160.48 - 3 July low - Medium
USDJPY: fundamental overview

The Yen remains under pressure as the wide interest rate differential with the United States continues to favor the US Dollar, while renewed tensions between the US and Iran have pushed oil prices higher, worsening Japan’s terms of trade given its heavy reliance on imported energy. The resulting increase in safe-haven demand for the US Dollar, alongside expectations that elevated energy prices could keep global inflation sticky and reinforce the case for a more restrictive Federal Reserve, has further weighed on the Yen. At the same time, the Bank of Japan continues to normalize policy only gradually, leaving Japan’s yield disadvantage firmly intact despite ongoing official rhetoric around fiscal discipline and market stability. With USDJPY still trading near multi-decade highs, speculation over potential Japanese currency intervention remains elevated, although previous interventions have had only a temporary impact without a broader shift in monetary policy or narrowing of the US-Japan rate differential. Looking ahead, today’s US CPI report and Fed Chair Kevin Warsh’s testimony represent key catalysts, with stronger-than-expected inflation likely reinforcing the Dollar’s advantage over the Yen, while a softer outcome could encourage a modest corrective recovery in the Japanese currency.

 
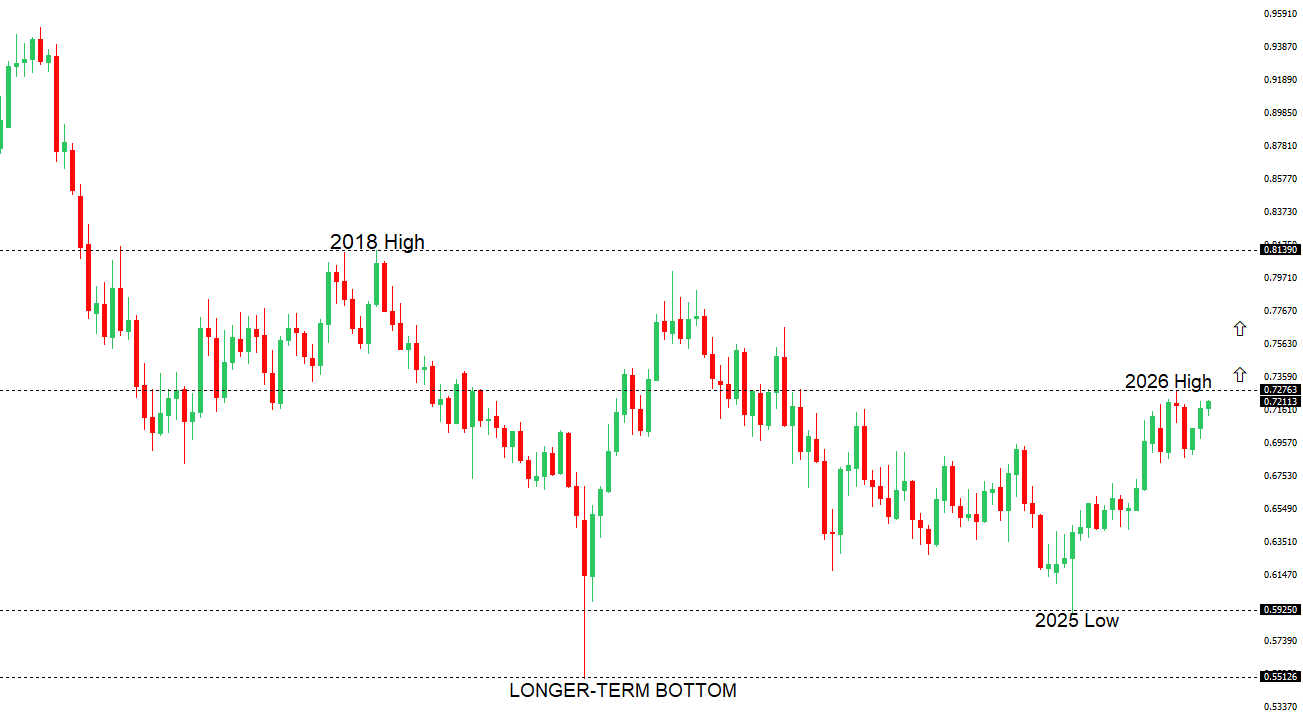
AUDUSD: technical overview

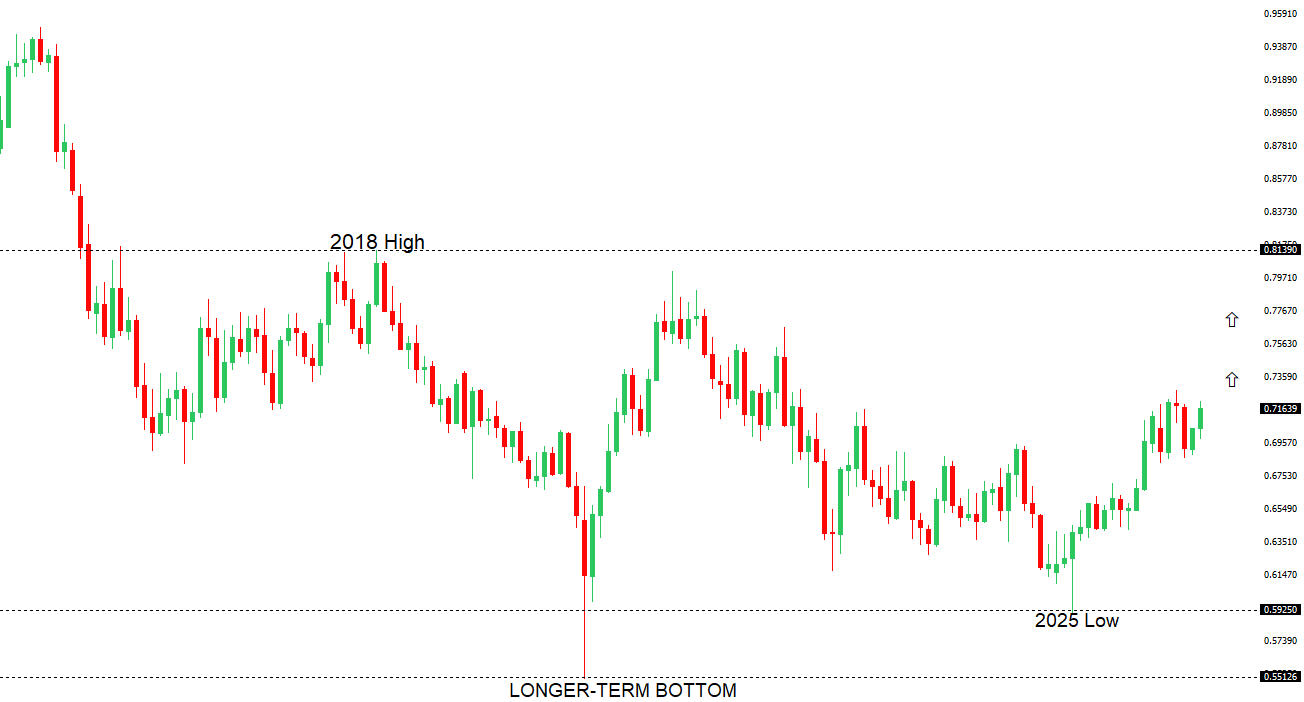
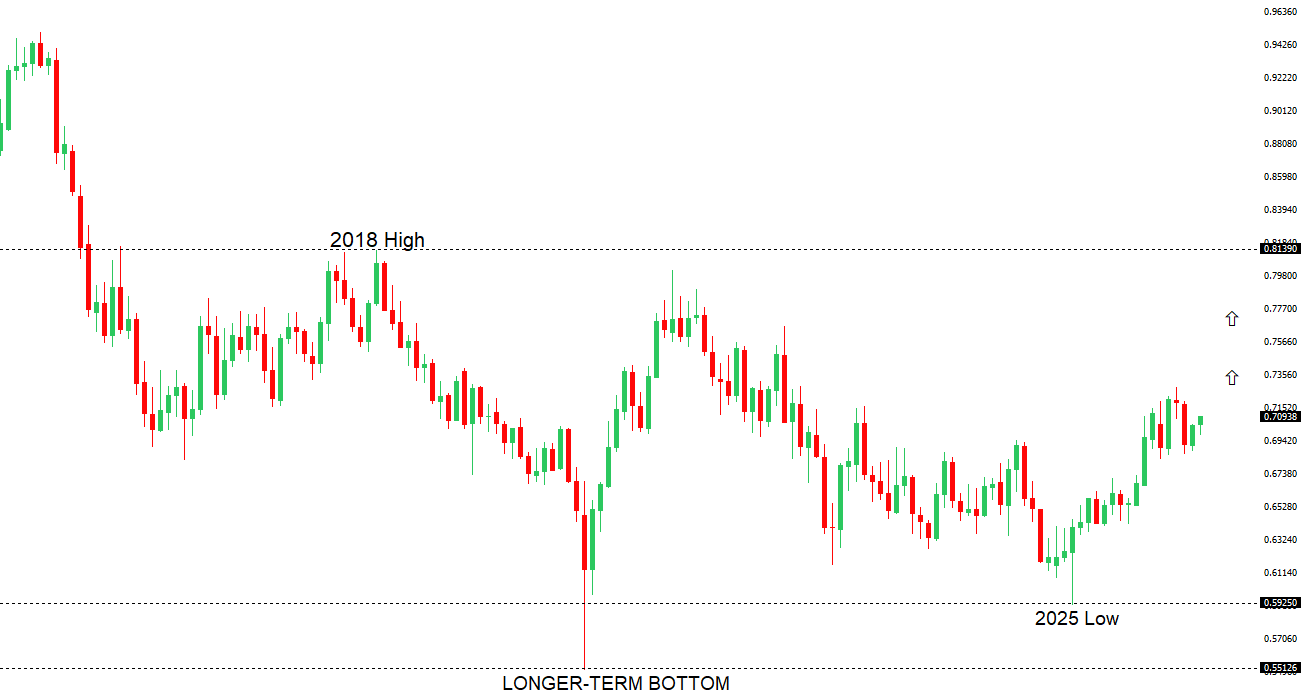
There are signs of the formation of a longer-term base with the market recovering out from a meaningful longer-term support zone. The latest monthly close back above 0.7000 takes the big picture pressure off the downside and strengthens the case for a bottom, with the focus now on a push towards 0.8000. Setbacks should now be well supported ahead of 0.6700.

AUDUSD Chart
R2 0.7089 - 15 June high - Strong
R1 0.6970 - 10 July high - Medium
S1 0.6865 - 30 June low - Medium
S2 0.6833 - 30 March low - Strong
AUDUSD: fundamental overview

The Australian dollar remains primarily driven by external developments, with renewed US Dollar strength and a deterioration in global risk sentiment weighing on the currency as escalating US-Iran tensions boost demand for safe-haven assets and drive oil prices higher. The renewed disruption to shipping through the Strait of Hormuz has revived inflation concerns ahead of the US CPI report, reinforcing expectations that the Federal Reserve could maintain a restrictive policy stance and underpinning the greenback. Domestically, the backdrop remains relatively supportive. The RBA continues to signal that further tightening cannot be ruled out if inflation proves persistent, while resilient labor market conditions, improving business activity and still-elevated underlying inflation argue for rates remaining restrictive. The latest NAB survey showed business confidence improving and conditions holding steady, with easing price pressures and the first decline in retail prices in seven years, although those figures largely reflected a short-lived period of lower fuel costs before the latest Middle East escalation. As oil prices climb again, those softer inflation signals are already looking dated and are unlikely to materially alter the RBA’s cautious stance. Meanwhile, China’s economy continues to stabilize rather than accelerate, offering neither a meaningful tailwind nor a significant drag for Australia. As a result, the Aussie remains largely at the mercy of US Dollar direction, global risk sentiment and geopolitical developments, with upcoming US inflation data and Fed Chair Kevin Warsh’s testimony expected to be the key near-term catalysts.

 
Suggested reading

How the U.S. Stock Market Is Becoming Too Big to Fail, J. Adinolfi, Marketwatch (July 11, 2026)

The Most Important Chart In Investing Wins Yet Again, S. McBride, RiskHedge (July 10, 2026)


Any opinions, news, research, analyses, prices or other information ("information") contained on this Blog, constitutes marketing communication and it has not been prepared in accordance with legal requirements designed to promote the independence of investment research. Further, the information contained within this Blog does not contain (and should not be construed as containing) investment advice or an investment recommendation, or an offer of, or solicitation for, a transaction in any financial instrument. LMAX Group has not verified the accuracy or basis-in-fact of any claim or statement made by any third parties as comments for every Blog entry.

LMAX Group will not accept liability for any loss or damage, including without limitation to, any loss of profit, which may arise directly or indirectly from use of or reliance on such information. No representation or warranty is given as to the accuracy or completeness of the above information. While the produced information was obtained from sources deemed to be reliable, LMAX Group does not provide any guarantees about the reliability of such sources. Consequently any person acting on it does so entirely at his or her own risk. It is not a place to slander, use unacceptable language or to promote LMAX Group or any other FX and CFD provider and any such postings, excessive or unjust comments and attacks will not be allowed and will be removed from the site immediately.

Day Image
13th July 2026 | view in browser
Markets caught between missiles and macro

Markets begin the week balancing a renewed escalation in the US-Iran conflict and rising oil prices against a pivotal week of US inflation data and Fed Chair Kevin Warsh’s testimony, with investors assessing whether geopolitical risks or monetary policy will prove the dominant driver of global markets.


Performance chart 30day v. USD (%)
Performance Chart
 
 
Technical & fundamental highlights
EURUSD: technical overview

The Euro outlook remains constructive with higher lows sought out on dips in favor of the next major upside extension targeting the 2021 high at 1.2350. Setbacks should be exceptionally well supported ahead of 1.1300.

EURUSD Chart
R2 1.1529 - 18 June high - Medium
R1 1.1473 - 2 July high - Medium
S1 1.1325 - 24 June/2026 low - Medium
S2 1.1300 - Figure - Medium
EURUSD: fundamental overview

The euro is consolidating as a softer US dollar continues to provide support following the recent weaker US employment report and a Federal Reserve minutes that highlighted significant uncertainty over the policy outlook, even as many officials still see the possibility of further tightening if inflation proves persistent. At the same time, the single currency’s upside is being tempered by easing Eurozone inflation pressures, with softer German and French CPI readings reinforcing expectations that the European Central Bank is nearing the end of its tightening cycle and reducing the urgency for additional rate hikes. Meanwhile, renewed geopolitical tensions between the US and Iran, including fresh military strikes and retaliatory threats, are underpinning safe-haven demand for the dollar and limiting broader euro gains, leaving EURUSD largely caught between a softer dollar backdrop and fading ECB policy support.

 
GBPUSD: technical overview

The Pound remains exceptionally well supported on dips into the 1.3000 area, with the price largely consolidating above the psychological barrier and previous resistance turned support in the form of the 2023 high. Look for the market to continue be well supported on dips ahead of the next major upside extension through the yearly high at 1.3870 and towards a retest of the 2018 high at 1.4377 further up. Only a monthly close below 1.3000 negates.

GBPUSD Chart
R2 1.3461 - 15 June high - Medium
R1 1.3452 - 10 July high - Medium
S1 1.3322 - 8 July low - Medium
S2 1.3273 - 22 June high - Medium
GBPUSD: fundamental overview

Sterling has remained relatively well supported by easing domestic political uncertainty, resilient UK fundamentals and a softer US dollar backdrop. Markets have largely welcomed the transition to incoming Prime Minister Andy Burnham, viewing the reduction in political uncertainty as supportive for UK assets, while an IMF upgrade to the UK’s growth outlook has reinforced confidence in the economy. Investors are also continuing to price a relatively hawkish Bank of England compared with many of its major peers as inflation remains elevated. Attention is now beginning to shift toward Burnham’s first fiscal agenda, with reports suggesting he is considering an expansive combined autumn budget and spending review that could include higher defense spending, new tax measures and broader structural reforms. While such plans could provide greater clarity on the government’s long-term economic strategy, they also introduce uncertainty around future borrowing requirements and fiscal discipline, leaving gilt markets and sterling sensitive to further details. Externally, the pound has also drawn support from reduced expectations for additional near-term Federal Reserve tightening following the latest FOMC minutes, although renewed volatility surrounding the US-Iran conflict and periodic safe-haven demand for the US dollar have continued to cap sterling’s upside.

 
USDJPY: technical overview

The major pair has extended its run to fresh multi-decade highs, with the latest push through 160.00 opening the door for further upside towards 165.00-170.00. At the same time, daily studies are looking quite stretched, suggesting we could see a healthy correction on the horizon. A break back below 160.48 would now strengthen the case for a larger pullback. Until then, the market will continue to be focused on additional gains.

USDJPY Chart
R2 163.00 - Figure - Medium
R1 162.84 - Multi-Year high/1 July 2026 - Strong
S1 161.00 - Figure - Medium
S2 160.48 - 3 July low - Medium
USDJPY: fundamental overview

The yen has found some demand in recent sessions after a series of domestic developments encouraged investors to trim heavily crowded short positions. Fresh support came from firmer-than-expected producer price data, government plans to encourage the Government Pension Investment Fund and households to increase allocations to domestic assets, and renewed fiscal reform commitments aimed at improving confidence in Japan’s public finances. Those announcements have reinforced expectations that the Bank of Japan will continue gradually normalizing policy while also fueling speculation that more capital could eventually be repatriated back into Japanese assets, though many analysts believe any meaningful shift will take time to materialize. At the same time, intervention risks remain elevated with USDJPY still trading at historically high levels despite the latest pullback, keeping traders cautious about maintaining aggressive bearish yen positions. That said, the currency continues to face important structural headwinds, including the still-wide US-Japan yield differential, the Bank of Japan’s cautious pace of policy tightening, and Japan’s vulnerability to higher oil prices as a major energy importer. Meanwhile, easing expectations for additional Federal Reserve tightening and a modest retreat in the US dollar have provided an additional near-term tailwind for the yen, even as ongoing uncertainty surrounding US-Iran tensions and the Strait of Hormuz continues to keep geopolitical risks firmly in focus.

 
AUDUSD: technical overview

There are signs of the formation of a longer-term base with the market recovering out from a meaningful longer-term support zone. The latest monthly close back above 0.7000 takes the big picture pressure off the downside and strengthens the case for a bottom, with the focus now on a push towards 0.8000. Setbacks should now be well supported ahead of 0.6700.

AUDUSD Chart
R2 0.7089 - 15 June high - Strong
R1 0.6979 - 11 June low - Medium
S1 0.6865 - 30 June low - Medium
S2 0.6833 - 30 March low - Strong
AUDUSD: fundamental overview

The Australian dollar has been underpinned by a softer US dollar, improved risk sentiment and renewed strength in the Chinese yuan, with the latter offering an additional tailwind given Australia’s deep trade links with China. Hopes that diplomatic efforts between the US and Iran could prevent a broader regional conflict have encouraged a modest recovery in risk-sensitive currencies, although lingering geopolitical tensions and the associated uncertainty around energy prices continue to limit upside momentum. On the domestic front, the Australian dollar has also found support from the Reserve Bank of Australia’s relatively hawkish tone after Assistant Governor Sarah Hunter indicated that persistently higher energy prices could warrant additional policy tightening if they threaten to keep inflation elevated. At the same time, expectations that the Federal Reserve could still deliver at least one more rate hike this year continue to support the US dollar and temper gains in AUDUSD. Looking ahead, markets will closely watch this week’s US CPI report and Australia’s consumer inflation expectations survey for fresh clues on the policy outlooks for both the Fed and the RBA.

 
Suggested reading

Kevin Warsh’s Quietude Is Bad For You and the Economy, C. Torres, Marketwatch (July 10, 2026)

What The Momentum Trade Tells Us About The Market, M. Phillips, Axios (July 9, 2026)


Any opinions, news, research, analyses, prices or other information ("information") contained on this Blog, constitutes marketing communication and it has not been prepared in accordance with legal requirements designed to promote the independence of investment research. Further, the information contained within this Blog does not contain (and should not be construed as containing) investment advice or an investment recommendation, or an offer of, or solicitation for, a transaction in any financial instrument. LMAX Group has not verified the accuracy or basis-in-fact of any claim or statement made by any third parties as comments for every Blog entry.

LMAX Group will not accept liability for any loss or damage, including without limitation to, any loss of profit, which may arise directly or indirectly from use of or reliance on such information. No representation or warranty is given as to the accuracy or completeness of the above information. While the produced information was obtained from sources deemed to be reliable, LMAX Group does not provide any guarantees about the reliability of such sources. Consequently any person acting on it does so entirely at his or her own risk. It is not a place to slander, use unacceptable language or to promote LMAX Group or any other FX and CFD provider and any such postings, excessive or unjust comments and attacks will not be allowed and will be removed from the site immediately.

Day Image
10th July 2026 | view in browser
Risk appetite regains the upper hand

Global markets begin the new day with risk appetite recovering as strong gains in US equities offset lingering Middle East tensions, leaving investors to balance resilient growth and AI optimism against persistent geopolitical risks and a still-cautious Federal Reserve outlook.


Performance chart 30day v. USD (%)
Performance Chart
 
 
Technical & fundamental highlights
EURUSD: technical overview

The Euro outlook remains constructive with higher lows sought out on dips in favor of the next major upside extension targeting the 2021 high at 1.2350. Setbacks should be exceptionally well supported ahead of 1.1300.

EURUSD Chart
R2 1.1529 - 18 June high - Medium
R1 1.1473 - 2 July high - Medium
S1 1.1325 - 24 June/2026 low - Medium
S2 1.1300 - Figure - Medium
EURUSD: fundamental overview

The euro has found modest support as the US dollar eases back following last week’s softer US employment data and a Federal Reserve meeting that, while still signaling inflation concerns, highlighted considerable uncertainty over the policy outlook. Although markets continue to price a meaningful chance of another Fed rate hike later this year, expectations for an aggressive tightening cycle have softened, taking some momentum out of the dollar. At the same time, the euro has drawn support from a repricing of European Central Bank expectations, with markets once again leaning toward additional ECB tightening this year as higher energy prices and geopolitical risks threaten to complicate the inflation outlook, helping lift Eurozone bond yields relative to US Treasuries. Even so, gains in the single currency remain measured as softer recent Eurozone inflation data tempers the ECB’s tightening outlook, while renewed US-Iran tensions and the resulting safe-haven demand for the dollar continue to act as an important headwind for EURUSD. Investors are now looking to the ECB meeting accounts and incoming US economic data for fresh direction.

 
GBPUSD: technical overview

The Pound remains exceptionally well supported on dips into the 1.3000 area, with the price largely consolidating above the psychological barrier and previous resistance turned support in the form of the 2023 high. Look for the market to continue be well supported on dips ahead of the next major upside extension through the yearly high at 1.3870 and towards a retest of the 2018 high at 1.4377 further up. Only a monthly close below 1.3000 negates.

GBPUSD Chart
R2 1.3461 - 15 June high - Medium
R1 1.3431 - 9 July high - Medium
S1 1.3262 - 2 July low - Medium
S2 1.3212 - 30 June low - Medium
GBPUSD: fundamental overview

Sterling has been underpinned by a combination of easing domestic political uncertainty and resilient Bank of England rate expectations, although those gains have been tempered by renewed demand for the US Dollar on escalating Middle East tensions. With Andy Burnham widely expected to succeed Keir Starmer as Prime Minister later this month, markets have largely welcomed the prospect of a swift political transition, shifting their attention back toward the UK’s economic outlook and fiscal policy. At the same time, the BoE’s relatively hawkish stance, with policymakers continuing to express concern over sticky services inflation and markets still pricing in a reasonable chance of another rate hike before year-end, has helped support the pound. However, Cable’s upside has been constrained as fresh US strikes on Iran and the threat of further regional escalation have revived safe-haven demand for the Greenback. Meanwhile, the minutes from the Federal Reserve’s June meeting reinforced the view of a divided central bank, with policymakers split between keeping rates near current levels and tightening further should inflation remain persistent, leaving investors focused on incoming US inflation data for clearer direction on the Fed’s next move.

 
USDJPY: technical overview

The major pair has extended its run to fresh multi-decade highs, with the latest push through 160.00 opening the door for further upside towards 165.00-170.00. At the same time, daily studies are looking quite stretched, suggesting we could see a healthy correction on the horizon. A break back below 160.48 would now strengthen the case for a larger pullback. Until then, the market will continue to be focused on additional gains.

USDJPY Chart
R2 163.00 - Figure - Medium
R1 162.84 - Multi-Year high/1 July 2026 - Strong
S1 161.00 - Figure - Medium
S2 160.48 - 3 July low - Medium
USDJPY: fundamental overview

The Yen remains under pressure as the wide interest rate differential between Japan and the United States continues to favor the US Dollar, even after USDJPY pulled back from fresh multi-decade highs above 163.00. While the Bank of Japan remains committed to gradually normalizing policy following its June rate hike, markets continue to see its tightening cycle lagging well behind the Federal Reserve, where expectations for further policy restraint remain elevated despite recent signs of softer US economic momentum. At the same time, renewed fighting between the US and Iran has driven oil prices higher, creating an additional headwind for the import-dependent Japanese economy by worsening its terms of trade and weighing on the Yen. Traders also remain highly alert to the risk of Japanese currency intervention, with USDJPY still trading well above the levels that previously prompted Tokyo to step into the market. Although officials have refrained from issuing stronger verbal warnings in recent days, the absence of rhetoric has done little to diminish speculation that authorities could intervene again if exchange rate moves become excessively volatile, particularly as next week’s US inflation data has the potential to reshape Fed expectations and narrow the yield advantage that has fueled the Dollar’s rally against the Yen.

 
AUDUSD: technical overview

There are signs of the formation of a longer-term base with the market recovering out from a meaningful longer-term support zone. The latest monthly close back above 0.7000 takes the big picture pressure off the downside and strengthens the case for a bottom, with the focus now on a push towards 0.8000. Setbacks should now be well supported ahead of 0.6700.

AUDUSD Chart
R2 0.7089 - 15 June high - Strong
R1 0.6979 - 11 June low - Medium
S1 0.6865 - 30 June low - Medium
S2 0.6833 - 30 March low - Strong
AUDUSD: fundamental overview

The Australian dollar is trading with a firmer tone, supported primarily by a softer US dollar and an improvement in broader risk appetite, although gains remain constrained by elevated geopolitical tensions in the Middle East. While the latest FOMC minutes reinforced the Federal Reserve’s concern over upside inflation risks and kept the prospect of further policy tightening alive, the greenback has struggled to capitalize, allowing the Aussie to recover. Domestically, expectations for additional Reserve Bank of Australia tightening have received fresh support after Assistant Governor Sarah Hunter reiterated that policymakers remain prepared to act if necessary to ensure inflation returns sustainably to target, despite recent moderation in monthly inflation readings. External developments in China also remain pivotal for the Australian dollar, with stronger-than-expected producer price inflation pointing to improving industrial pricing power, even as softer consumer inflation underscores lingering weakness in domestic demand, leaving the overall backdrop for Australia’s largest trading partner mixed.

 
Suggested reading

The shoemaker’s son behind Britain’s first financial crisis, J. Tett, Financial Times (July 9, 2026)

Private Capital Is Taking AI Chips Off the Table, E. Luz, Morningstar (July 9, 2026)


Any opinions, news, research, analyses, prices or other information ("information") contained on this Blog, constitutes marketing communication and it has not been prepared in accordance with legal requirements designed to promote the independence of investment research. Further, the information contained within this Blog does not contain (and should not be construed as containing) investment advice or an investment recommendation, or an offer of, or solicitation for, a transaction in any financial instrument. LMAX Group has not verified the accuracy or basis-in-fact of any claim or statement made by any third parties as comments for every Blog entry.

LMAX Group will not accept liability for any loss or damage, including without limitation to, any loss of profit, which may arise directly or indirectly from use of or reliance on such information. No representation or warranty is given as to the accuracy or completeness of the above information. While the produced information was obtained from sources deemed to be reliable, LMAX Group does not provide any guarantees about the reliability of such sources. Consequently any person acting on it does so entirely at his or her own risk. It is not a place to slander, use unacceptable language or to promote LMAX Group or any other FX and CFD provider and any such postings, excessive or unjust comments and attacks will not be allowed and will be removed from the site immediately.

Day Image
9th July 2026 | view in browser
From Fed focus to frontline risk

Geopolitical tensions in the Middle East continue to dominate markets, driving oil sharply higher and keeping risk sentiment cautious, while a largely expected hawkish Fed Minutes prompted a “sell-the-fact” pullback in the US dollar and helped fuel a late rebound in US equities.


Performance chart 30day v. USD (%)
Performance Chart
 
 
Technical & fundamental highlights
EURUSD: technical overview

The Euro outlook remains constructive with higher lows sought out on dips in favor of the next major upside extension targeting the 2021 high at 1.2350. Setbacks should be exceptionally well supported ahead of 1.1300.

EURUSD Chart
R2 1.1529 - 18 June high - Medium
R1 1.1473 - 2 July high - Medium
S1 1.1325 - 24 June/2026 low - Medium
S2 1.1300 - Figure - Medium
EURUSD: fundamental overview

The euro is trading with a modestly firmer tone against the US dollar after recovering from earlier losses as broad-based dollar selling outweighed support for the greenback from renewed geopolitical tensions and a hawkish set of Federal Reserve minutes. While the Fed reinforced a higher-for-longer policy message and kept the prospect of further tightening on the table if inflation remains stubborn, markets focused more on softer US growth expectations and recent signs of labor market cooling, limiting the dollar’s upside. On the euro side, expectations that the European Central Bank may need to keep policy restrictive have been supported by comments from ECB policymakers, including Schnabel and Panetta, who warned that heightened tensions in the Middle East and the risk of energy supply disruptions through the Strait of Hormuz could sustain inflationary pressures despite a fragile growth backdrop. That combination of persistent inflation risks and cautious central bank rhetoric has helped underpin the single currency, although escalating US-Iran tensions and the resulting risk-off mood continue to cap upside as investors weigh the implications of higher energy prices and slower global growth.

 
GBPUSD: technical overview

The Pound remains exceptionally well supported on dips into the 1.3000 area, with the price largely consolidating above the psychological barrier and previous resistance turned support in the form of the 2023 high. Look for the market to continue be well supported on dips ahead of the next major upside extension through the yearly high at 1.3870 and towards a retest of the 2018 high at 1.4377 further up. Only a monthly close below 1.3000 negates.

GBPUSD Chart
R2 1.3461 - 15 June high - Medium
R1 1.3411 - 8 July high - Medium
S1 1.3262 - 2 July low - Medium
S2 1.3212 - 30 June low - Medium
GBPUSD: fundamental overview

The pound has found renewed support as broad-based US Dollar weakness offsets lingering geopolitical uncertainty and mixed domestic fundamentals, allowing GBPUSD to push back above the 1.3400 level. Markets continue to price a more hawkish path from the Bank of England, with expectations for at least one additional rate hike this year firming amid persistent services inflation and renewed upside risks to energy prices following the escalation in Middle East tensions. However, sterling’s gains remain tempered by evidence of a slowing UK economy, including softer activity, easing wage growth and a weakening labor market, reinforcing the difficult balancing act facing policymakers between containing inflation and supporting growth. Political developments are also in focus following Prime Minister Starmer’s resignation, although expectations of policy continuity under likely successor Andy Burnham have helped limit market uncertainty. Meanwhile, the latest FOMC minutes reinforced the prospect of US rates remaining higher for longer, but a subsequent pullback in the US Dollar has ultimately allowed sterling to regain the upper hand despite the broader backdrop of elevated geopolitical risks.

 
USDJPY: technical overview

The major pair has extended its run to fresh multi-decade highs, with the latest push through 160.00 opening the door for further upside towards 165.00-170.00. At the same time, daily studies are looking quite stretched, suggesting we could see a healthy correction on the horizon. A break back below 160.48 would now strengthen the case for a larger pullback. Until then, the market will continue to be focused on additional gains.

USDJPY Chart
R2 163.00 - Figure - Medium
R1 162.84 - Multi-Year high/1 July 2026 - Strong
S1 161.00 - Figure - Medium
S2 160.48 - 3 July low - Medium
USDJPY: fundamental overview

The yen remains under pressure as a widening US-Japan yield differential continues to favor the dollar, with hawkish Federal Reserve minutes reinforcing expectations that US interest rates will stay higher for longer and lifting Treasury yields. While renewed US-Iran tensions and concerns over the Strait of Hormuz have supported safe-haven demand for the greenback, the yen has failed to benefit meaningfully as investors remain focused on the Bank of Japan’s still-accommodative policy outlook. Dovish comments from BoJ board member Asada, who reiterated that clearer evidence of demand-driven inflation is needed before backing further rate hikes, reinforced expectations that any additional policy tightening will be gradual. At the same time, Japan’s dependence on imported energy leaves the yen vulnerable to higher oil prices stemming from geopolitical risks. Nevertheless, traders remain alert to the growing risk of official intervention as USDJPY trades near multi-decade highs, with speculative short-yen positioning still heavily stretched, raising the prospect of a sharp reversal should Japanese authorities decide to step into the market.

 
AUDUSD: technical overview

There are signs of the formation of a longer-term base with the market recovering out from a meaningful longer-term support zone. The latest monthly close back above 0.7000 takes the big picture pressure off the downside and strengthens the case for a bottom, with the focus now on a push towards 0.8000. Setbacks should now be well supported ahead of 0.6700.

AUDUSD Chart
R2 0.7089 - 15 June high - Strong
R1 0.6979 - 11 June low - Medium
S1 0.6865 - 30 June low - Medium
S2 0.6833 - 30 March low - Strong
AUDUSD: fundamental overview

The Australian dollar is trading in a relatively tight range as competing fundamental forces leave investors without a clear directional catalyst. On one hand, the currency continues to find support from the Reserve Bank of Australia’s still-hawkish policy stance, with policymakers maintaining that inflation remains too high to rule out further tightening despite recent signs of easing price pressures. On the other hand, the release of hawkish Federal Reserve minutes has reinforced expectations that US interest rates could remain higher for longer, limiting the Aussie’s upside by supporting the US dollar. Heightened geopolitical tensions in the Middle East have also created offsetting effects, weighing on broader risk sentiment while simultaneously boosting commodity prices, which offers some support to Australia’s terms of trade as a major energy exporter. However, with iron ore and Chinese demand remaining the key drivers of Australia’s external outlook, investors are now looking to China’s latest inflation data for clearer signals on the health of domestic demand and the broader economic recovery. Until either Chinese data or incoming US economic releases materially shift interest rate expectations, the Australian dollar is likely to remain driven by the balance between resilient commodity prices, global risk appetite and the evolving policy outlook from both the RBA and the Federal Reserve.

 
Suggested reading

Palantir: profits, procurement and power, J. Miller, Financial Times (July 8, 2026)

Nothing in Investing is “Doing Nothing”, J. Wiggins, Behavioural Investment (July 8, 2026)


Any opinions, news, research, analyses, prices or other information ("information") contained on this Blog, constitutes marketing communication and it has not been prepared in accordance with legal requirements designed to promote the independence of investment research. Further, the information contained within this Blog does not contain (and should not be construed as containing) investment advice or an investment recommendation, or an offer of, or solicitation for, a transaction in any financial instrument. LMAX Group has not verified the accuracy or basis-in-fact of any claim or statement made by any third parties as comments for every Blog entry.

LMAX Group will not accept liability for any loss or damage, including without limitation to, any loss of profit, which may arise directly or indirectly from use of or reliance on such information. No representation or warranty is given as to the accuracy or completeness of the above information. While the produced information was obtained from sources deemed to be reliable, LMAX Group does not provide any guarantees about the reliability of such sources. Consequently any person acting on it does so entirely at his or her own risk. It is not a place to slander, use unacceptable language or to promote LMAX Group or any other FX and CFD provider and any such postings, excessive or unjust comments and attacks will not be allowed and will be removed from the site immediately.

Day Image
8th July 2026 | view in browser
Geopolitics reasserts influence on macro narrative

Renewed US strikes on Iran, rising geopolitical risk and firmer oil prices are keeping markets defensive, supporting the dollar and safe havens while investors balance Middle East developments against the evolving Federal Reserve outlook.


Performance chart 30day v. USD (%)
Performance Chart
 
 
Technical & fundamental highlights
EURUSD: technical overview

The Euro outlook remains constructive with higher lows sought out on dips in favor of the next major upside extension targeting the 2021 high at 1.2350. Setbacks should be exceptionally well supported ahead of 1.1300.

EURUSD Chart
R2 1.1529 - 18 June high - Medium
R1 1.1473 - 2 July high - Medium
S1 1.1325 - 24 June/2026 low - Medium
S2 1.1300 - Figure - Medium
EURUSD: fundamental overview

The euro remains under modest pressure as renewed geopolitical tensions in the Middle East continue to drive safe-haven demand for the US Dollar, with the latest escalation around the Strait of Hormuz overshadowing otherwise supportive Eurozone fundamentals. While several ECB policymakers have maintained a relatively hawkish tone and markets still expect at least one additional ECB rate hike later this year, those signals have struggled to gain traction as investors focus instead on rising energy prices, geopolitical uncertainty and the resulting boost to the greenback. At the same time, softer-than-expected US labor market data has tempered expectations for further Federal Reserve tightening, limiting broader USD upside and preventing a deeper slide in EURUSD. On the European side, easing inflation has reduced expectations for an imminent ECB move, leaving the single currency lacking a strong domestic catalyst. Attention now turns to the release of the FOMC minutes, which will be scrutinized for clues on how concerned policymakers remain about persistent inflation, particularly if higher oil prices driven by Middle East tensions threaten to keep the Fed’s hawkish bias intact.

 
GBPUSD: technical overview

The Pound remains exceptionally well supported on dips into the 1.3000 area, with the price largely consolidating above the psychological barrier and previous resistance turned support in the form of the 2023 high. Look for the market to continue be well supported on dips ahead of the next major upside extension through the yearly high at 1.3870 and towards a retest of the 2018 high at 1.4377 further up. Only a monthly close below 1.3000 negates.

GBPUSD Chart
R2 1.3461 - 15 June high - Medium
R1 1.3402 - 7 July high - Medium
S1 1.3262 - 2 July low - Medium
S2 1.3212 - 30 June low - Medium
GBPUSD: fundamental overview

The pound has lost momentum after a nine-session rally, with GBPUSD retreating from the 1.3400 area as a resurgence in Middle East tensions boosted demand for the safe-haven US Dollar. The renewed escalation around the Strait of Hormuz has weighed on broader risk sentiment, overshadowing an otherwise supportive domestic backdrop for sterling. Fundamentally, the Bank of England remains one of the more hawkish major central banks, with persistent services inflation, elevated inflation expectations and recent hawkish dissent within the Monetary Policy Committee continuing to underpin expectations that policy will need to stay restrictive. However, those positives have recently been outweighed by shifting global risk sentiment and evolving US rate expectations, with sterling’s prior gains driven more by broad US Dollar weakness following softer US labor market data than by UK-specific catalysts. Looking ahead, markets are focused on the FOMC minutes for further guidance on the Federal Reserve’s policy outlook, while UK data remain relatively light, leaving global risk appetite and the direction of the US Dollar as the primary drivers of sterling in the near term.

 
USDJPY: technical overview

The major pair has extended its run to fresh multi-decade highs, with the latest push through 160.00 opening the door for further upside towards 165.00-170.00. At the same time, daily studies are looking quite stretched, suggesting we could see a healthy correction on the horizon. A break back below 160.63 would now strengthen the case for a larger pullback. Until then, the market will continue to be focused on additional gains.

USDJPY Chart
R2 163.00 - Figure - Medium
R1 162.84 - Multi-Year high/1 July 2026 - Strong
S1 161.00 - Figure - Medium
S2 160.48 - 3 July low - Medium
USDJPY: fundamental overview

The yen remains fundamentally weak despite finding intermittent support from renewed intervention fears and a modest pullback in US Treasury yields, with USDJPY continuing to trade near multi-decade highs as investors sell into rallies. Japan’s stronger-than-expected household spending data and repeated warnings from Finance Minister Katayama that authorities stand ready to intervene have helped slow the pace of depreciation, while Reuters reporting that officials may shift toward targeting speculative positions rather than relying on verbal warnings has prompted some short-covering in the yen. However, soft wage growth and the Bank of Japan’s still-cautious approach to further tightening continue to limit sustained gains. Although the BOJ lifted rates to 1% in June, board member Asada reinforced that future hikes will depend on evidence of demand-driven inflation and stronger wage growth, keeping markets focused on an October-December timeframe for the next move rather than an imminent hike. Meanwhile, the wide policy gap with the Federal Reserve continues to underpin carry trade demand, even as expectations for additional Fed tightening have eased following weaker US labor data. Escalating geopolitical tensions after renewed US strikes on Iran and attacks on commercial shipping in the Strait of Hormuz have also boosted safe-haven demand, but so far that support has been outweighed by Japan’s still-low yield environment and persistent capital outflows, leaving the broader bias for the yen tilted to the downside.

 
AUDUSD: technical overview

There are signs of the formation of a longer-term base with the market recovering out from a meaningful longer-term support zone. The latest monthly close back above 0.7000 takes the big picture pressure off the downside and strengthens the case for a bottom, with the focus now on a push towards 0.8000. Setbacks should now be well supported ahead of 0.6700.

AUDUSD Chart
R2 0.7089 - 15 June high - Strong
R1 0.6979 - 11 June low - Medium
S1 0.6865 - 30 June low - Medium
S2 0.6833 - 30 March low - Strong
AUDUSD: fundamental overview

The Australian dollar remains primarily driven by swings in global risk sentiment, with renewed US-Iran hostilities and escalating attacks around the Strait of Hormuz boosting oil prices and reviving safe-haven demand for the US dollar, weighing on the high-beta Aussie. At the same time, higher energy prices are reinforcing concerns that global inflation pressures could prove more persistent, supporting expectations that the Federal Reserve will keep policy restrictive for longer ahead of the FOMC minutes and US jobless claims. Domestically, the Reserve Bank of Australia continues to provide an important offset, with Assistant Governor Hunter reiterating that the Board stands ready to tighten policy further if the oil shock lifts inflation expectations, while stressing that supply-side inflation cannot simply be ignored despite the potential hit to growth. Those comments reinforce the RBA’s hawkish bias following three rate hikes this year, even as policymakers remain data dependent. With little domestic data on the immediate calendar, the Australian dollar is likely to remain highly sensitive to developments in the Middle East, moves in the US dollar, broader risk appetite and evolving expectations for both Fed and RBA policy.

 
Suggested reading

Is It Different This Time? 4 Open Questions, A. Grossman, HumbleDollar (July 6, 2026)

Your Investing Plans Are Double the Historical Reality, M. Hulbert, Marketwatch (July 6, 2026)


Any opinions, news, research, analyses, prices or other information ("information") contained on this Blog, constitutes marketing communication and it has not been prepared in accordance with legal requirements designed to promote the independence of investment research. Further, the information contained within this Blog does not contain (and should not be construed as containing) investment advice or an investment recommendation, or an offer of, or solicitation for, a transaction in any financial instrument. LMAX Group has not verified the accuracy or basis-in-fact of any claim or statement made by any third parties as comments for every Blog entry.

LMAX Group will not accept liability for any loss or damage, including without limitation to, any loss of profit, which may arise directly or indirectly from use of or reliance on such information. No representation or warranty is given as to the accuracy or completeness of the above information. While the produced information was obtained from sources deemed to be reliable, LMAX Group does not provide any guarantees about the reliability of such sources. Consequently any person acting on it does so entirely at his or her own risk. It is not a place to slander, use unacceptable language or to promote LMAX Group or any other FX and CFD provider and any such postings, excessive or unjust comments and attacks will not be allowed and will be removed from the site immediately.

Day Image
7th July 2026 | view in browser
Record stocks, mixed dollar, eyes on the Fed

Global markets enter the day with a constructive risk backdrop as record US equities, a mixed dollar, contained oil prices and growing focus on Fed communication set the stage for German industrial production, US ADP employment and Wednesday’s closely watched FOMC minutes.


Performance chart 30day v. USD (%)
Performance Chart
 
 
Technical & fundamental highlights
EURUSD: technical overview

The Euro outlook remains constructive with higher lows sought out on dips in favor of the next major upside extension targeting the 2021 high at 1.2350. Setbacks should be exceptionally well supported ahead of 1.1300.

EURUSD Chart
R2 1.1529 - 18 June high - Medium
R1 1.1473 - 2 July high - Medium
S1 1.1325 - 24 June/2026 low - Medium
S2 1.1300 - Figure - Medium
EURUSD: fundamental overview

The euro has found a more constructive footing as signs of resilience in the eurozone economy help offset fading expectations for additional ECB tightening. Business activity returned to the 50.0 expansion threshold in June, while stronger-than-expected industrial production in France and Spain prompted upgrades to second-quarter growth forecasts, reinforcing the view that the worst of the energy shock may be passing. Although softer eurozone inflation has led markets to scale back expectations for further ECB rate hikes, policymakers continue to resist declaring victory over inflation, with ECB Executive Board member Isabel Schnabel warning that the recent energy shock cannot simply be looked through because of the risk of broader second-round price pressures, while Chief Economist Philip Lane has continued to leave the door open to a final 25 basis point hike in September. Meanwhile, the US Dollar has lost momentum after weaker-than-expected US payrolls data prompted investors to pare back Federal Reserve tightening expectations, helping narrow policy divergence and limit downside pressure on EURUSD, although lingering geopolitical tensions around the Strait of Hormuz continue to underpin safe-haven demand for the greenback and cap stronger euro gains.

 
GBPUSD: technical overview

The Pound remains exceptionally well supported on dips into the 1.3000 area, with the price largely consolidating above the psychological barrier and previous resistance turned support in the form of the 2023 high. Look for the market to continue be well supported on dips ahead of the next major upside extension through the yearly high at 1.3870 and towards a retest of the 2018 high at 1.4377 further up. Only a monthly close below 1.3000 negates.

GBPUSD Chart
R2 1.3461 - 15 June high - Medium
R1 1.3400 - Figure - Medium
S1 1.3262 - 2 July low - Medium
S2 1.3212 - 30 June low - Medium
GBPUSD: fundamental overview

Sterling has extended its recovery, with GBPUSD posting a string of consecutive daily gains as the US Dollar continues to unwind its post-Fed rally following last week’s much weaker-than-expected US payrolls report, which prompted markets to scale back expectations for further near-term Federal Reserve tightening. The pound has also drawn support from easing political uncertainty after the UK’s Labour leadership transition appeared to become increasingly orderly, reducing the risk premium that had weighed on the currency since the Prime Minister’s resignation. Domestically, the Bank of England remains one of the more hawkish major central banks after its June meeting produced a 7-2 vote to keep rates unchanged, with two policymakers favoring another hike and inflation still expected to remain above target later this year despite lower energy prices. That combination of relatively firm UK rate expectations and fading US dollar strength has underpinned sterling’s recent advance, although traders remain cautious ahead of the FOMC minutes, upcoming Bank of England communications and developments in the Labour leadership process, all of which could shape the next leg for GBPUSD.

 
USDJPY: technical overview

The major pair has extended its run to fresh multi-decade highs, with the latest push through 160.00 opening the door for further upside towards 165.00-170.00. At the same time, daily studies are looking quite stretched, suggesting we could see a healthy correction on the horizon. A break back below 160.63 would now strengthen the case for a larger pullback. Until then, the market will continue to be focused on additional gains.

USDJPY Chart
R2 163.00 - Figure - Medium
R1 162.84 - Multi-Year high/1 July 2026 - Strong
S1 161.00 - Figure - Medium
S2 160.48 - 3 July low - Medium
USDJPY: fundamental overview

The Yen remains under pressure as wide US-Japan yield differentials continue to underpin carry trades despite the Bank of Japan’s June rate hike to 1.00%, with markets viewing the move as insufficient to materially narrow the roughly 250bp policy gap with the Federal Reserve. Reports that Japanese authorities have shifted away from issuing verbal intervention warnings in favor of targeting speculative positioning have reduced the deterrent effect that previously supported the currency, allowing USDJPY to climb back toward cycle highs above 162 as traders increasingly view any intervention as tactical rather than level-based. While the risk of surprise official action continues to discourage aggressive Yen selling, investors remain focused on incoming wage data for evidence of sustained domestic inflation pressures that could bring forward another BoJ rate hike. At the same time, expectations that the Fed could still tighten policy again this year continue to favor the US Dollar, leaving the Yen fundamentally weighed down by persistent carry demand unless stronger Japanese inflation data or decisive intervention shifts the narrative.

 
AUDUSD: technical overview

There are signs of the formation of a longer-term base with the market recovering out from a meaningful longer-term support zone. The latest monthly close back above 0.7000 takes the big picture pressure off the downside and strengthens the case for a bottom, with the focus now on a push towards 0.8000. Setbacks should now be well supported ahead of 0.6700.

AUDUSD Chart
R2 0.7089 - 15 June high - Strong
R1 0.6979 - 11 June low - Medium
S1 0.6865 - 30 June low - Medium
S2 0.6833 - 30 March low - Strong
AUDUSD: fundamental overview

The Australian Dollar continues to draw support from a softer US Dollar after last week’s disappointing US payrolls report prompted markets to scale back expectations for near-term Federal Reserve tightening, offsetting the impact of otherwise resilient US economic data. While the latest ISM services survey remained firmly in expansionary territory and Fed Governor Christopher Waller maintained a hawkish tone, investors remain focused on signs of cooling in the US labor market and await the FOMC minutes for further guidance under Chair Kevin Warsh. On the domestic front, the Reserve Bank of Australia’s latest meeting minutes reinforced that policymakers remain prepared to raise interest rates again if inflation proves persistent, preserving the RBA’s relatively hawkish stance among major central banks and helping underpin the Aussie. At the same time, improving Australian PMI data have pointed to a return to modest economic expansion, although softer business confidence and weaker new orders suggest the recovery remains fragile, while broader sentiment toward China and global risk appetite continue to play an important role in shaping the Australian Dollar’s direction.

 
Suggested reading

Warsh Must Explain That The Fed Simply Can’t Fight Inflation, J. Tamny, Forbes (July 5, 2026)

The Fed Needs Independence, Not Immunity, N. Cachanosky, The Daily Economy (July 6, 2026)


Any opinions, news, research, analyses, prices or other information ("information") contained on this Blog, constitutes marketing communication and it has not been prepared in accordance with legal requirements designed to promote the independence of investment research. Further, the information contained within this Blog does not contain (and should not be construed as containing) investment advice or an investment recommendation, or an offer of, or solicitation for, a transaction in any financial instrument. LMAX Group has not verified the accuracy or basis-in-fact of any claim or statement made by any third parties as comments for every Blog entry.

LMAX Group will not accept liability for any loss or damage, including without limitation to, any loss of profit, which may arise directly or indirectly from use of or reliance on such information. No representation or warranty is given as to the accuracy or completeness of the above information. While the produced information was obtained from sources deemed to be reliable, LMAX Group does not provide any guarantees about the reliability of such sources. Consequently any person acting on it does so entirely at his or her own risk. It is not a place to slander, use unacceptable language or to promote LMAX Group or any other FX and CFD provider and any such postings, excessive or unjust comments and attacks will not be allowed and will be removed from the site immediately.

Day Image
6th July 2026 | view in browser
Risk assets extend gains as Fed expectations soften

Global markets begin the week with a constructive risk tone as softer Fed expectations lift equities and weigh on the dollar, although persistent uncertainty surrounding the Strait of Hormuz continues to keep a geopolitical risk premium embedded in energy markets.


Performance chart 30day v. USD (%)
Performance Chart
 
 
Technical & fundamental highlights
EURUSD: technical overview

The Euro outlook remains constructive with higher lows sought out on dips in favor of the next major upside extension targeting the 2021 high at 1.2350. Setbacks should be exceptionally well supported ahead of 1.1300.

EURUSD Chart
R2 1.1529 - 18 June high - Medium
R1 1.1473 - 2 July high - Medium
S1 1.1325 - 24 June/2026 low - Medium
S2 1.1300 - Figure - Medium
EURUSD: fundamental overview

The euro begins the new week on relatively steady footing, though its upside remains constrained by a widening policy divergence with the United States as markets continue to price a more hawkish Federal Reserve relative to the ECB. While the ECB delivered a precautionary rate hike in June, recent comments from Governing Council member Emmanuel Moulin reinforce the view that policymakers see themselves in a comfortable position and are not embarking on a fresh tightening cycle, with easing oil prices and the reopening of the Strait of Hormuz reducing immediate inflation risks. That has encouraged investors to scale back expectations for additional ECB tightening later this year, limiting euro yield support. At the same time, improving risk sentiment and China’s renewed push to strengthen trade and investment ties with European businesses ahead of the China-EU summit offers a modest constructive backdrop for the euro by supporting the region’s export outlook and broader growth sentiment. Overall, however, EURUSD remains largely driven by the balance between a softer energy outlook and improving European growth prospects on one side, and the prospect of relatively higher US interest rates and resilient dollar demand on the other.

 
GBPUSD: technical overview

The Pound remains exceptionally well supported on dips into the 1.3000 area, with the price largely consolidating above the psychological barrier and previous resistance turned support in the form of the 2023 high. Look for the market to continue be well supported on dips ahead of the next major upside extension through the yearly high at 1.3870 and towards a retest of the 2018 high at 1.4377 further up. Only a monthly close below 1.3000 negates.

GBPUSD Chart
R2 1.3461 - 15 June high - Medium
R1 1.3385 - 2 July high - Medium
S1 1.3262 - 2 July low - Medium
S2 1.3212 - 30 June low - Medium
GBPUSD: fundamental overview

Sterling has been supported primarily by broad US dollar weakness after softer US labor market data prompted markets to scale back expectations for a near-term Federal Reserve rate hike, narrowing yield support for the greenback and lifting GBPUSD. On the domestic side, the pound continues to draw support from a relatively resilient Bank of England outlook, with Governor Bailey reiterating that inflation would already be back at target were it not for the impact of the Middle East conflict, reinforcing the view that underlying UK inflation pressures remain contained but that policymakers are not yet ready to declare victory. Markets continue to price meaningful odds of another BoE rate hike later this year, helping preserve sterling’s yield appeal. Political developments have also been modestly supportive, with Andy Burnham’s commitment to fiscal discipline and maintaining the state pension triple lock easing concerns over fiscal credibility following the recent leadership transition, although investors remain focused on upcoming budget decisions for confirmation that spending plans will remain consistent with fiscal rules. Overall, the combination of a softer US dollar, relatively hawkish BoE expectations and reduced UK political risk has kept sterling well supported heading into the new week.

 
USDJPY: technical overview

The major pair has extended its run to fresh multi-decade highs, with the latest push through 160.00 opening the door for further upside towards 165.00-170.00. At the same time, daily studies are looking quite stretched, suggesting we could see a healthy correction on the horizon. A break back below 160.63 would now strengthen the case for a larger pullback. Until then, the market will continue to be focused on additional gains.

USDJPY Chart
R2 163.00 - Figure - Medium
R1 162.84 - Multi-Year high/1 July 2026 - Strong
S1 161.00 - Figure - Medium
S2 160.48 - 3 July low - Medium
USDJPY: fundamental overview

The Yen remains under pressure as the new week begins, with USDJPY pushing higher after only a modest pullback from fresh multi-decade highs. While softer US labor market data has trimmed expectations for additional Federal Reserve tightening and provided some temporary support for the yen, the wide interest rate differential between the Fed and the Bank of Japan continues to underpin carry trade demand against the Japanese currency. At the same time, intervention risks remain elevated, with Finance Minister Katayama reiterating that Tokyo stands ready to act against excessive currency moves while maintaining close coordination with US authorities. Domestically, a 30-year high in Japanese government bond yields, growing evidence that yen weakness is squeezing businesses through higher import costs, and debate over whether fiscal expansion will limit further BOJ tightening are all keeping markets focused on Japan’s policy outlook. Meanwhile, lingering geopolitical uncertainty surrounding the Strait of Hormuz continues to pose an additional risk for Japan given its dependence on imported energy, reinforcing the sensitivity of the yen to shifts in global risk sentiment and oil prices.

 
AUDUSD: technical overview

There are signs of the formation of a longer-term base with the market recovering out from a meaningful longer-term support zone. The latest monthly close back above 0.7000 takes the big picture pressure off the downside and strengthens the case for a bottom, with the focus now on a push towards 0.8000. Setbacks should now be well supported ahead of 0.6700.

AUDUSD Chart
R2 0.7089 - 15 June high - Strong
R1 0.6979 - 11 June low - Medium
S1 0.6865 - 30 June low - Medium
S2 0.6833 - 30 March low - Strong
AUDUSD: fundamental overview

The Australian dollar has found renewed support as softer-than-expected US labor market data triggered a broad US Dollar pullback, prompting markets to scale back expectations for near-term Federal Reserve tightening and improving demand for higher-beta currencies. Domestically, Australia’s June PMI data provided an additional tailwind after both the manufacturing and services sectors unexpectedly returned to expansion, suggesting economic activity has stabilized despite lingering softness in demand. That said, underlying details remain more mixed, with new orders still contracting, business confidence at a two-and-a-half-year low and easing price pressures reinforcing expectations that the Reserve Bank of Australia can remain patient on further policy tightening. Broader risk sentiment has also improved at the start of the week, helping cyclical currencies such as the Aussie, while investors continue to monitor incoming Chinese economic data and policy developments given Australia’s close trade links with China.

 
Suggested reading

Nashville: the price of success, C. Jones, Financial Times (July 3, 2026)

The Fundamental Flaw Of Prediction Markets, J. Klement, Klement on Investing (July 1, 2026)


Any opinions, news, research, analyses, prices or other information ("information") contained on this Blog, constitutes marketing communication and it has not been prepared in accordance with legal requirements designed to promote the independence of investment research. Further, the information contained within this Blog does not contain (and should not be construed as containing) investment advice or an investment recommendation, or an offer of, or solicitation for, a transaction in any financial instrument. LMAX Group has not verified the accuracy or basis-in-fact of any claim or statement made by any third parties as comments for every Blog entry.

LMAX Group will not accept liability for any loss or damage, including without limitation to, any loss of profit, which may arise directly or indirectly from use of or reliance on such information. No representation or warranty is given as to the accuracy or completeness of the above information. While the produced information was obtained from sources deemed to be reliable, LMAX Group does not provide any guarantees about the reliability of such sources. Consequently any person acting on it does so entirely at his or her own risk. It is not a place to slander, use unacceptable language or to promote LMAX Group or any other FX and CFD provider and any such postings, excessive or unjust comments and attacks will not be allowed and will be removed from the site immediately.

Day Image
3rd July 2026 | view in browser
Holiday trading begins with the dollar on the defensive

Markets head into the new day with the US dollar under pressure after soft payrolls, though relatively hawkish central bank expectations remain intact as traders navigate thinner conditions ahead of the US holiday.


Performance chart 30day v. USD (%)
Performance Chart
 
 
Technical & fundamental highlights
EURUSD: technical overview

The Euro outlook remains constructive with higher lows sought out on dips in favor of the next major upside extension targeting the 2021 high at 1.2350. Setbacks should be exceptionally well supported ahead of 1.1300.

EURUSD Chart
R2 1.1529 - 18 June high - Medium
R1 1.1473 - 2 July high - Medium
S1 1.1325 - 24 June/2026 low - Medium
S2 1.1300 - Figure - Medium
EURUSD: fundamental overview

The euro is finding support primarily from broad US Dollar weakness following a much softer-than-expected June US employment report, which prompted markets to scale back expectations for another near-term Federal Reserve rate hike and pushed US Treasury yields lower. However, the single currency’s own fundamental backdrop remains mixed. While softer-than-expected Eurozone inflation has reinforced expectations that the European Central Bank is approaching the end of its tightening cycle, ECB President Christine Lagarde has pushed back against premature dovish repricing, defending June’s rate hike as appropriate given persistent underlying inflation pressures—particularly in the services sector—and reiterating that future policy decisions will remain data dependent. At the same time, Germany’s newly announced package of structural reforms—including measures to reduce bureaucracy, improve labor market flexibility and support long-term fiscal sustainability—has modestly improved sentiment toward the region’s largest economy, complementing ongoing fiscal spending on infrastructure and defense. Meanwhile, lingering geopolitical tensions in the Middle East continue to underpin safe-haven demand for the US Dollar, leaving EURUSD largely caught between improving sentiment toward Europe and the Fed’s still relatively hawkish policy stance, with markets continuing to expect US interest rates to remain restrictive even after the softer payrolls report.

 
GBPUSD: technical overview

The Pound remains exceptionally well supported on dips into the 1.3000 area, with the price largely consolidating above the psychological barrier and previous resistance turned support in the form of the 2023 high. Look for the market to continue be well supported on dips ahead of the next major upside extension through the yearly high at 1.3870 and towards a retest of the 2018 high at 1.4377 further up. Only a monthly close below 1.3000 negates.

GBPUSD Chart
R2 1.3461 - 15 June high - Medium
R1 1.3385 - 2 July high - Medium
S1 1.3262 - 2 July low - Medium
S2 1.3212 - 30 June low - Medium
GBPUSD: fundamental overview

The British Pound is finding support from a combination of a sharply weaker US Dollar and a still relatively hawkish Bank of England backdrop. Softer-than-expected US June payrolls, downward revisions to prior months’ employment data and falling US Treasury yields have prompted markets to scale back expectations for further Federal Reserve tightening, weighing broadly on the greenback and lifting GBPUSD. Domestically, sterling has remained resilient despite ongoing political uncertainty following Prime Minister Keir Starmer’s resignation, as leadership frontrunner Andy Burnham’s commitment to maintaining fiscal discipline has helped reassure investors and limit political risk premiums. At the same time, Bank of England policymakers continue to strike a cautious but inflation-focused tone. Governor Andrew Bailey has resisted signaling imminent policy easing, while MPC member Catherine Mann reiterated that inflation risks remain tilted to the upside and warned an “activist” policy response may still be required if inflation expectations deteriorate. That combination continues to support UK yields and reinforces expectations that UK interest rates are likely to remain restrictive for longer, providing an underlying pillar of support for the Pound even as near-term price action remains heavily influenced by shifts in US Dollar sentiment.

 
USDJPY: technical overview

The major pair has extended its run to fresh multi-decade highs, with the latest push through 160.00 opening the door for further upside towards 165.00-170.00. At the same time, daily studies are looking quite stretched, suggesting we could see a healthy correction on the horizon. A break back below 160.63 would now strengthen the case for a larger pullback. Until then, the market will continue to be focused on additional gains.

USDJPY Chart
R2 163.00 - Figure - Medium
R1 162.84 - Multi-Year high/1 July 2026 - Strong
S1 161.00 - Figure - Medium
S2 160.63 - 2 July low - Medium
USDJPY: fundamental overview

The Yen has strengthened after a combination of softer-than-expected US labor market data and a sharp rise in intervention expectations triggered a broad unwind in USDJPY longs. Reports that Japanese authorities may stop telegraphing potential FX intervention and instead target speculative positioning without advance warning have significantly increased caution among traders, particularly with thinner liquidity around the US Independence Day holiday. Meanwhile, Japan’s latest services PMI showed activity returning to stronger expansion alongside the fastest input cost inflation in four years, reinforcing the case for further Bank of Japan policy normalization even as subdued business confidence argues for a gradual approach. While the Bank of Japan’s June rate hike to 1.00% marked its highest policy rate since 1995, the roughly 250–275 basis point interest rate differential with the Federal Reserve continues to support carry trade demand and limits the Yen’s ability to sustain gains on monetary policy alone. As a result, intervention remains the market’s primary catalyst for supporting the currency. Looking ahead, attention shifts to next week’s US data and the release of the FOMC minutes, which will help determine whether softer US economic momentum continues to erode Dollar support, while any signs of actual intervention from Tokyo remain a key risk for USDJPY.

 
AUDUSD: technical overview

There are signs of the formation of a longer-term base with the market recovering out from a meaningful longer-term support zone. The latest monthly close back above 0.7000 takes the big picture pressure off the downside and strengthens the case for a bottom, with the focus now on a push towards 0.8000. Setbacks should now be well supported ahead of 0.6700.

AUDUSD Chart
R2 0.7089 - 15 June high - Strong
R1 0.6979 - 11 June low - Medium
S1 0.6865 - 30 June low - Medium
S2 0.6833 - 30 March low - Strong
AUDUSD: fundamental overview

The Australian dollar recovered alongside the broader weakness in the US dollar after a softer-than-expected US jobs report briefly boosted expectations for Federal Reserve easing, although AUDUSD surrendered much of its initial rally as markets continued to grapple with the prospect of a more hawkish Fed under Chair Kevin Warsh. Domestically, Australia’s latest PMI data offered a mixed picture. The composite PMI returned to expansion at 50.4 and services activity rose back above the 50 threshold to 50.5, but the underlying details were less encouraging. New orders contracted for a fourth consecutive month, business confidence fell to its lowest level since late 2023, and firms largely relied on increased staffing to support activity while working through existing backlogs rather than benefiting from stronger demand. At the same time, easing input and output price pressures reinforced the view that inflation continues to moderate. With the Reserve Bank of Australia still maintaining one of the more restrictive policy stances among major central banks, the Australian dollar retains some underlying support, though its near-term direction continues to be driven primarily by US dollar dynamics, expectations for Fed policy, developments in China, and broader global risk sentiment.

 
Suggested reading

How a greeting card company produced a 200x return in just 18 months, G. Tett, Financial Times (July 2, 2026)

Evidence Dumb Money Is Transforming Stock Market, J. Adinolfi, Marketwatch (July 1, 2026)


Any opinions, news, research, analyses, prices or other information ("information") contained on this Blog, constitutes marketing communication and it has not been prepared in accordance with legal requirements designed to promote the independence of investment research. Further, the information contained within this Blog does not contain (and should not be construed as containing) investment advice or an investment recommendation, or an offer of, or solicitation for, a transaction in any financial instrument. LMAX Group has not verified the accuracy or basis-in-fact of any claim or statement made by any third parties as comments for every Blog entry.

LMAX Group will not accept liability for any loss or damage, including without limitation to, any loss of profit, which may arise directly or indirectly from use of or reliance on such information. No representation or warranty is given as to the accuracy or completeness of the above information. While the produced information was obtained from sources deemed to be reliable, LMAX Group does not provide any guarantees about the reliability of such sources. Consequently any person acting on it does so entirely at his or her own risk. It is not a place to slander, use unacceptable language or to promote LMAX Group or any other FX and CFD provider and any such postings, excessive or unjust comments and attacks will not be allowed and will be removed from the site immediately.

Day Image
2nd July 2026 | view in browser
Dollar firms ahead of critical US jobs report

Markets head into Thursday with investors focused squarely on the U.S. jobs report as resilient global central bank hawkishness, a firmer dollar, rising Treasury yields and softer oil prices continue to drive cross-asset price action.


Performance chart 30day v. USD (%)
Performance Chart
 
 
Technical & fundamental highlights
EURUSD: technical overview

The Euro outlook remains constructive with higher lows sought out on dips in favor of the next major upside extension targeting the 2021 high at 1.2350. Setbacks should be exceptionally well supported ahead of 1.1300.

EURUSD Chart
R2 1.1529 - 18 June high - Medium
R1 1.1440 - 23 June high - Medium
S1 1.1325 - 24 June/2026 low - Medium
S2 1.1300 - Figure - Medium
EURUSD: fundamental overview

The euro remains under modest pressure as markets continue to favor the US Dollar on the back of a widening policy divergence between the Federal Reserve and the European Central Bank. Softer-than-expected Eurozone inflation data this week has reinforced expectations that the ECB is nearing the end of its tightening cycle, reducing the likelihood of another rate hike this year despite President Christine Lagarde reiterating at the ECB Forum in Sintra that the Governing Council stands ready to take whatever steps are necessary to keep inflation under control and stressing that the region is not in stagflation. By contrast, Fed Chair Kevin Warsh maintained a cautious, inflation-focused stance, refusing to provide forward guidance while reaffirming the Fed’s commitment to restoring price stability, helping keep expectations alive for additional US tightening even after softer US ADP employment and ISM manufacturing data. At the same time, lingering geopolitical tensions in the Middle East continue to underpin safe-haven demand for the Dollar, leaving EURUSD vulnerable ahead of Thursday’s closely watched US nonfarm payrolls report, which is expected to play a key role in shaping the next leg of Fed rate expectations and, in turn, the direction of the single currency.

 
GBPUSD: technical overview

The Pound remains exceptionally well supported on dips into the 1.3000 area, with the price largely consolidating above the psychological barrier and previous resistance turned support in the form of the 2023 high. Look for the market to continue be well supported on dips ahead of the next major upside extension through the yearly high at 1.3870 and towards a retest of the 2018 high at 1.4377 further up. Only a monthly close below 1.3000 negates.

GBPUSD Chart
R2 1.3325 - 18 June high - Medium
R1 1.3293 - 1 July high - Medium
S1 1.3140 - 24 June/2026 low - Medium
S2 1.3100 - Figure - Medium
GBPUSD: fundamental overview

The British Pound remains relatively well supported as investors balance a still-resilient UK inflation outlook against a more cautious global backdrop. Sterling found support after softer-than-expected US labor market data weighed on the US Dollar, while Federal Reserve Chair Kevin Warsh maintained a hawkish tone by reiterating the Fed’s commitment to restoring price stability without offering forward guidance. Domestically, political concerns have eased after Andy Burnham reaffirmed his commitment to Chancellor Rachel Reeves’ fiscal rules following Keir Starmer’s resignation, helping reassure investors that fiscal discipline will remain intact. At the same time, Bank of England Governor Andrew Bailey has continued to strike a patient tone, arguing that tighter financial conditions give policymakers time to assess whether higher energy prices feed into broader inflation, even as he acknowledged inflation could rise toward 3.2% later this year. Markets continue to price in at least one BoE rate hike in 2026, reflecting persistent inflation concerns despite the recent decline in oil prices following easing tensions in the Middle East. Sterling has also benefited on the crosses, with EURGBP falling to its lowest level in roughly a year after softer Eurozone inflation reinforced expectations that the ECB may be closer to the end of its tightening cycle than the BoE.

 
USDJPY: technical overview

The major pair has extended its run to fresh multi-decade highs, with the latest push through 160.00 opening the door for further upside towards 165.00-170.00. At the same time, daily studies are looking quite stretched, suggesting we could see a healthy correction on the horizon. A break back below 161.51 would be required to take the immediate pressure off the topside and strengthen the case for a larger pullback. Until then, the market will continue to be focused on additional gains.

USDJPY Chart
R2 163.00 - Figure - Medium
R1 162.84 - Multi-Year high/1 July 2026 - Strong
S1 161.51 - 29 June low - Strong
S2 160.99 - 19 June low - Medium
USDJPY: fundamental overview

The Yen remains under pressure near four-decade lows as the wide interest rate differential between Japan and the United States continues to fuel carry trades, with markets still pricing a high probability of at least one additional Federal Reserve rate hike this year. While softer-than-expected US ADP employment data briefly weighed on the US Dollar, resilient US economic activity and expectations that Thursday’s Nonfarm Payrolls report could reinforce the Fed’s inflation-fighting stance have limited any sustained relief for the Yen. On the domestic side, Japan’s latest Tankan survey surprised to the upside, with business sentiment reaching its strongest level in eight years and inflation expectations remaining above the Bank of Japan’s 2% target, reinforcing expectations that the BoJ will continue gradually normalizing policy. However, investors remain unconvinced that the pace of BoJ tightening will be sufficient to materially narrow the US-Japan yield gap, leaving the Yen vulnerable. At the same time, speculation over possible intervention by Japan’s Ministry of Finance continues to intensify as USDJPY approaches the 163.00 area, although authorities have so far limited themselves to relatively measured warnings, encouraging traders to continue testing the market’s tolerance for further Yen weakness while remaining cautious of the risk of a sudden intervention-driven reversal, particularly during the thinner liquidity conditions around the US holiday.

 
AUDUSD: technical overview

There are signs of the formation of a longer-term base with the market recovering out from a meaningful longer-term support zone. The latest monthly close back above 0.7000 takes the big picture pressure off the downside and strengthens the case for a bottom, with the focus now on a push towards 0.8000. Setbacks should now be well supported ahead of 0.6700.

AUDUSD Chart
R2 0.7089 - 15 June high - Strong
R1 0.6979 - 11 June low - Medium
S1 0.6865 - 30 June low - Medium
S2 0.6833 - 30 March low - Strong
AUDUSD: fundamental overview

The Australian Dollar remains caught between a broadly resilient domestic backdrop and external headwinds that continue to favor the US Dollar. While the Reserve Bank of Australia maintains that policy needs to stay restrictive until inflation is firmly on track to return to target, markets have continued to scale back expectations for additional rate hikes this year as policymakers signal patience and a willingness to let existing policy work through the economy. Australia’s economic fundamentals remain relatively solid, with a healthy labor market, resilient domestic demand and a return to trade surpluses supported by resource exports, although growth has moderated and inflation is only easing gradually. At the same time, China—the Australian economy’s largest trading partner—is providing stability rather than a fresh growth impulse, with manufacturing activity holding up but domestic demand remaining subdued, limiting support for the Aussie. More recently, the currency has come under renewed pressure from a firmer US Dollar, resilient US economic data, elevated Treasury yields and a cautious risk backdrop amid lingering Middle East tensions, although softer US ADP employment data has tempered some of the Dollar’s strength ahead of Thursday’s closely watched US nonfarm payrolls report. Attention now turns to Australia’s latest trade balance figures, where another solid surplus driven by iron ore and coal exports could provide near-term support, but broader direction is still likely to hinge on US rate expectations, global risk sentiment and incoming Chinese data.

 
Suggested reading

Investors Are Still Fighting Last War On Inflation, Fisher Investments (June 30, 2026)

The Big Problem As Warsh Tries To Revive Greenspan Fed, R. Forsyth, Barron’s (June 26, 2026)


Any opinions, news, research, analyses, prices or other information ("information") contained on this Blog, constitutes marketing communication and it has not been prepared in accordance with legal requirements designed to promote the independence of investment research. Further, the information contained within this Blog does not contain (and should not be construed as containing) investment advice or an investment recommendation, or an offer of, or solicitation for, a transaction in any financial instrument. LMAX Group has not verified the accuracy or basis-in-fact of any claim or statement made by any third parties as comments for every Blog entry.

LMAX Group will not accept liability for any loss or damage, including without limitation to, any loss of profit, which may arise directly or indirectly from use of or reliance on such information. No representation or warranty is given as to the accuracy or completeness of the above information. While the produced information was obtained from sources deemed to be reliable, LMAX Group does not provide any guarantees about the reliability of such sources. Consequently any person acting on it does so entirely at his or her own risk. It is not a place to slander, use unacceptable language or to promote LMAX Group or any other FX and CFD provider and any such postings, excessive or unjust comments and attacks will not be allowed and will be removed from the site immediately.

Day Image
1st July 2026 | view in browser
Growth resilience leads into the new quarter

Strong US data and persistent Fed tightening expectations continue to underpin the dollar and Treasury yields, while record equity markets, AI optimism and a heavy economic calendar keep investors focused on growth and policy expectations.


Performance chart 30day v. USD (%)
Performance Chart
 
 
Technical & fundamental highlights
EURUSD: technical overview

The Euro outlook remains constructive with higher lows sought out on dips in favor of the next major upside extension targeting the 2021 high at 1.2350. Setbacks should be exceptionally well supported ahead of 1.1300.

EURUSD Chart
R2 1.1529 - 18 June high - Medium
R1 1.1440 - 23 June high - Medium
S1 1.1325 - 24 June/2026 low - Medium
S2 1.1300 - Figure - Medium
EURUSD: fundamental overview

The euro remains caught between a still-resilient US Dollar and an increasingly uncertain European Central Bank outlook, leaving EURUSD confined to the low-1.1400s. While month-end portfolio rebalancing and intermittent US Dollar softness have provided some support, the Greenback continues to draw strength from expectations that the Federal Reserve may still need to tighten policy further, reinforced by resilient US economic data and hawkish Fed rhetoric. At the same time, renewed geopolitical tensions in the Middle East have maintained safe-haven demand for the US Dollar. On the European side, ECB officials continue to send mixed signals, with policymakers such as Rehn emphasizing data dependence and downplaying broad second-round inflation risks, while Wunsch has kept the door open to another rate hike if price pressures persist. However, easing energy prices have tempered inflation concerns and reduced market conviction that the ECB will need to tighten much further, leaving traders focused on incoming US labor market data and any fresh guidance from the ECB Forum in Sintra for the next catalyst.

 
GBPUSD: technical overview

The Pound remains exceptionally well supported on dips into the 1.3000 area, with the price largely consolidating above the psychological barrier and previous resistance turned support in the form of the 2023 high. Look for the market to continue be well supported on dips ahead of the next major upside extension through the yearly high at 1.3870 and towards a retest of the 2018 high at 1.4377 further up. Only a monthly close below 1.3000 negates.

GBPUSD Chart
R2 1.3325 - 18 June high - Medium
R1 1.3277 - 30 June high - Medium
S1 1.3140 - 24 June/2026 low - Medium
S2 1.3100 - Figure - Medium
GBPUSD: fundamental overview

Sterling has traded with a mixed but broadly resilient tone, balancing domestic political and monetary policy developments against a firmer US Dollar. While renewed demand for the Greenback on the back of hawkish Federal Reserve expectations and higher US yields has limited GBPUSD upside, Sterling continues to draw support from the Bank of England’s relatively high policy rate, even as policymakers signal no urgency to tighten policy further. Speaking at the ECB Forum in Sintra, Governor Andrew Bailey reiterated that the BoE is in no rush to raise rates in response to higher energy prices, arguing that tighter market interest rates have already done some of the work and give policymakers time to assess whether higher oil prices generate broader inflation pressures. Although Bailey acknowledged inflation could climb toward 3.2% later this year, he maintained confidence that inflation will ultimately return to the 2% target, pushing back against calls from more hawkish policymakers for an immediate rate hike and reinforcing a patient, data-dependent policy approach. Meanwhile, UK first-quarter GDP expanded 0.6% on the quarter but annual growth slowed more than expected, underscoring a moderating economy despite continued resilience in the services sector. On the political front, markets have welcomed Labour leadership frontrunner Andy Burnham’s commitment to maintaining fiscal discipline, helping ease concerns following Keir Starmer’s resignation announcement and limiting political risk premia. Looking ahead, Sterling remains sensitive to incoming UK inflation and labor market data, while this week’s US employment report is likely to be the key driver of Federal Reserve expectations and broader direction for GBPUSD.

 
USDJPY: technical overview

The major pair has extended its run to fresh multi-decade highs, with the latest push through 160.00 opening the door for further upside towards 165.00-170.00. At the same time, daily studies are looking quite stretched, suggesting we could see a healthy correction on the horizon. A break back below 161.51 would be required to take the immediate pressure off the topside and strengthen the case for a larger pullback. Until then, the market will continue to be focused on additional gains.

USDJPY Chart
R2 163.00 - Figure - Medium
R1 162.67 - Multi-Year high/30 June 2026 - Strong
S1 161.51 - 29 June low - Strong
S2 160.99 - 19 June low - Medium
USDJPY: fundamental overview

The Yen remains under heavy pressure as the wide interest rate differential between Japan and the United States continues to drive demand for USDJPY, even after the Bank of Japan raised rates to 1.0% in June. Markets still see Japanese policy as highly accommodative relative to the Federal Reserve, with expectations for another Fed rate hike this year reinforcing the appeal of carry trades and keeping the Dollar well supported. The pair has climbed to fresh multi-decade highs above 162, shifting investor focus to the growing risk of official Japanese intervention, with policymakers repeatedly warning they stand ready to act against excessive currency moves. However, traders remain cautious about betting on sustained Yen strength, as any intervention is widely viewed as likely to slow rather than reverse the broader trend unless accompanied by a narrowing in the US-Japan yield gap. Attention now turns to upcoming US labor market data and further Fed commentary, which could determine whether USDJPY extends toward the 163.00 level or triggers intervention from Tokyo.

 
AUDUSD: technical overview

There are signs of the formation of a longer-term base with the market recovering out from a meaningful longer-term support zone. The latest monthly close back above 0.7000 takes the big picture pressure off the downside and strengthens the case for a bottom, with the focus now on a push towards 0.8000. Setbacks should now be well supported ahead of 0.6700.

AUDUSD Chart
R2 0.7089 - 15 June high - Strong
R1 0.6979 - 11 June low - Medium
S1 0.6865 - 30 June low - Medium
S2 0.6833 - 30 March low - Strong
AUDUSD: fundamental overview

The Australian Dollar has found renewed support after rebounding from recent lows, underpinned by a hawkish set of RBA meeting minutes that reinforced policymakers’ willingness to tighten policy further if inflation proves more persistent. While the central bank kept rates unchanged at 4.35%, officials stressed that inflation remains well above target, excess demand and cost pressures persist, and policy will need to stay restrictive until price stability is restored. The Aussie has also benefited from encouraging Chinese data, with both manufacturing and services PMIs returning to or remaining in expansion territory, improving the outlook for Australia’s largest export market and supporting commodity demand. Domestically, resilient employment, sticky underlying inflation and solid business activity continue to reinforce expectations that the RBA will remain one of the more hawkish G10 central banks. Against this, gains have been tempered by a still-resilient US economy and a Federal Reserve that continues to signal a cautious approach to easing, leaving AUDUSD largely driven by the balance between relative central bank expectations, global risk sentiment and incoming US data.

 
Suggested reading

Can Kazakhstan’s oil boom survive Putin’s War?, A. Stognei, Financial Times (June 30, 2026)

2026’s Best Performing S&P 500 Stocks, B. Nguyen, Marketwatch (June 30, 2026)


Any opinions, news, research, analyses, prices or other information ("information") contained on this Blog, constitutes marketing communication and it has not been prepared in accordance with legal requirements designed to promote the independence of investment research. Further, the information contained within this Blog does not contain (and should not be construed as containing) investment advice or an investment recommendation, or an offer of, or solicitation for, a transaction in any financial instrument. LMAX Group has not verified the accuracy or basis-in-fact of any claim or statement made by any third parties as comments for every Blog entry.

LMAX Group will not accept liability for any loss or damage, including without limitation to, any loss of profit, which may arise directly or indirectly from use of or reliance on such information. No representation or warranty is given as to the accuracy or completeness of the above information. While the produced information was obtained from sources deemed to be reliable, LMAX Group does not provide any guarantees about the reliability of such sources. Consequently any person acting on it does so entirely at his or her own risk. It is not a place to slander, use unacceptable language or to promote LMAX Group or any other FX and CFD provider and any such postings, excessive or unjust comments and attacks will not be allowed and will be removed from the site immediately.