Day Image
6th May 2025 | view in browser
Dollar steady, US equity futures under pressure

The U.S. dollar remains largely unchanged, while U.S. stock futures, led by a 0.5% decline in the NASDAQ, trade modestly lower, as markets digest mixed global signals.


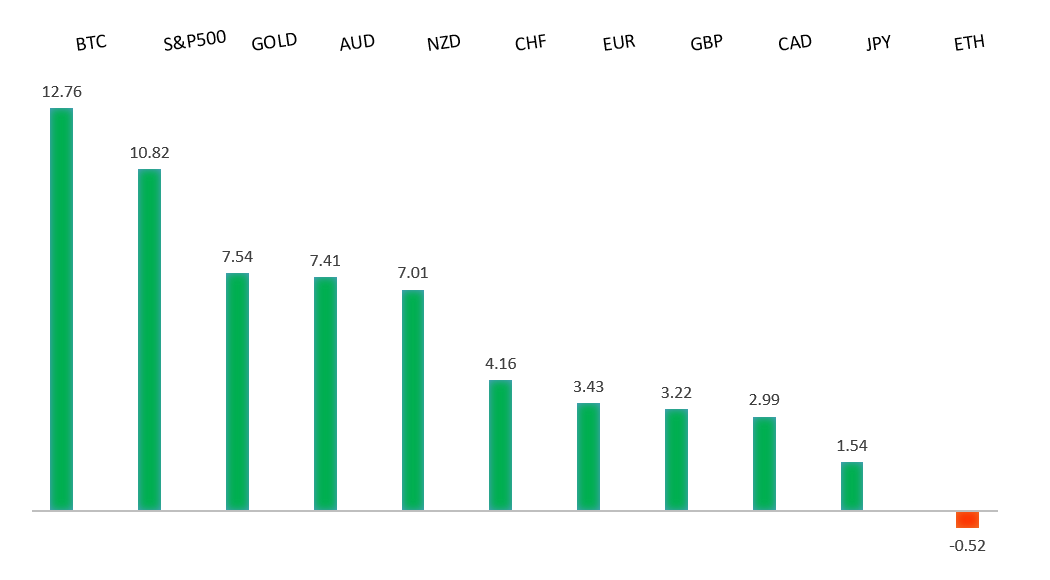
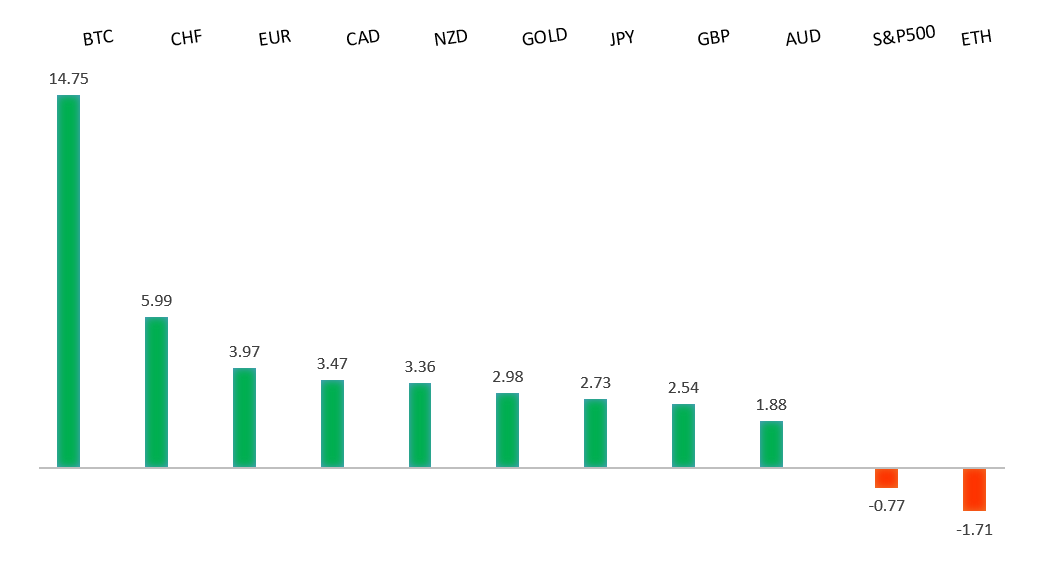
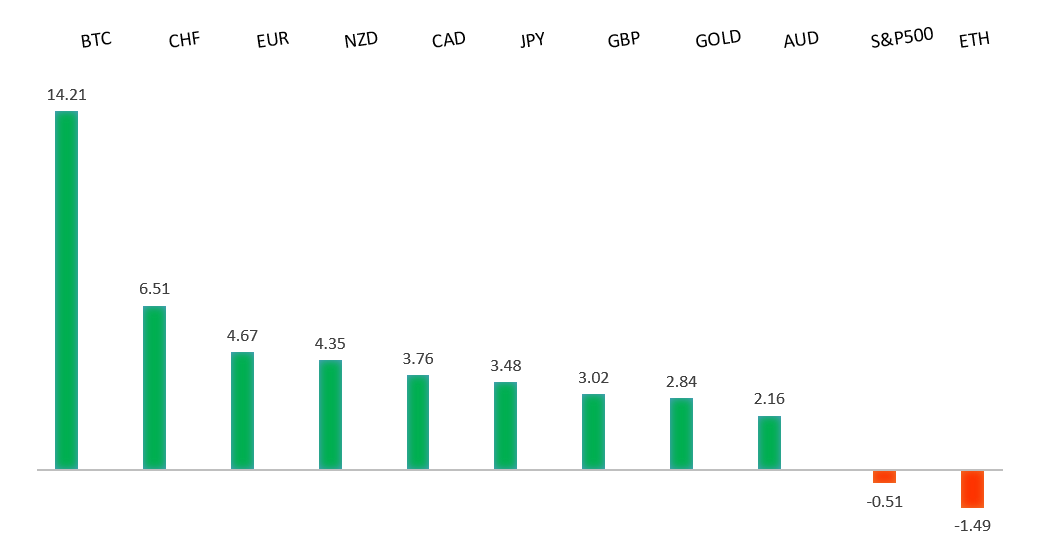
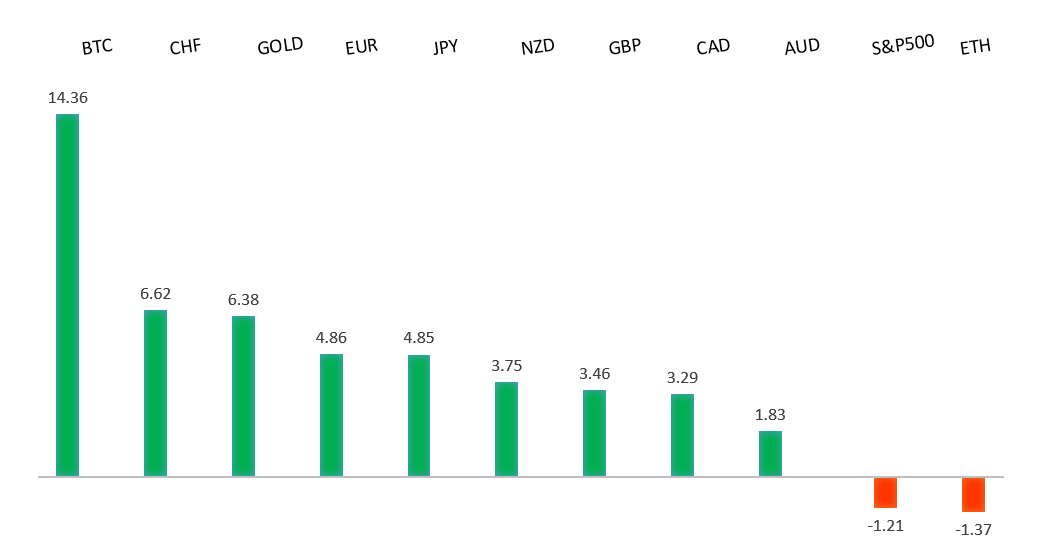
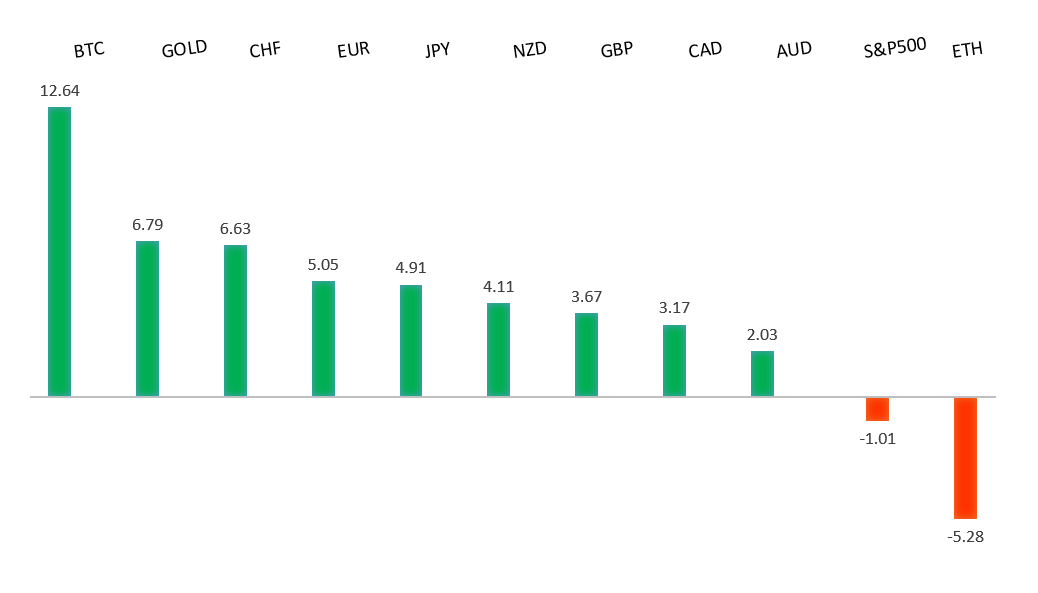
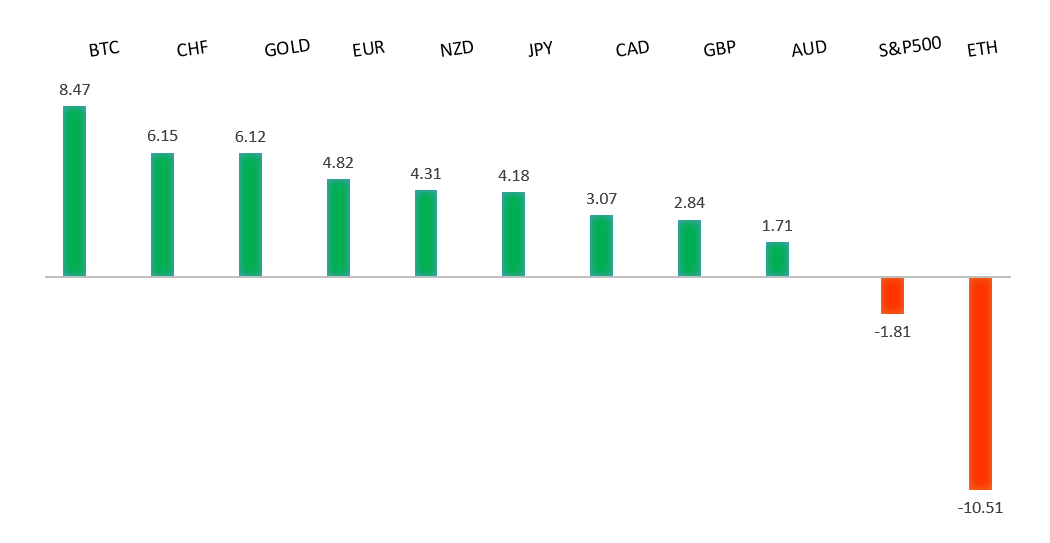
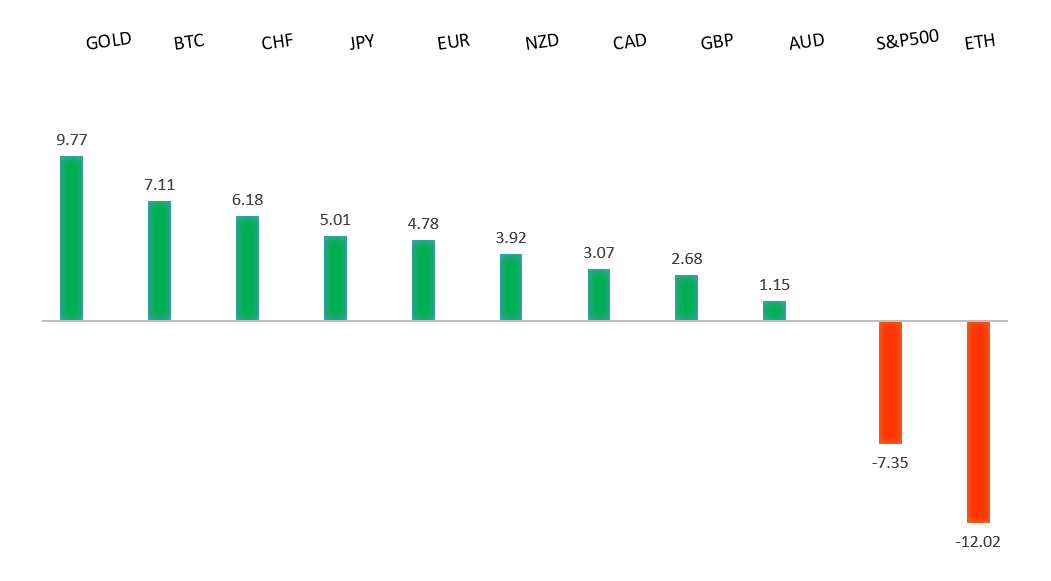
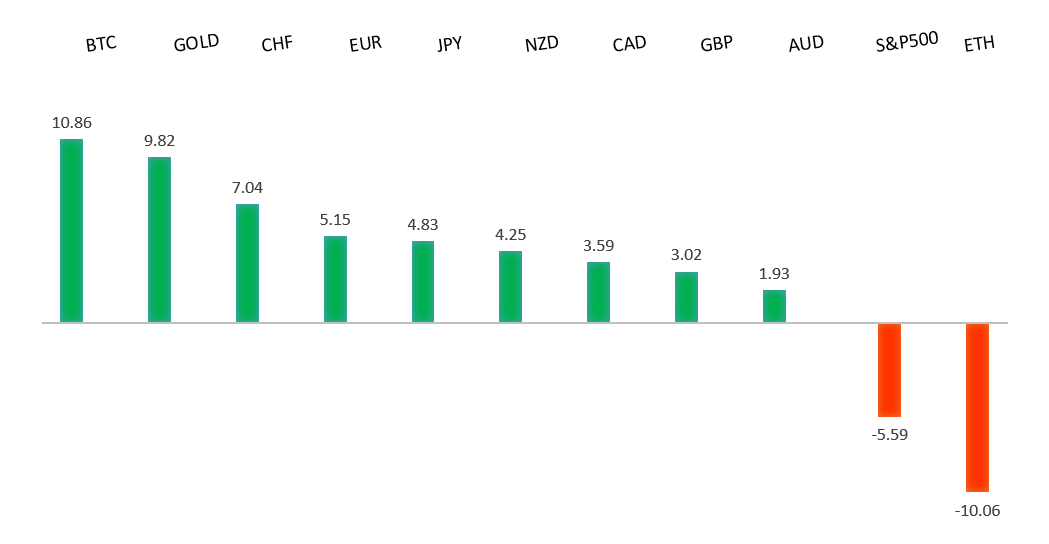
Performance chart 30day v. USD (%)
Performance Chart
 
 
Technical & fundamental highlights
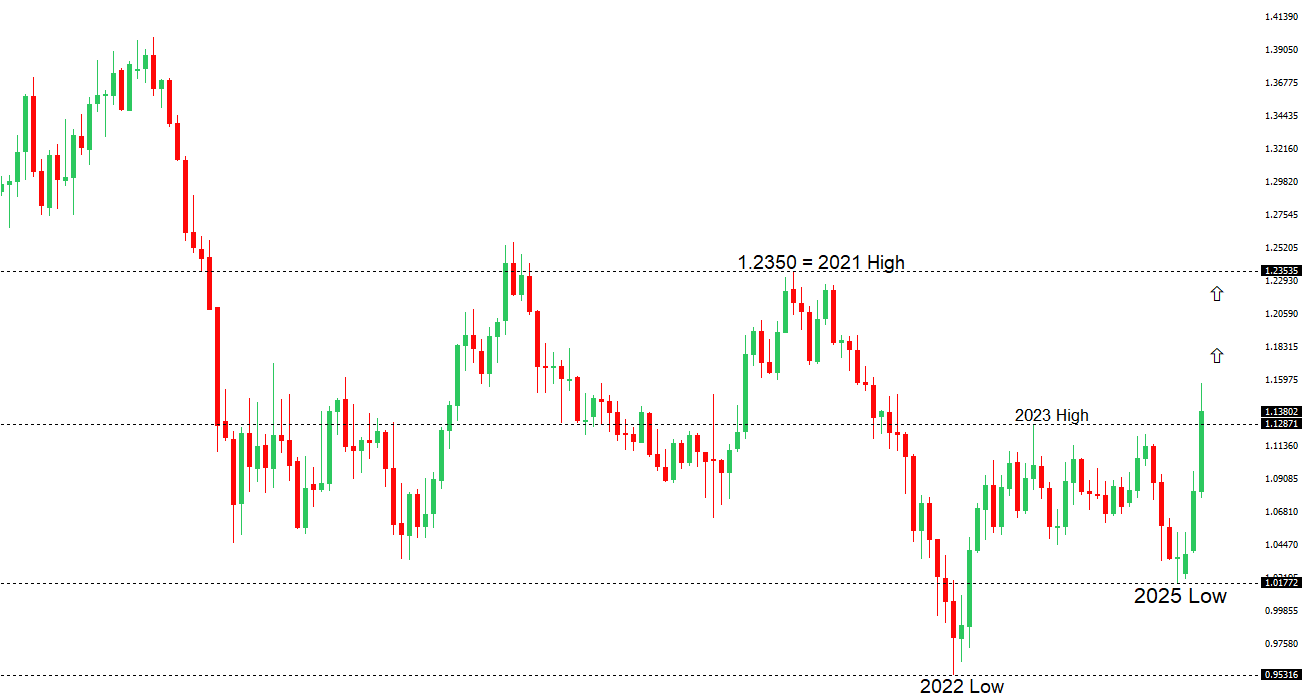
EURUSD: technical overview

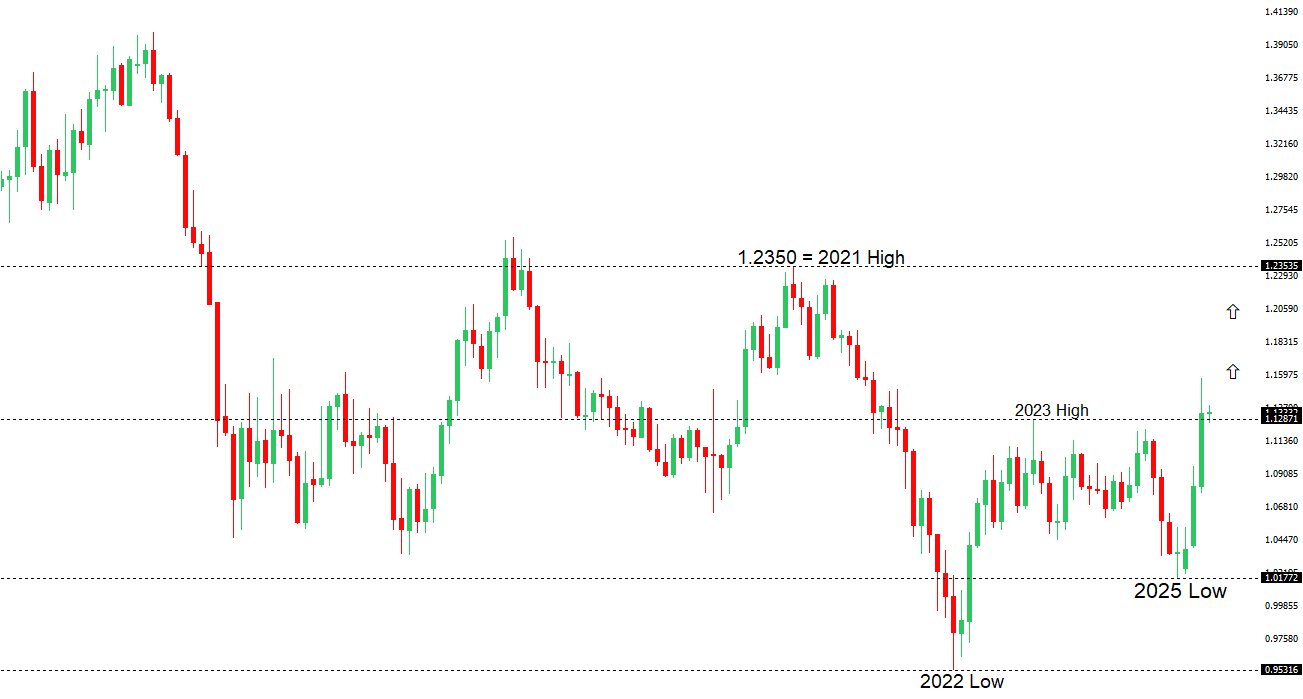
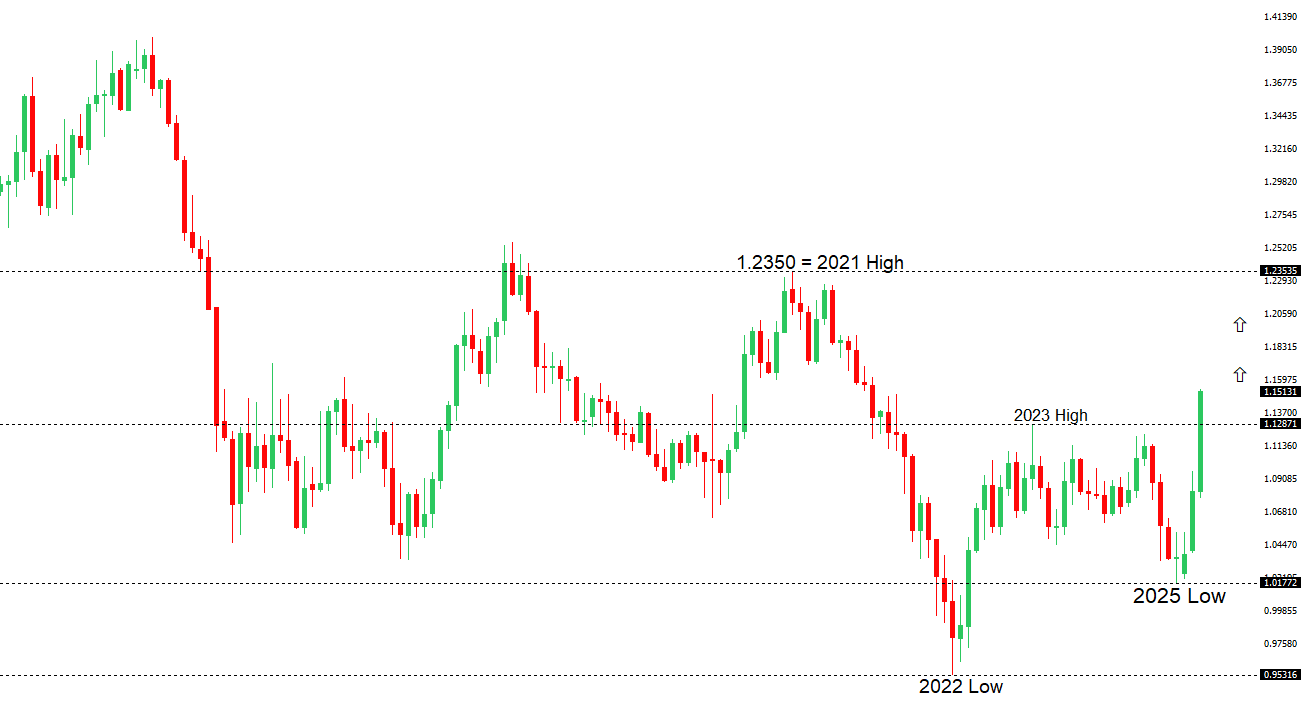
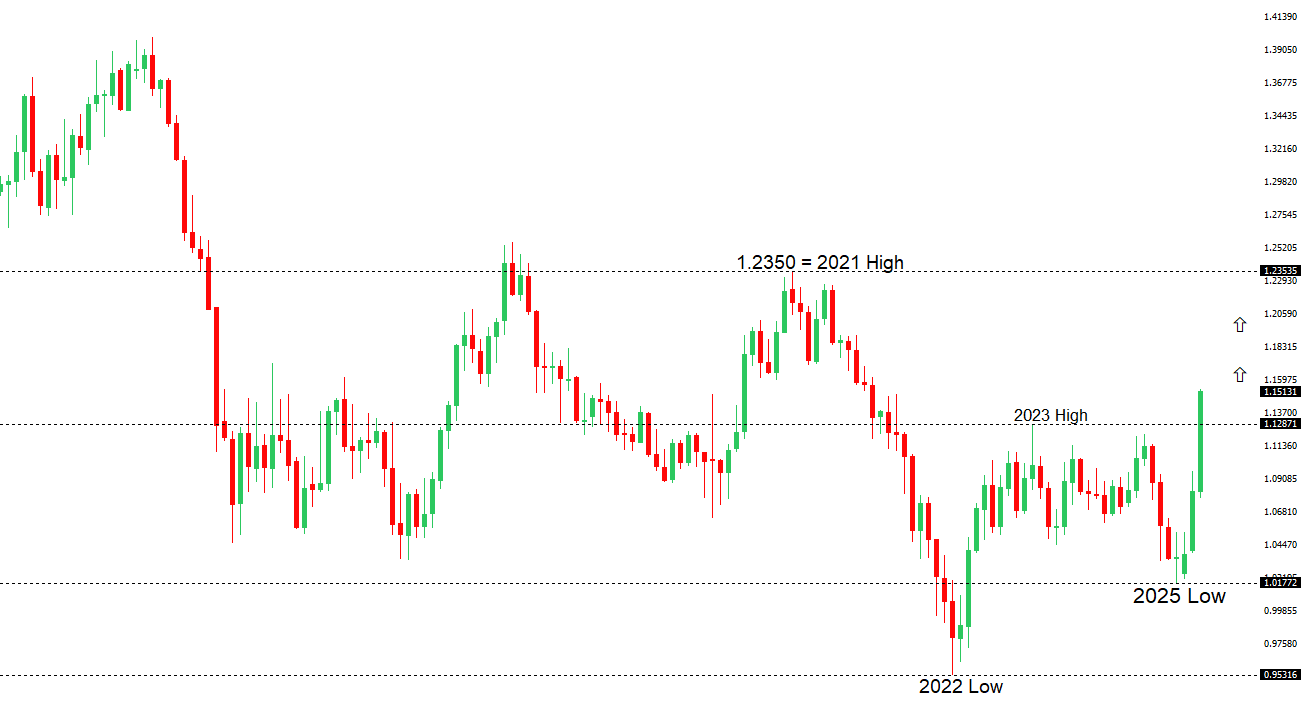
The Euro has finally broken out from a multi-month consolidation off a critical longer-term low. This latest push through the 2023 high lends further support to the case for a meaningful bottom, setting the stage for a bullish structural shift and the next major upside extension targeting the 2021 high at 1.2350. Setbacks should be exceptionally well supported below 1.1000.

EURUSD Chart
R1 1.1574 - 21 April/2025 high - Strong
R1 1.1426 - 28 April high - Medium
S1 1.1266 - 1 May low - Medium
S2 1.1148 - 3 April high - Strong
EURUSD: fundamental overview

The European Central Bank, as echoed by Governing Council member Stournaras and President Lagarde, is poised to continue its data-dependent rate cuts amid persistent uncertainty. At the same time, the Euro should still be supported on a more dovish Fed track, driven by expected Federal Reserve rate reductions and economic strain from U.S. tariff policies. KKR & Co.’s Henry Kravis has expressed confidence in European leadership, particularly praising German Chancellor Friedrich Merz, French President Emmanuel Macron, and Italian PM Giorgia Meloni, signaling Europe as an attractive investment destination. Eurozone investor sentiment has improved significantly, with the May Sentix Investor Confidence Index rising to -8.1, bolstered by the European Commission’s steady response to U.S. trade actions and expectations of continued ECB rate cuts. Upcoming March PPI data, projected to decline to -1.40% month-on-month, reflects easing energy costs and normalizing supply chains, though sticky core inflation at 2.7% year-on-year underscores persistent service-driven price pressures.

 
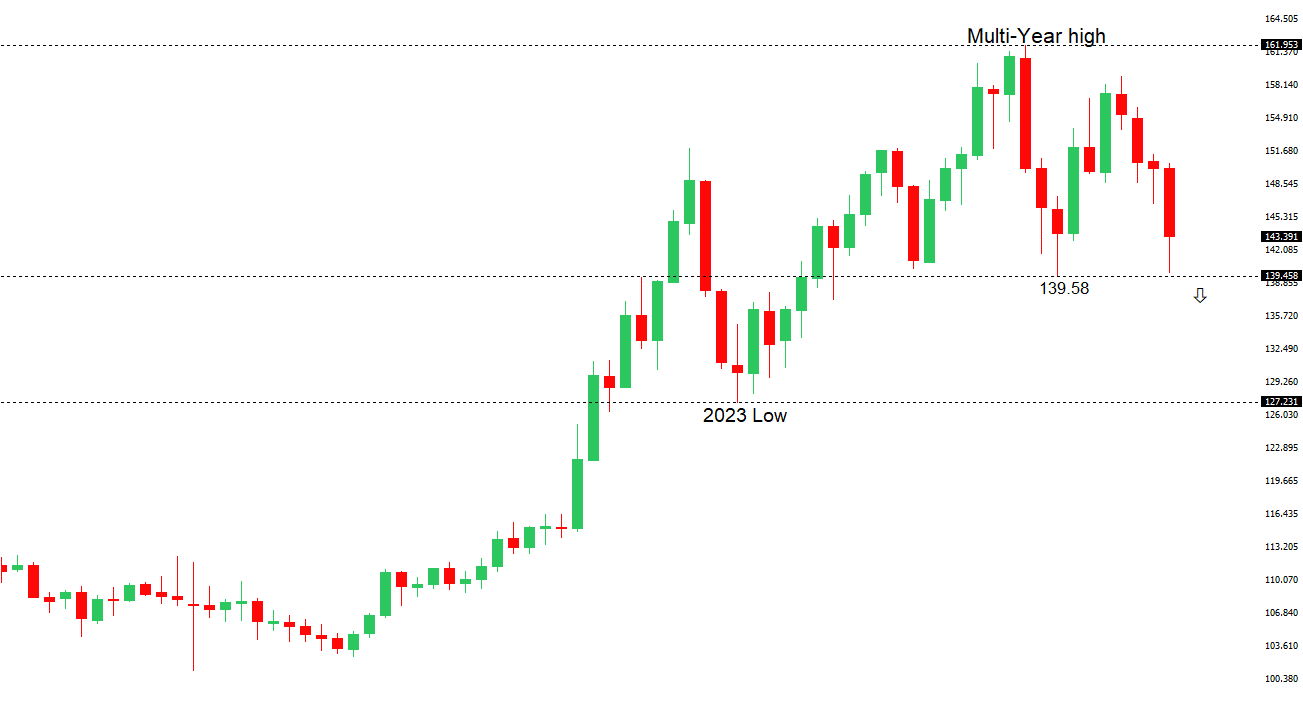
USDJPY: technical overview

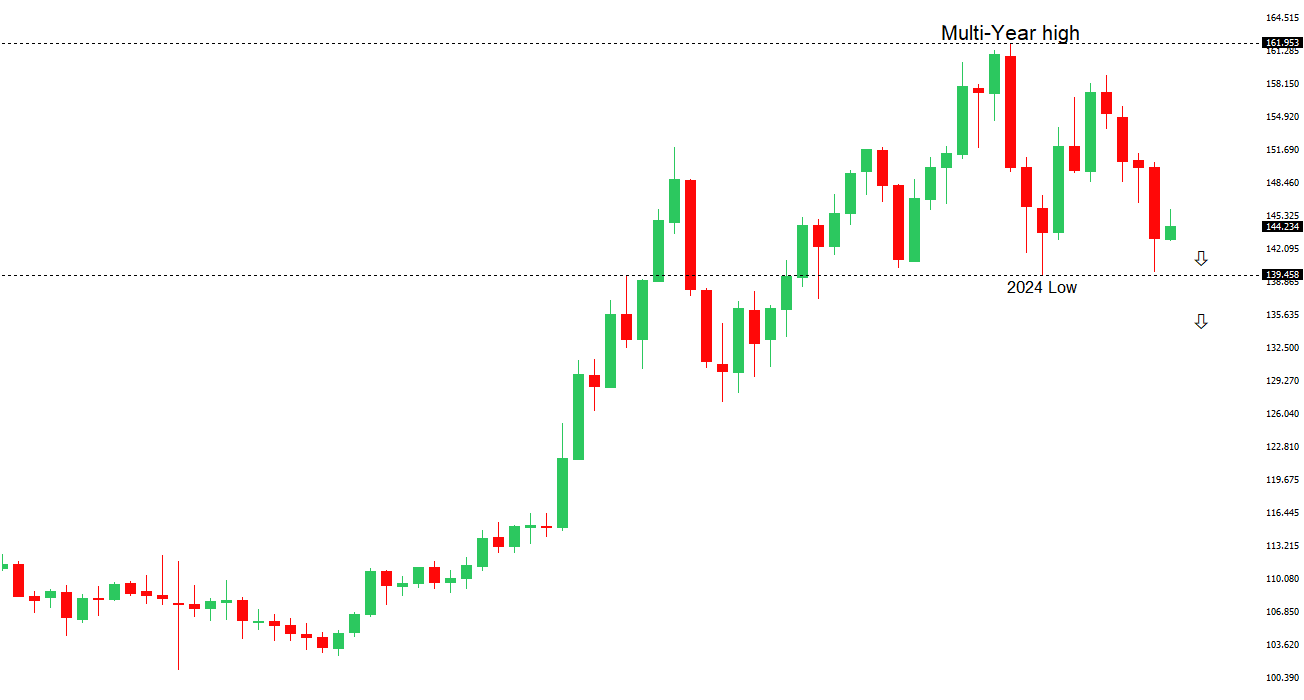
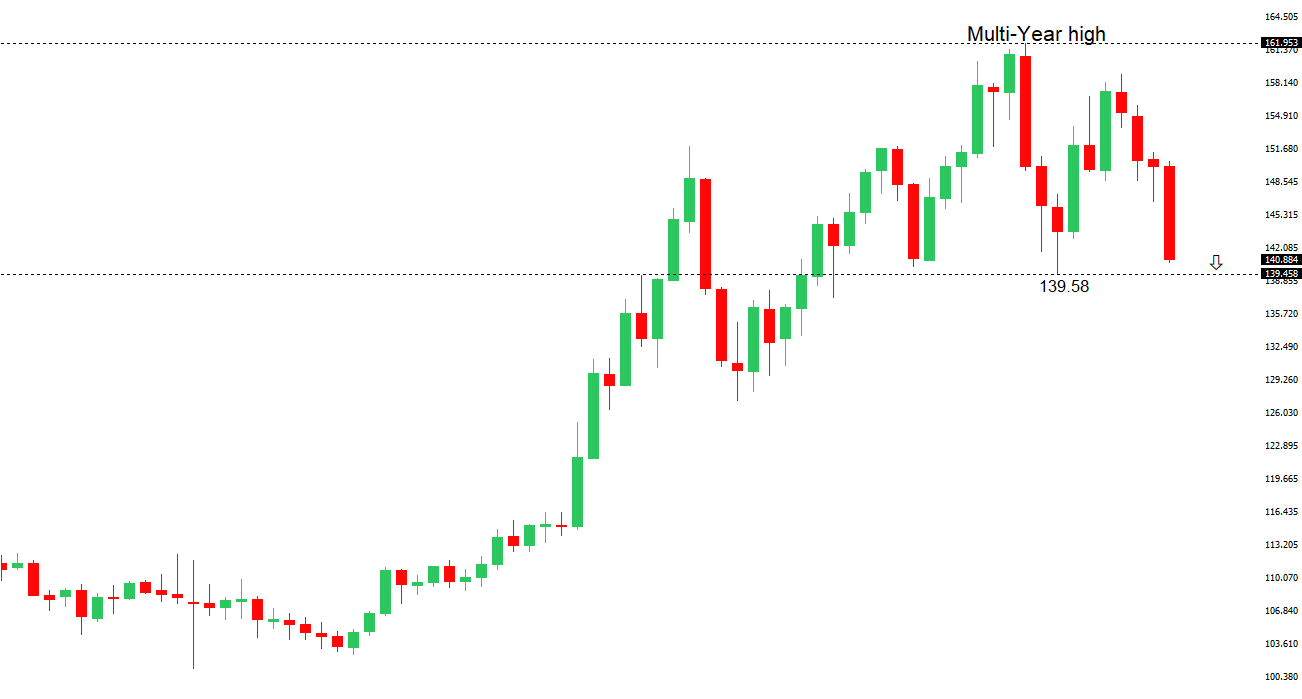
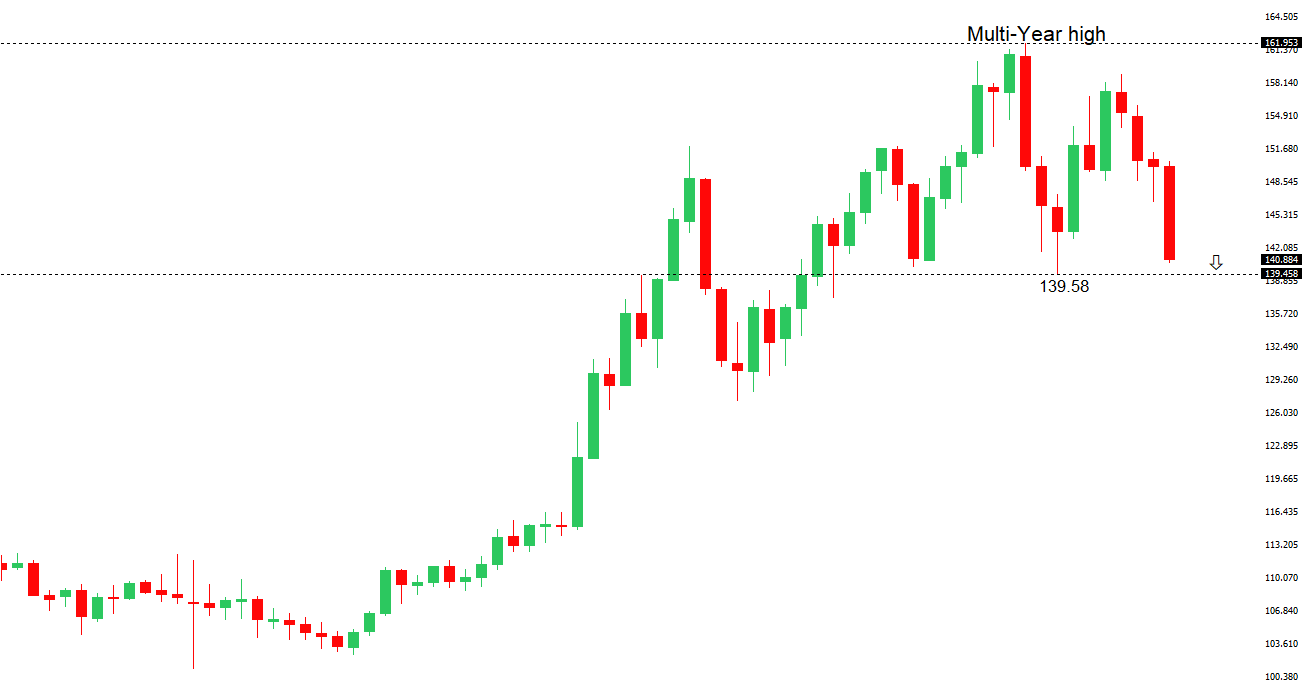
There are signs of a meaningful top in place after the market put in a multi-year high in 2024. At this point, the door is now open for a deeper setback below the 2024 low at 139.58 over the coming sessions exposing a retest of the 2023 low. Rallies should be well capped below 150.00.

USDJPY Chart
R2 148.28 - 9 April high - Strong
R1 145.93 - 2 May high - Medium
S1 143.73 - 2 May low - Medium
S1 141.97 - 29 April low - Medium
USDJPY: fundamental overview
The Bank of Japan’s decision to delay its 2% inflation target and cut growth forecasts to 0.5% amid global trade uncertainties has diminished expectations for near-term rate hikes, with USDJPY facing resistance in recent sessions as markets await Federal Reserve guidance from the May 7 FOMC meeting, where 78 basis points of rate cuts are priced in for 2025. Despite stalled U.S.-Japan trade talks, with the U.S. rejecting Japan’s full tariff exemption but open to reducing the 14% Japan-specific tariff, Chief Negotiator Ryosei Akazawa remains optimistic about a June agreement, potentially paving the way for the BOJ to resume rate hikes, with Bloomberg Economics projecting a target rate of 1.25% by next year. The strengthening of Asian currencies, particularly the undervalued Chinese yuan, could support further yen appreciation, while upcoming BOJ March meeting minutes and Thursday’s household spending data will provide additional insights, though Japanese markets are closed again today for holidays.
 
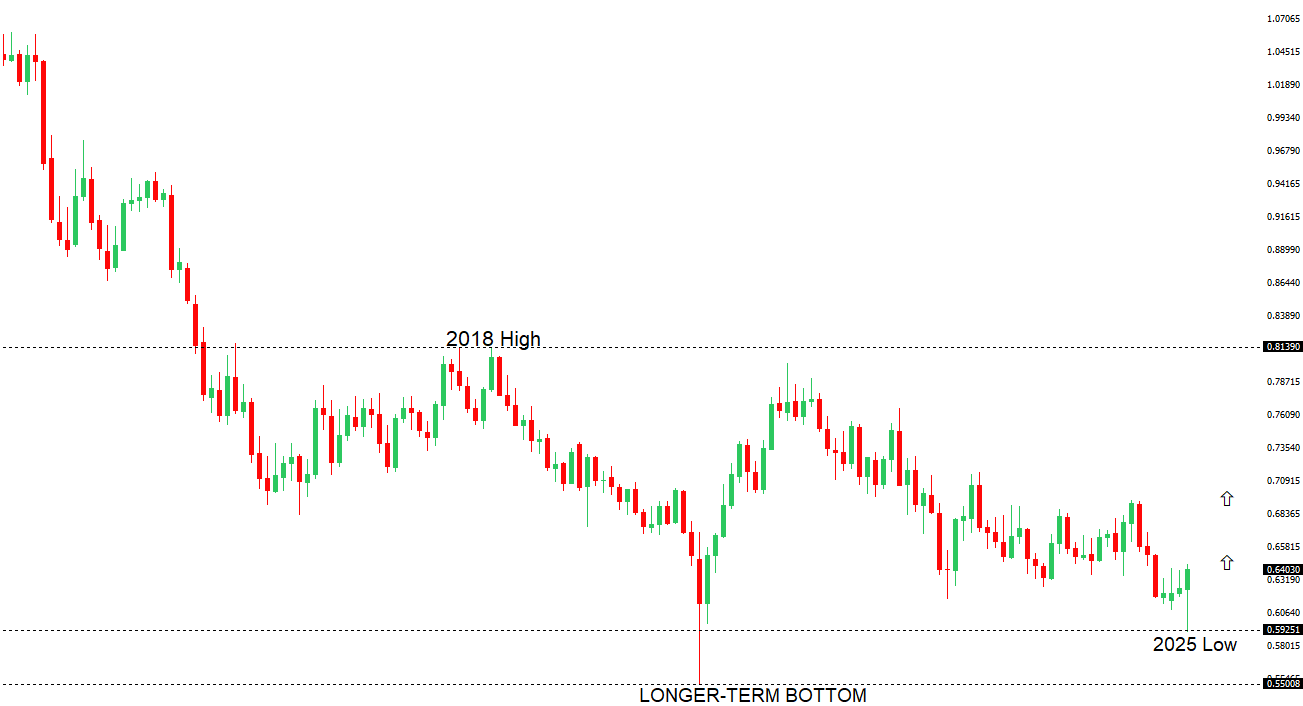
AUDUSD: technical overview

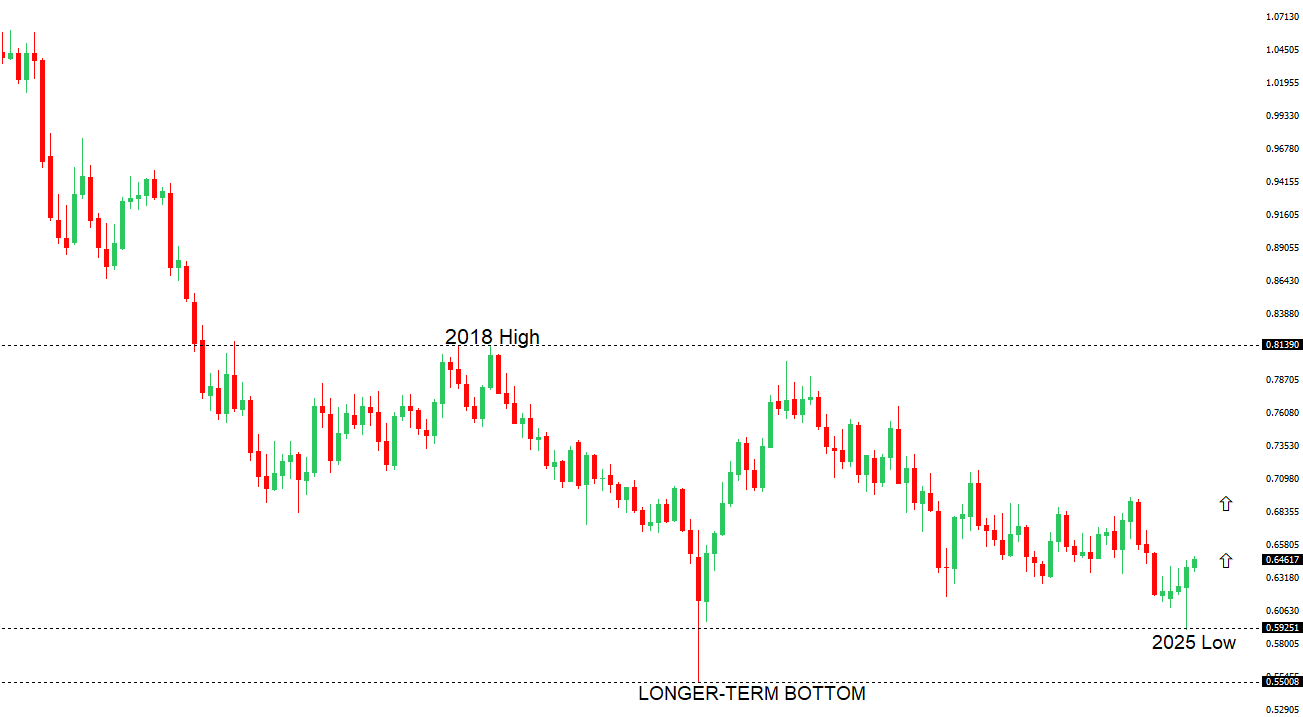
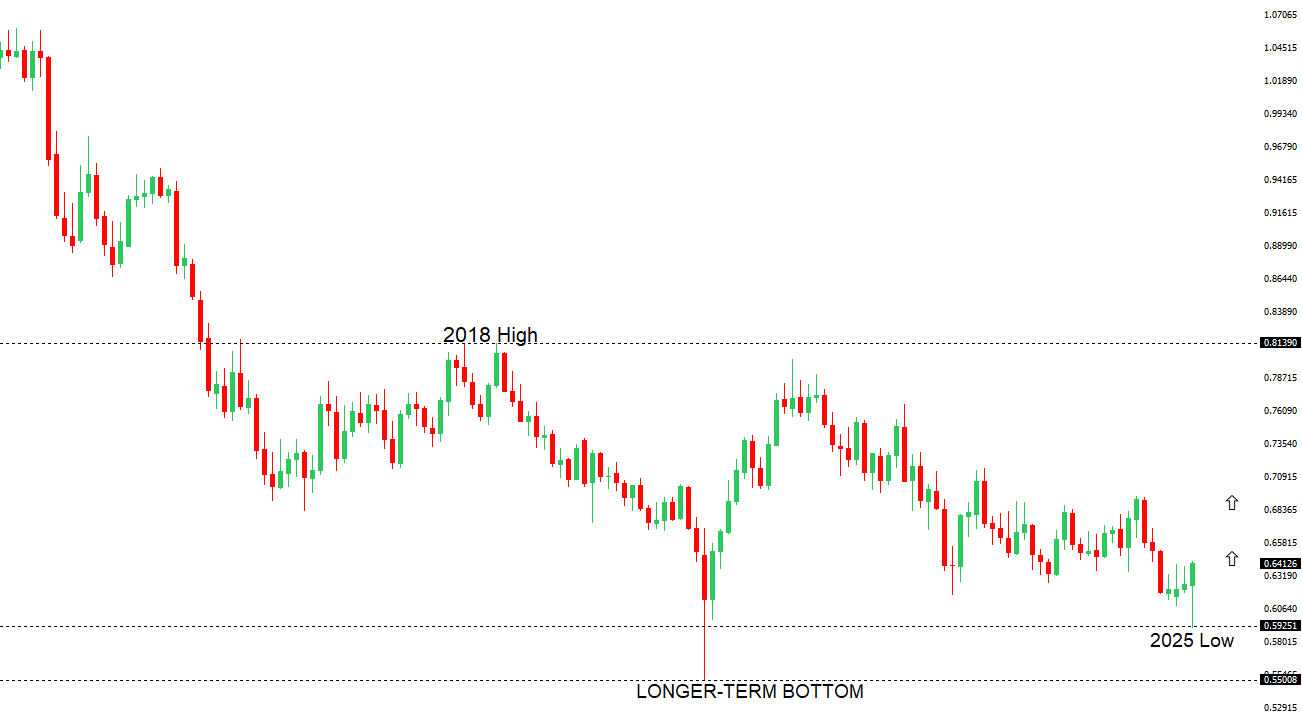
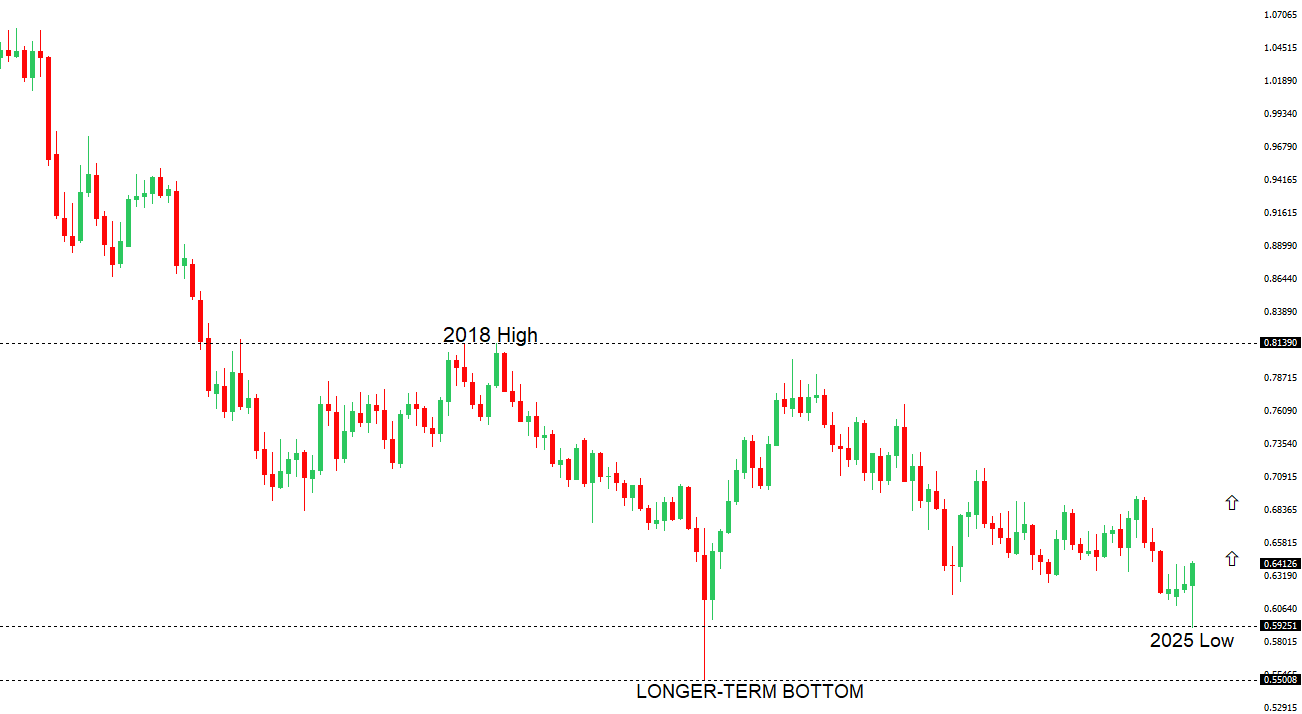
There are signs of the potential formation of a longer-term base with the market trading down into a meaningful longer-term support zone. Only a monthly close below 0.5500 would give reason for rethink. A monthly close back above 0.7000 will take the big picture pressure off the downside and strengthen case for a bottom.

AUDUSD Chart
R2 0.6500 - Psychological - Strong
R1 0.6482 - 5 May/2025 high - Medium
S1 0.6344 - 24 April low - Medium
S1 0.6275 - 14 April low - Strong
AUDUSD: fundamental overview

Prime Minister Albanese’s resounding election victory has strengthened Australia’s political stability, providing a temporary lift to the Australian dollar, while markets await progress in U.S.-China trade talks, with the strengthening Chinese yuan—now below its 200-day moving average—potentially bolstering Aussie as a regional proxy. The Federal Reserve’s upcoming May 7 FOMC meeting, expected to maintain current rates despite tariff-related economic pressures, will be scrutinized for signs of a shift toward rate cuts, with markets anticipating 78 basis points of reductions in 2025. In Australia, persistent inflationary pressures, evidenced by April’s Melbourne Institute Inflation at 3.3% year-on-year and rising consumer inflation expectations to 4.2%, alongside disappointing March household spending, suggest that the Reserve Bank of Australia’s projected 104 basis points of rate cuts for 2025 may be overly optimistic, as weak consumption signals caution for economic growth.

 
Suggested reading

Wall Street’s $5 Trillion Robot Bet, J. Remsburg, Investor Place (May 2, 2025)

Is Software Holding the U.S. Hostage?, I. King, Banyan Hill (May 5, 2025)


Any opinions, news, research, analyses, prices or other information ("information") contained on this Blog, constitutes marketing communication and it has not been prepared in accordance with legal requirements designed to promote the independence of investment research. Further, the information contained within this Blog does not contain (and should not be construed as containing) investment advice or an investment recommendation, or an offer of, or solicitation for, a transaction in any financial instrument. LMAX Group has not verified the accuracy or basis-in-fact of any claim or statement made by any third parties as comments for every Blog entry.

LMAX Group will not accept liability for any loss or damage, including without limitation to, any loss of profit, which may arise directly or indirectly from use of or reliance on such information. No representation or warranty is given as to the accuracy or completeness of the above information. While the produced information was obtained from sources deemed to be reliable, LMAX Group does not provide any guarantees about the reliability of such sources. Consequently any person acting on it does so entirely at his or her own risk. It is not a place to slander, use unacceptable language or to promote LMAX Group or any other FX and CFD provider and any such postings, excessive or unjust comments and attacks will not be allowed and will be removed from the site immediately.

Day Image
5th May 2025 | view in browser
US tariffs and strong jobs data delay fed rate cuts

Over the weekend, Australian Prime Minister Albanese’s decisive election win bolstered political stability, potentially lifting the Australian Dollar to its fresh 2025 high. But overall, in Asia, markets were quiet due to Japan’s two-day holiday.


Performance chart 30day v. USD (%)
Performance Chart
 
 
Technical & fundamental highlights
EURUSD: technical overview

Eurozone’s April flash CPI data showed inflation holding steady at 2.2% year-on-year, above the expected 2.1%, with core inflation rising to 2.7% due to higher airfares and holiday costs from Easter, though lower energy prices tempered the headline figure. Despite trade war pressures and a stronger euro, potential Chinese exports to the Eurozone may ease goods prices, supporting expectations for ECB rate cuts starting in June, possibly lowering deposit rates to 1.5%-1.75%. ECB officials stress a cautious, data-driven approach to policy decisions. Eurozone pension funds, with $770 billion in unhedged dollar exposure, are shifting to euro-based assets, limiting the EURUSD correction. Today’s May Sentix Investor Confidence index, following April’s sharp drop to -19.5, will be watched for signs of stabilization, while Germany’s upcoming factory orders and industrial production data will shed light on the manufacturing sector’s health amid U.S. tariffs. Banks like JPMorgan, Citigroup, and BNP Paribas now forecast EURUSD reaching $1.20 this year.

EURUSD Chart
R1 1.1574 - 21 April/2025 high - Strong
R1 1.1426 - 28 April high - Medium
S1 1.1266 - 1 May low - Medium
S2 1.1148 - 3 April high - Strong
EURUSD: fundamental overview

The Eurozone’s April CPI data, due today, is expected to show a slight decline in overall inflation to 2.1% from 2.2%, driven by lower energy and service costs, while core inflation may rise slightly to 2.5% due to higher holiday-related expenses. Despite weak economic growth prompting the ECB to lower its 2025 GDP forecast to 0.9%, markets anticipate interest rate cuts starting in June, potentially lowering ECB deposit rates to 1.5%-1.75%. ECB officials emphasize a cautious, data-driven approach to policy decisions. Meanwhile, Eurozone pension funds with $770 billion in unhedged dollar exposure are shifting toward euro-based assets to hedge currency risks, and European consumers are increasingly favoring local products over U.S. alternatives due to trade tensions, signaling a potential long-term shift.

 
USDJPY: technical overview

There are signs of a meaningful top in place after the market put in a multi-year high in 2024. At this point, the door is now open for a deeper setback below the 2024 low at 139.58 over the coming sessions exposing a retest of the 2023 low. Rallies should be well capped below 150.00.

USDJPY Chart
R2 148.28 - 9 April high - Strong
R1 145.93 - 2 May high - Medium
S1 143.73 - 2 May low - Medium
S1 141.97 - 29 April low - Medium
USDJPY: fundamental overview

Despite a strong U.S. April Non-Farm Payrolls report, USDJPY bulls struggled to gain momentum, as weak U.S. GDP (-0.3% in Q1) and contractionary ISM Manufacturing data (48.7) signal caution, with markets still expecting three Fed rate cuts this year but no change at the May 6-7 meeting. The Bank of Japan delayed its 2% inflation target and cut growth forecasts to 0.5% due to trade uncertainties, pushing back rate hike expectations, though Governor Ueda stressed hikes could resume if tariff issues clear, with Bloomberg predicting a July increase to a 1.25% target rate next year. Japan, leveraging its U.S. treasury holdings, is progressing in trade talks with the U.S., aiming for a June deal, which could shift focus back to BOJ rate hikes if auto and metal tariffs are resolved. Japan’s Finance Minister Kato downplayed using treasury holdings as leverage, but U.S. creditors hold significant negotiating power. This week, BOJ’s March meeting minutes and Japan’s March Household Spending data, both due Thursday, will be closely watched, with Japanese markets closed Monday and Tuesday for holidays.

 
AUDUSD: technical overview

There are signs of the potential formation of a longer-term base with the market trading down into a meaningful longer-term support zone. Only a monthly close below 0.5500 would give reason for rethink. A monthly close back above 0.7000 will take the big picture pressure off the downside and strengthen case for a bottom.

AUDUSD Chart
R2 0.6500 - Psychological - Strong
R1 0.6482 - 5 May/2025 high - Medium
S1 0.6344 - 24 April low - Medium
S1 0.6275 - 14 April low - Strong
AUDUSD: fundamental overview

Australian Prime Minister Albanese’s landslide election victory strengthens political stability, potentially boosting the Australian Dollar, while rising 10-year bond yields signal persistent budget deficits. Signs of easing U.S.-China trade tensions, with China considering tariff talks after U.S. outreach, could further support Aussie, given Australia’s trade ties with both nations. Strong U.S. April jobs data may be the last positive report for a while, as tariff impacts loom, potentially pushing the Fed toward rate cuts (80 basis points expected by year-end) to support employment despite above-target inflation. In Australia, March inflation (3.3% YoY, above the RBA’s 2-3% target) and rising consumer inflation expectations (4.2%) suggest persistent price pressures, casting doubt on market expectations of 103 basis points of RBA rate cuts in 2025, likely leading to a more cautious easing approach.

 
Suggested reading

Six Ways the Federal Reserve Can Do a Better Job, C. Smith, Of Two Minds (May 2, 2025)

The Real Global Contest Is Over Capital, J. Zito, Apollo (April 30, 2025)


Any opinions, news, research, analyses, prices or other information ("information") contained on this Blog, constitutes marketing communication and it has not been prepared in accordance with legal requirements designed to promote the independence of investment research. Further, the information contained within this Blog does not contain (and should not be construed as containing) investment advice or an investment recommendation, or an offer of, or solicitation for, a transaction in any financial instrument. LMAX Group has not verified the accuracy or basis-in-fact of any claim or statement made by any third parties as comments for every Blog entry.

LMAX Group will not accept liability for any loss or damage, including without limitation to, any loss of profit, which may arise directly or indirectly from use of or reliance on such information. No representation or warranty is given as to the accuracy or completeness of the above information. While the produced information was obtained from sources deemed to be reliable, LMAX Group does not provide any guarantees about the reliability of such sources. Consequently any person acting on it does so entirely at his or her own risk. It is not a place to slander, use unacceptable language or to promote LMAX Group or any other FX and CFD provider and any such postings, excessive or unjust comments and attacks will not be allowed and will be removed from the site immediately.

Day Image
2nd May 2025 | view in browser
Trade talks and tariffs: markets brace for shift

The “Sell America” and peak AI investment themes, once overhyped, are now correcting, with markets entering a consolidation phase as the Trump administration softens its stance on tariffs and seeks trade deals, particularly with China, which insists on tariff removal before talks.


Performance chart 30day v. USD (%)
Performance Chart
 
 
Technical & fundamental highlights
EURUSD: technical overview

The Euro has finally broken out from a multi-month consolidation off a critical longer-term low. This latest push through the 2023 high lends further support to the case for a meaningful bottom, setting the stage for a bullish structural shift and the next major upside extension targeting the 2021 high at 1.2350. Setbacks should be exceptionally well supported below 1.1000.

EURUSD Chart
R1 1.1574 - 21 April/2025 high - Strong
R1 1.1426 - 28 April high - Medium
S1 1.1266 - 1 May low - Medium
S2 1.1148 - 3 April high - Strong
EURUSD: fundamental overview

The Eurozone’s April CPI data, due today, is expected to show a slight decline in overall inflation to 2.1% from 2.2%, driven by lower energy and service costs, while core inflation may rise slightly to 2.5% due to higher holiday-related expenses. Despite weak economic growth prompting the ECB to lower its 2025 GDP forecast to 0.9%, markets anticipate interest rate cuts starting in June, potentially lowering ECB deposit rates to 1.5%-1.75%. ECB officials emphasize a cautious, data-driven approach to policy decisions. Meanwhile, Eurozone pension funds with $770 billion in unhedged dollar exposure are shifting toward euro-based assets to hedge currency risks, and European consumers are increasingly favoring local products over U.S. alternatives due to trade tensions, signaling a potential long-term shift.

 
USDJPY: technical overview

There are signs of a meaningful top in place after the market put in a multi-year high in 2024. At this point, the door is now open for a deeper setback below the 2024 low at 139.58 over the coming sessions exposing a retest of the 2023 low. Rallies should be well capped below 150.00.

USDJPY Chart
R2 148.28 - 9 April high - Strong
R1 145.93 - 2 May high - Medium
S1 144.04 - 25 April high - Medium
S1 141.97 - 29 April low - Medium
USDJPY: fundamental overview

The Bank of Japan has delayed its 2% inflation target and cut its growth forecast to 0.5% due to global trade uncertainties, reducing expectations for near-term rate hikes and boosting USDJPY. Despite this, BOJ Governor Ueda has emphasized rate hikes could resume if trade issues, particularly U.S. tariffs, are resolved, with Japan leveraging its U.S. treasury holdings in ongoing trade talks to secure favorable terms. Recent talks in Washington show progress, with hopes for a trade agreement by June, potentially shifting market focus back to BOJ rate hikes, with Bloomberg predicting a July increase and a target rate of 1.25% next year. Japan’s March data showed a slightly higher jobless rate of 2.5% but a tight labor market with a job-to-applicant ratio of 1.26, supporting wage growth and BOJ’s gradual rate hike plans.

 
AUDUSD: technical overview

There are signs of the potential formation of a longer-term base with the market trading down into a meaningful longer-term support zone. Only a monthly close below 0.5500 would give reason for rethink. A monthly close back above 0.7000 will take the big picture pressure off the downside and strengthen case for a bottom.

AUDUSD Chart
R2 0.6500 - Psychological - Strong
R1 0.6450 - 29 April/2025 high - Medium
S1 0.6344 - 24 April low - Medium
S1 0.6275 - 14 April low - Strong
AUDUSD: fundamental overview

The U.S. is nearing its first trade deals, but no official talks have occurred with China, who insists on tariff removal before negotiations, creating a standoff that could limit AUDUSD gains due to Australia’s trade ties with both nations. Weakening U.S. labor data may push the Federal Reserve toward rate cuts, with a 67% chance of a June cut and up to 100 basis points of easing by year-end, potentially weakening the dollar. In Australia, higher-than-expected March inflation and first-quarter PPI (0.9% QoQ, 3.7% YoY) suggest persistent price pressures, possibly leading the RBA to delay rate cuts despite market expectations of 115 basis points of easing in 2025. Australian retail sales rose 0.3% in March, slightly below forecasts but marking three months of growth.

 
Suggested reading

Six Ways the Federal Reserve Can Do a Better Job, B. Dudley, Bloomberg (May 1, 2025)

AI’s Second Boom, L. Lango, Investor Place (April 30, 2025)


Any opinions, news, research, analyses, prices or other information ("information") contained on this Blog, constitutes marketing communication and it has not been prepared in accordance with legal requirements designed to promote the independence of investment research. Further, the information contained within this Blog does not contain (and should not be construed as containing) investment advice or an investment recommendation, or an offer of, or solicitation for, a transaction in any financial instrument. LMAX Group has not verified the accuracy or basis-in-fact of any claim or statement made by any third parties as comments for every Blog entry.

LMAX Group will not accept liability for any loss or damage, including without limitation to, any loss of profit, which may arise directly or indirectly from use of or reliance on such information. No representation or warranty is given as to the accuracy or completeness of the above information. While the produced information was obtained from sources deemed to be reliable, LMAX Group does not provide any guarantees about the reliability of such sources. Consequently any person acting on it does so entirely at his or her own risk. It is not a place to slander, use unacceptable language or to promote LMAX Group or any other FX and CFD provider and any such postings, excessive or unjust comments and attacks will not be allowed and will be removed from the site immediately.

Day Image
1st May 2025 | view in browser
Yen declines after BOJ delays inflation target

In Asia-Pacific markets, focus centered on the BOJ’s May monetary policy decision amid holidays like Labour Day and Japan’s Golden Week, with the BOJ maintaining rates but delaying its 2% inflation target forecast, reducing expectations for near-term rate hikes and opening downside pressure on the yen.


Performance chart 30day v. USD (%)
Performance Chart
 
 
Technical & fundamental highlights
EURUSD: technical overview

The Euro has finally broken out from a multi-month consolidation off a critical longer-term low. This latest push through the 2023 high lends further support to the case for a meaningful bottom, setting the stage for a bullish structural shift and the next major upside extension targeting the 2021 high at 1.2350. Setbacks should be exceptionally well supported below 1.1000.

EURUSD Chart
R1 1.1574 - 21 April/2025 high - Strong
R1 1.1440 - 23 April high - Medium
S1 1.1300 - Figure - Medium
S2 1.1264 - 15 April low - Strong
EURUSD: fundamental overview

ECB’s Makhlouf stated on Wednesday that the long-term effects of U.S. tariffs and potential countermeasures on the euro-area are uncertain, but they pose a near-term negative impact on the region’s economic outlook and a downside risk to inflation. He noted that trade flow diversions, particularly from China and the EU, could influence inflation pressures. Additionally, Makhlouf confirmed the ECB will continue its meeting-by-meeting approach to monetary policy decisions.

 
USDJPY: technical overview

There are signs of a meaningful top in place after the market put in a multi-year high in 2024. At this point, the door is now open for a deeper setback below the 2024 low at 139.58 over the coming sessions exposing a retest of the 2023 low. Rallies should be well capped below 150.00.

USDJPY Chart
R2 144.58 - 11 April high - Medium
R1 144.04 - 25 April high - Medium
S1 141.45 - 23 April low - Medium
S1 139.89 - 22 April/2025 low - Strong
USDJPY: fundamental overview

The Bank of Japan held steady on rates as widely expected, but delayed the 2% inflation target due to increased external uncertainties. Clearly this is having an impact on price action, with the yen under pressure in the aftermath. Other data highlighted includes manufacturing PMIs showing an ongoing contraction, with declining orders and exports, leading to reduced purchasing and inventory adjustments. Meanwhile, business confidence is at its lowest since the mid-2020s due to global trade and demand concerns. Recovery hinges on stronger domestic and international demand.

 
AUDUSD: technical overview

There are signs of the potential formation of a longer-term base with the market trading down into a meaningful longer-term support zone. Only a monthly close below 0.5500 would give reason for rethink. A monthly close back above 0.7000 will take the big picture pressure off the downside and strengthen case for a bottom.

AUDUSD Chart
R2 0.6500 - Psychological - Strong
R1 0.6450 - 29 April/2025 high - Medium
S1 0.6344 - 24 April low - Medium
S1 0.6275 - 14 April low - Strong
AUDUSD: fundamental overview

The STIR market anticipates steady RBA rate cuts in 2025, pricing in a 27bp reduction for the May 20 meeting—fully expecting a 25bp cut—and a total of 112bp by year-end, suggesting a possible fifth cut, though this seems optimistic given uncertainties around tariffs and inflation. Australian trade data for March revealed a larger-than-expected surplus of A$6,900 million, driven by a 7.6% rise in exports, particularly non-monetary gold (+25.9%) and general merchandise (+5.6%), while imports fell 2.2%. Q1 terms of trade showed rising export and import prices, boosted by a weaker Aussie dollar, with export prices up 2.1% due to gains in metalliferous ores (+5.4%) and gold (+12.4%), fueled by Chinese growth optimism and global uncertainty.

 
Suggested reading

Why Berkshire Hathaway’s Stock is Beating the Market in 2025, A. Arnott, Morningstar (April 30, 2025)

Small boost to German growth fails to quell recession risk, C. Brzeski, ING (April 30, 2025)


Any opinions, news, research, analyses, prices or other information ("information") contained on this Blog, constitutes marketing communication and it has not been prepared in accordance with legal requirements designed to promote the independence of investment research. Further, the information contained within this Blog does not contain (and should not be construed as containing) investment advice or an investment recommendation, or an offer of, or solicitation for, a transaction in any financial instrument. LMAX Group has not verified the accuracy or basis-in-fact of any claim or statement made by any third parties as comments for every Blog entry.

LMAX Group will not accept liability for any loss or damage, including without limitation to, any loss of profit, which may arise directly or indirectly from use of or reliance on such information. No representation or warranty is given as to the accuracy or completeness of the above information. While the produced information was obtained from sources deemed to be reliable, LMAX Group does not provide any guarantees about the reliability of such sources. Consequently any person acting on it does so entirely at his or her own risk. It is not a place to slander, use unacceptable language or to promote LMAX Group or any other FX and CFD provider and any such postings, excessive or unjust comments and attacks will not be allowed and will be removed from the site immediately.

Day Image
30th April 2025 | view in browser
Will a heavy batch of data move markets?

Treasury Secretary Bessent’s mention of an “escalation ladder” and potential embargo seems to have been interpreted by China as a threat after it prompted the Chinese Foreign Minister to warn against yielding to U.S. tariffs.


Performance chart 30day v. USD (%)
Performance Chart
 
 
Technical & fundamental highlights
EURUSD: technical overview

The Euro has finally broken out from a multi-month consolidation off a critical longer-term low. This latest push through the 2023 high lends further support to the case for a meaningful bottom, setting the stage for a bullish structural shift and the next major upside extension targeting the 2021 high at 1.2350. Setbacks should be exceptionally well supported below 1.1000.

EURUSD Chart
R1 1.1574 - 21 April/2025 high - Strong
R1 1.1440 - 23 April high - Medium
S1 1.1308 - 23 April low - Medium
S2 1.1264 - 15 April low - Strong
EURUSD: fundamental overview

Inflation expectations in the Eurozone rose, with March Consumer CPI forecasts over 1-year and 3-year periods reaching 2.9% (up from 2.6%) and 2.5%, respectively, surpassing the ECB’s 2% target in the short term, while the new 5-year CPI expectation of 2.1% remains more stable. Despite the ECB lowering its 2025 GDP forecast to 0.9% from 1.1% and April Economic Confidence dropping to 93.6, markets expect the ECB to prioritize growth over inflation risks, pricing in a June rate cut and potentially two more, with deposit rates possibly bottoming at 1.75%-1.50%. In Germany, the May Gfk Consumer Confidence Survey improved to -20.6 from -24.5, buoyed by a stable new government and fiscal policies, despite U.S. tariffs on German goods and a gloomy IMF outlook. Franklin Templeton is out predicting the ECB might shift toward rate hikes by year-end as Europe recovers in 2025, driven by defense and infrastructure spending, potentially reigniting inflation, while banks like JPMorgan Chase, BNP Paribas, and Danske Bank forecast a stronger Euro at 1.20 or higher against the Dollar by year-end, complicating export-driven recoveries in nations like Germany amid faltering Russia-Ukraine peace talks.

 
USDJPY: technical overview

There are signs of a meaningful top in place after the market put in a multi-year high in 2024. At this point, the door is now open for a deeper setback below the 2024 low at 139.58 over the coming sessions exposing a retest of the 2023 low. Rallies should be well capped below 150.00.

USDJPY Chart
R2 144.58 - 11 April high - Medium
R1 144.04 - 25 April high - Medium
S1 141.45 - 23 April low - Medium
S1 139.89 - 22 April/2025 low - Strong
USDJPY: fundamental overview

Speculators remain heavily bullish on the Yen, with CFTC data showing net long positions at 177,814 contracts as of April 22, though overbought indicators suggest caution. The BOJ is expected to hold its policy rate at 0.5% at the April 30-May 1 meeting amid trade war uncertainties, but rising Tokyo CPI (3.5% headline, 3.4% core) signals persistent inflation, potentially prompting rate hikes in the second half of the year as trade clarity emerges. Japan’s economic data shows mixed signals: March industrial production fell 1.1% MoM, reflecting tariff-related manufacturing slowdowns, while retail sales grew 3.1% YoY, marking 36 months of expansion, though a 1.2% MoM drop hints at slowing momentum. The BOJ is likely to lower its growth forecast but maintain its gradual rate-hike stance, supported by a Bloomberg survey showing no immediate policy change, with expectations for a terminal rate now at 1% and a possible hike by September.

 
AUDUSD: technical overview

There are signs of the potential formation of a longer-term base with the market trading down into a meaningful longer-term support zone. Only a monthly close below 0.5500 would give reason for rethink. A monthly close back above 0.7000 will take the big picture pressure off the downside and strengthen case for a bottom.

AUDUSD Chart
R2 0.6500 - Psychological - Strong
R1 0.6450 - 29 April/2025 high - Medium
S1 0.6344 - 24 April low - Medium
S1 0.6275 - 14 April low - Strong
AUDUSD: fundamental overview

The Australian Dollar has been showing signs of wanting to bottom out, driven by a shift away from US Dollar assets and China’s signaling of accelerated fiscal and monetary stimulus, including faster government bond issuance, potential rate cuts, and relaxed market restrictions, which should support Aussie as a CNY proxy. However, disappointing U.S. data, the ongoing U.S.-China trade tensions, and weak Chinese Manufacturing PMI figures may temper bullish momentum, potentially stalling AUDUSD below the 200-day moving average. In Australia, March inflation held steady at 2.4%, slightly above the expected 2.2%, but markets still anticipate an RBA rate cut in May, prioritizing economic growth over inflation concerns, as CPI remains below the RBA’s 2%-3% target midpoint. Meanwhile, S&P Global Ratings cautioned that Australia’s AAA credit rating could be at risk if election pledges lead to larger deficits, though polls favor a Centre-Left Labor government win on May 3, influenced by global anti-conservative sentiment tied to the “Trump effect.”

 
Suggested reading

Hopping from tariffs to data, F. Pesole, ING (April 29, 2025)

A Generational Change?, J. Calhoun, Alhambra Investments (April 27, 2025)


Any opinions, news, research, analyses, prices or other information ("information") contained on this Blog, constitutes marketing communication and it has not been prepared in accordance with legal requirements designed to promote the independence of investment research. Further, the information contained within this Blog does not contain (and should not be construed as containing) investment advice or an investment recommendation, or an offer of, or solicitation for, a transaction in any financial instrument. LMAX Group has not verified the accuracy or basis-in-fact of any claim or statement made by any third parties as comments for every Blog entry.

LMAX Group will not accept liability for any loss or damage, including without limitation to, any loss of profit, which may arise directly or indirectly from use of or reliance on such information. No representation or warranty is given as to the accuracy or completeness of the above information. While the produced information was obtained from sources deemed to be reliable, LMAX Group does not provide any guarantees about the reliability of such sources. Consequently any person acting on it does so entirely at his or her own risk. It is not a place to slander, use unacceptable language or to promote LMAX Group or any other FX and CFD provider and any such postings, excessive or unjust comments and attacks will not be allowed and will be removed from the site immediately.

Day Image
29th April 2025 | view in browser
Bessent reassures on debt ceiling

Trading conditions have been rather quiet thus far on Tuesday, perhaps thinned by Japan’s holiday. In Canada, the election results show the Liberals, led by Mark Carney, securing a fourth consecutive election victory, though a majority government is still uncertain.


Performance chart 30day v. USD (%)
Performance Chart
 
 
Technical & fundamental highlights
EURUSD: technical overview

The Euro has finally broken out from a multi-month consolidation off a critical longer-term low. This latest push through the 2023 high lends further support to the case for a meaningful bottom, setting the stage for a bullish structural shift and the next major upside extension targeting the 2021 high at 1.2350. Setbacks should be exceptionally well supported below 1.1000.

EURUSD Chart
R1 1.1574 - 21 April/2025 high - Strong
R1 1.1440 - 23 April high - Medium
S1 1.1308 - 23 April low - Medium
S2 1.1264 - 15 April low - Strong
EURUSD: fundamental overview

The ECB’s June meeting will unveil updated economic projections, likely reflecting weaker Eurozone growth and inflation due to President Trump’s tariffs, with 2025 growth forecasts dropping from 1% to 0.8%, per the IMF. ECB President Lagarde has emphasized a data-driven approach amid stalling business growth, easing wage pressures, and a strengthening Euro, fueling expectations for an eighth 25bp rate cut, potentially lowering the deposit rate to 1.5% by year-end to boost demand. However, Franklin Templeton predicts a pivot to rate hikes by late 2025, anticipating a recovery driven by defense and infrastructure spending, which could reignite inflation in 2026. Germany’s new CDU-Social Democrat coalition is adding political stability, but consumer confidence, as seen in April’s sharp drop to -16.7 and May’s expected Gfk survey decline to -25.7, remains dampened by trade tensions and uncertainty, likely weakening upcoming economic, industrial, and services indicators.

 
USDJPY: technical overview

There are signs of a meaningful top in place after the market put in a multi-year high in 2024. At this point, the door is now open for a deeper setback below the 2024 low at 139.58 over the coming sessions exposing a retest of the 2023 low. Rallies should be well capped below 150.00.

USDJPY Chart
R2 144.58 - 11 April high - Medium
R1 144.04 - 25 April high - Medium
S1 141.45 - 23 April low - Medium
S1 139.89 - 22 April/2025 low - Strong
USDJPY: fundamental overview

Investors are closely monitoring the upcoming BOJ policy meeting, US-Japan trade talks, and key Japanese and US data releases, alongside US-China tensions, before determining market direction. Rising risk sentiment has weakened the Yen, but there could be renewed Yen demand if positive trade deals emerge, particularly favoring Japan. Such deals could reduce tariff uncertainties, refocusing attention on the BOJ’s potential rate hike resumption in late 2025, maintaining the USD/JPY downtrend. Despite strong yen bullishness in CFTC futures, overbought signals suggest caution. The BOJ is expected to hold its 0.5% rate at the April 30–May 1 meeting, but robust Tokyo CPI underscores persistent inflation, potentially prompting rate hikes later if trade clarity improves. The BOJ’s quarterly outlook may lower growth forecasts but reaffirm gradual rate increases, supported by wage growth and inflation.

 
AUDUSD: technical overview

There are signs of the potential formation of a longer-term base with the market trading down into a meaningful longer-term support zone. Only a monthly close below 0.5500 would give reason for rethink. A monthly close back above 0.7000 will take the big picture pressure off the downside and strengthen case for a bottom.

AUDUSD Chart
R2 0.6500 - Psychological - Strong
R1 0.6450 - 29 April/2025 high - Medium
S1 0.6344 - 24 April low - Medium
S1 0.6275 - 14 April low - Strong
AUDUSD: fundamental overview

The Australian Dollar is showing signs of bottoming, driven by a shift away from USD assets and supported by China’s signaling of accelerated fiscal and monetary stimulus, including potential rate cuts and increased bond issuance, alongside easing US-China trade tensions. Meanwhile, US Secretary Bessent’s comments on de-escalating trade tensions with China further support this trend. However, OIS markets expect the RBA to cut rates in May, prioritizing growth over inflation concerns. S&P Global Ratings cautioned Australia’s AAA credit rating could be at risk if election pledges lead to higher deficits, though polls suggest the Centre-Left Labor government is likely to win the May 3 election, influenced by global anti-conservative sentiment tied to the Trump effect.

 
Suggested reading

Question Time: Much Ado About Nothing?, B. Williams, Alhambra Investments (April 28, 2025)

How cryptocurrencies are solving America’s stocks and bonds problem, A. Tapscott, The NY Post (April 26, 2025)


Any opinions, news, research, analyses, prices or other information ("information") contained on this Blog, constitutes marketing communication and it has not been prepared in accordance with legal requirements designed to promote the independence of investment research. Further, the information contained within this Blog does not contain (and should not be construed as containing) investment advice or an investment recommendation, or an offer of, or solicitation for, a transaction in any financial instrument. LMAX Group has not verified the accuracy or basis-in-fact of any claim or statement made by any third parties as comments for every Blog entry.

LMAX Group will not accept liability for any loss or damage, including without limitation to, any loss of profit, which may arise directly or indirectly from use of or reliance on such information. No representation or warranty is given as to the accuracy or completeness of the above information. While the produced information was obtained from sources deemed to be reliable, LMAX Group does not provide any guarantees about the reliability of such sources. Consequently any person acting on it does so entirely at his or her own risk. It is not a place to slander, use unacceptable language or to promote LMAX Group or any other FX and CFD provider and any such postings, excessive or unjust comments and attacks will not be allowed and will be removed from the site immediately.

Day Image
28th April 2025 | view in browser
Trade talks ease tariff fears

The market has shifted from expecting extreme tariffs to anticipating moderately elevated ones, which has helped to bolster risk appetite somewhat, though investors remain cautious amid ongoing trade negotiations, likely leading to choppy, sideways trading.


Performance chart 30day v. USD (%)
Performance Chart
 
 
Technical & fundamental highlights
EURUSD: technical overview

The Euro has finally broken out from a multi-month consolidation off a critical longer-term low. This latest push through the 2023 high lends further support to the case for a meaningful bottom, setting the stage for a bullish structural shift and the next major upside extension targeting the 2021 high at 1.2350. Setbacks should be exceptionally well supported below 1.1000.

EURUSD Chart
R2 1.1600 - Figure - Medium
R1 1.1574 - 21 April/2025 high - Strong
S1 1.1308 - 23 April low - Medium
S2 1.1264 - 15 April low - Strong
EURUSD: fundamental overview

ECB Chief Economist Philip Lane stated that while U.S. tariffs may hinder Eurozone growth, trade tensions are unlikely to trigger a recession due to diverse trading partners. The ECB’s June meeting will release updated economic projections factoring in these tariffs, with expectations of weaker growth and inflation, aligning with the IMF’s revised 2025 forecast of 0.8% growth. ECB President Lagarde emphasized a data-driven approach to monetary policy, with potential for an eighth 25bps rate cut in June, as economists predict the deposit rate dropping from 2.25% to 1.5% to boost demand. Despite the ECB’s accommodative stance, Eurozone equities remain undervalued compared to U.S. markets, suggesting potential for growth and favoring European assets. This week’s Eurozone GDP and inflation data will be closely watched, while geopolitical developments, including Trump’s meeting with Zelensky and warnings of further sanctions on Russia, add uncertainty.

 
USDJPY: technical overview

There are signs of a meaningful top in place after the market put in a multi-year high in 2024. At this point, the door is now open for a deeper setback below the 2024 low at 139.58 over the coming sessions exposing a retest of the 2023 low. Rallies should be well capped below 150.00.

USDJPY Chart
R2 144.58 - 11 April high - Medium
R1 144.04 - 25 April high - Medium
S1 139.89 - 22 April/2025 low - Medium
S2 139.58 - 2024 Low - Strong
USDJPY: fundamental overview

Risk sentiment is improving and the yen has taken a hit as a consequence on the back of the traditional correlation. The Bank of Japan is anticipated to maintain its 0.5% target rate at the April 30-May 1 meeting due to trade war uncertainties, despite Tokyo’s CPI rising to 3.5% and core inflation at 3.4%, signaling persistent inflationary pressures above the BOJ’s 2% target. A Bloomberg survey indicates no policy change is expected, with only 45% of economists predicting a rate hike by September, and the BOJ’s terminal rate forecast lowered to 1%. The BOJ is likely to cut its growth forecast but signal gradual rate hikes to support yen strength, potentially aiding US-Japan trade talks, where Japan seeks concessions on tariffs and aims for an agreement by the G7 summit in June. Japan has been resisting U.S. efforts to align against China due to vital trade ties. Goldman Sachs has been out calling for USDJPY 135 within 12 months as the dollar’s overvaluation unwinds.

 
AUDUSD: technical overview

There are signs of the potential formation of a longer-term base with the market trading down into a meaningful longer-term support zone. Only a monthly close below 0.5500 would give reason for rethink. A monthly close back above 0.7000 will take the big picture pressure off the downside and strengthen case for a bottom.

AUDUSD Chart
R2 0.6500 - Psychological - Strong
R1 0.6440 - 22 April/2025 high - Medium
S1 0.6333 - 17 April low - Medium
S1 0.6275 - 14 April low - Strong
AUDUSD: fundamental overview

The Australian Dollar is showing signs of bottoming, driven by a shift away from USD assets and supported by China’s signaling of accelerated fiscal and monetary stimulus, including potential rate cuts and increased bond issuance, alongside easing US-China trade tensions. Australia’s Q1 and Q2 2025 GDP forecasts remain at 0.5% QoQ, with 2025 CPI slightly lowered to 2.5% YoY, and the RBA is expected to cut rates from 4.10% to 3.85% by Q2 2025, with markets pricing in a May cut due to growth concerns outweighing inflation risks. S&P has been out warning Australia’s AAA credit rating could be at risk if election pledges increase deficits, while polls suggest the Labor government is poised to win the May 3 election.

 
Suggested reading

Tariffs Are Hitting Global Supply Chains And Shipping, B. Wilds, Advancing Time (April 27, 2025)

Is The “Dollar” Still King? Unpacking America’s Paper Power, D. Morgan, The Morgan Report (April 27, 2025)


Any opinions, news, research, analyses, prices or other information ("information") contained on this Blog, constitutes marketing communication and it has not been prepared in accordance with legal requirements designed to promote the independence of investment research. Further, the information contained within this Blog does not contain (and should not be construed as containing) investment advice or an investment recommendation, or an offer of, or solicitation for, a transaction in any financial instrument. LMAX Group has not verified the accuracy or basis-in-fact of any claim or statement made by any third parties as comments for every Blog entry.

LMAX Group will not accept liability for any loss or damage, including without limitation to, any loss of profit, which may arise directly or indirectly from use of or reliance on such information. No representation or warranty is given as to the accuracy or completeness of the above information. While the produced information was obtained from sources deemed to be reliable, LMAX Group does not provide any guarantees about the reliability of such sources. Consequently any person acting on it does so entirely at his or her own risk. It is not a place to slander, use unacceptable language or to promote LMAX Group or any other FX and CFD provider and any such postings, excessive or unjust comments and attacks will not be allowed and will be removed from the site immediately.

Day Image
25th April 2025 | view in browser
Trump’s China trade thaw faces skepticism

President Trump’s softer approach toward China, aiming for a June summit, has been met with skepticism as China denies trade talks, labeling them “fake news” and demanding the U.S. eliminate all tariffs, though it’s considering suspending 125% tariffs on select U.S. imports like medical equipment in response to Trump’s tariff exemptions on electronics.


Performance chart 30day v. USD (%)
Performance Chart
 
 
Technical & fundamental highlights
EURUSD: technical overview

The Euro has finally broken out from a multi-month consolidation off a critical longer-term low. This latest push through the 2023 high lends further support to the case for a meaningful bottom, setting the stage for a bullish structural shift and the next major upside extension targeting the 2021 high at 1.2350. Setbacks should be exceptionally well supported below 1.1000.

EURUSD Chart
R2 1.1600 - Figure - Medium
R1 1.1574 - 21 April/2025 high - Strong
S1 1.1308 - 23 April low - Medium
S2 1.1264 - 15 April low - Strong
EURUSD: fundamental overview

ECB Chief Economist Philip Lane stated US tariffs may slow Eurozone growth but are unlikely to cause a recession, as the region has diverse trading partners. The ECB’s June meeting will provide updated economic projections, likely reflecting weaker growth and inflation due to tariffs, with current 2025 growth forecasts at 0.9% (ECB) and 0.8% (IMF). Despite debates among ECB members on pausing or continuing rate cuts, President Lagarde has emphasized a data-dependent approach, with more clarity expected from the June meeting as tariff impacts become clearer. Meanwhile, China aims to strengthen EU ties at a July summit.

 
USDJPY: technical overview

There are signs of a meaningful top in place after the market put in a multi-year high in 2024. At this point, the door is now open for a deeper setback below the 2024 low at 139.58 over the coming sessions. Rallies should be well capped below 150.00.

USDJPY Chart
R2 144.58 - 11 April high - Medium
R1 144.00 - Figure - Medium
S1 139.89 - 22 April/2025 low - Medium
S2 139.58 - 2024 Low - Strong
USDJPY: fundamental overview

The Trump administration’s softened stance on China has shifted focus to US-Japan trade talks, with Japan aiming to secure tariff concessions, particularly on rice imports, at the June G7 summit, while resisting US efforts to align against China due to vital trade ties. Goldman Sachs has been out calling for a USDJPY drop to 135 within 12 months, citing an overvalued dollar. A Bloomberg survey indicates no policy change at the BOJ’s April 30-May 1 meeting, with expectations for a rate hike by September falling to 45% and a terminal rate of 1%. The BOJ is expected to lower its 2025 growth forecast to 0.6%, per the IMF, but maintain gradual rate hikes, as a stronger yen offsets tariff impacts by reducing import costs and supporting consumption, according to Itochu Research Institute’s Chief Economist.

 
AUDUSD: technical overview

There are signs of the potential formation of a longer-term base with the market trading down into a meaningful longer-term support zone. Only a monthly close below 0.5500 would give reason for rethink. A monthly close back above 0.7000 will take the big picture pressure off the downside and strengthen case for a bottom.

AUDUSD Chart
R2 0.6500 - Psychological - Strong
R1 0.6440 - 22 April/2025 high - Medium
S1 0.6333 - 17 April low - Medium
S1 0.6275 - 14 April low - Strong
AUDUSD: fundamental overview

The Australian Dollar is showing signs of bottoming out, supported by a shift away from USD assets and China’s 600 billion yuan liquidity injection to counter US tariffs, with potential tariff relief on US imports further boosting sentiment. The Trump administration’s softened stance on China suggests the worst of the trade war’s impact may be over, benefiting antipodean currencies. Despite US tariffs posing indirect risks to Australia via trading partners like China and Japan, many analysts are projecting growth, with RBA rate cuts expected in May to mitigate slowdowns. Australia’s Labor party is planning a critical mineral reserve if re-elected, aiming to leverage the country’s position as the fourth-largest rare earths producer.

 
Suggested reading

No, Powell Is Not “Keeping Interest Rates High”, R. McMaken, Mises Institute (April 24, 2025)

Kitco Interview on Gold, Tariffs, Fed Interference, A. Merk, Merk Investments (April 22, 2025)


Any opinions, news, research, analyses, prices or other information ("information") contained on this Blog, constitutes marketing communication and it has not been prepared in accordance with legal requirements designed to promote the independence of investment research. Further, the information contained within this Blog does not contain (and should not be construed as containing) investment advice or an investment recommendation, or an offer of, or solicitation for, a transaction in any financial instrument. LMAX Group has not verified the accuracy or basis-in-fact of any claim or statement made by any third parties as comments for every Blog entry.

LMAX Group will not accept liability for any loss or damage, including without limitation to, any loss of profit, which may arise directly or indirectly from use of or reliance on such information. No representation or warranty is given as to the accuracy or completeness of the above information. While the produced information was obtained from sources deemed to be reliable, LMAX Group does not provide any guarantees about the reliability of such sources. Consequently any person acting on it does so entirely at his or her own risk. It is not a place to slander, use unacceptable language or to promote LMAX Group or any other FX and CFD provider and any such postings, excessive or unjust comments and attacks will not be allowed and will be removed from the site immediately.

Day Image
24th April 2025 | view in browser
Trump softens stance on China

The Trump administration is softening its stance on China, with President Trump indicating tariffs will decrease significantly but not to zero, and Treasury Secretary Bessent hinting at a potential major deal, while the Wall Street Journal has reported proposed tariffs of 50-65%, a significant reduction from China’s current 145%.


Performance chart 30day v. USD (%)
Performance Chart
 
 
Technical & fundamental highlights
EURUSD: technical overview

The Euro has finally broken out from a multi-month consolidation off a critical longer-term low. This latest push through the 2023 high lends further support to the case for a meaningful bottom, setting the stage for a bullish structural shift and the next major upside extension targeting the 2021 high at 1.2350. Setbacks should be exceptionally well supported below 1.1000.

EURUSD Chart
R2 1.1600 - Figure - Medium
R1 1.1574 - 21 April/2025 high - Strong
S1 1.1308 - 23 April low - Medium
S2 1.1264 - 15 April low - Strong
EURUSD: fundamental overview

The latest headlines around President Trump softening his stance on trade have opened the door for some profit taking on long Euro positions. But overall, the trend of selling the US Dollar and buying Euros remains in play on account of US administration policies and unpredictability. Also weighing on the Euro a bit is the ECB’s wage tracker, which indicates a sharp slowdown in wage growth to 1.6% in Q4 2025, down from 5.3% last year, supporting expectations of declining inflation and potential ECB interest rate cuts, with markets anticipating two more cuts in 2025. ECB President Lagarde has emphasized a data-dependent approach to future rate decisions, with clarity expected from the June 2025 ECB meeting, while U.S. tariffs and China’s export rerouting could have a disinflationary effect on the Eurozone. Geopolitical tensions, particularly fading hopes for a Russia-Ukraine peace deal, and Germany’s upcoming IFO Business Climate Survey, expected to decline to 85.2 from 86.7, add further uncertainty amid U.S. tariff impacts.

 
USDJPY: technical overview

There are signs of a meaningful top in place after the market put in a multi-year high in 2024. At this point, the door is now open for a deeper setback below the 2024 low at 139.58 over the coming sessions.

USDJPY Chart
R2 144.58 - 11 April high - Medium
R1 143.58 - 23 April high - Medium
S1 139.89 - 22 April/2025 low - Medium
S2 139.58 - 2024 Low - Strong
USDJPY: fundamental overview

The Trump administration’s softened stance on China has shifted focus to U.S.-Japan trade talks, where Japan may leverage the U.S.’s desire for a “successful” deal to negotiate favorable tariff concessions, such as tariff-free U.S. rice imports to address Japan’s domestic shortages. U.S. Treasury Secretary Bessent has ruled out currency targets in these talks, disappointing yen bulls, with speculative yen positions likely to unwind, though the dollar’s long-term downtrend persists. The Bank of Japan is expected to maintain current interest rates through June 2025, with 52% of economists in a Reuters poll anticipating a hike in Q3 2025, while the BOJ’s upcoming outlook report will likely reaffirm gradual rate increases despite U.S. tariff risks. Japan’s economy is projected to benefit from a stronger yen reducing import costs, supporting consumption and mitigating downturn risks, though the IMF cut Japan’s 2025 growth forecast to 0.6% and urged fiscal consolidation. Tokyo’s April CPI, a key inflation indicator, is expected to rise to 3.3% year-on-year, potentially fueling expectations for BOJ rate hikes in late 2025.

 
AUDUSD: technical overview

There are signs of the potential formation of a longer-term base with the market trading down into a meaningful longer-term support zone. Only a monthly close below 0.5500 would give reason for rethink. A monthly close back above 0.7000 will take the big picture pressure off the downside and strengthen case for a bottom.

AUDUSD Chart
R2 0.6500 - Psychological - Strong
R1 0.6440 - 22 April/2025 high - Medium
S1 0.6333 - 17 April low - Medium
S1 0.6275 - 14 April low - Strong
AUDUSD: fundamental overview

The Australian Dollar is showing signs of bottoming out above, supported by a broader shift away from USD assets and potential Chinese policy measures to counter U.S. tariffs, which could further bolster the Australian dollar if it reclaims the 200-day moving average. The Trump administration’s recent conciliatory gestures toward China suggest that the peak of trade war tariffs may have passed, reducing negative impacts on China and benefiting antipodean currencies like the Australian Dollar. Despite inflationary pressures, markets expect the RBA to cut rates in May to prioritize economic growth.

 
Suggested reading

Thinking the Unthinkable (About US Assets), J. Wiggins, Behavioral Investment (April 22, 2025)

China’s ‘Bleeding’ Exporters Have 3 Options. All of Them Are Bad., T. Brown, Barrons (April 22, 2025)


Any opinions, news, research, analyses, prices or other information ("information") contained on this Blog, constitutes marketing communication and it has not been prepared in accordance with legal requirements designed to promote the independence of investment research. Further, the information contained within this Blog does not contain (and should not be construed as containing) investment advice or an investment recommendation, or an offer of, or solicitation for, a transaction in any financial instrument. LMAX Group has not verified the accuracy or basis-in-fact of any claim or statement made by any third parties as comments for every Blog entry.

LMAX Group will not accept liability for any loss or damage, including without limitation to, any loss of profit, which may arise directly or indirectly from use of or reliance on such information. No representation or warranty is given as to the accuracy or completeness of the above information. While the produced information was obtained from sources deemed to be reliable, LMAX Group does not provide any guarantees about the reliability of such sources. Consequently any person acting on it does so entirely at his or her own risk. It is not a place to slander, use unacceptable language or to promote LMAX Group or any other FX and CFD provider and any such postings, excessive or unjust comments and attacks will not be allowed and will be removed from the site immediately.

Day Image
23rd April 2025 | view in browser
Trade optimism lifts stocks, Buck still struggling

The U.S. market rebound, sparked by reported progress in trade talks with India and a softened U.S. stance toward China, including Trump’s dismissal of tariff hikes and threats to oust Federal Reserve Chair Powell, signals a welcome shift to a de-escalation phase in Trump’s trade strategy, with Treasury Secretary Bessent promoting pro-market policies.


Performance chart 30day v. USD (%)
Performance Chart
 
 
Technical & fundamental highlights
EURUSD: technical overview

The Euro has finally broken out from a multi-month consolidation off a critical longer-term low. This latest push through the 2023 high lends further support to the case for a meaningful bottom, setting the stage for a bullish structural shift and the next major upside extension targeting the 2021 high at 1.2350. Setbacks should be exceptionally well supported below 1.1000.

EURUSD Chart
R2 1.1600 - Figure - Medium
R1 1.1574 - 21 April/2025 high - Strong
S1 1.1308 - 23 April low - Medium
S2 1.1264 - 15 April low - Strong
EURUSD: fundamental overview

The Euro continues to benefit from a persistent trend of selling U.S. assets in favor of non-U.S. currencies. The ECB’s latest survey slightly raised inflation forecasts to 2.2% for 2025 and 2% for 2026, with long-term expectations steady at the 2% target, while economic growth projections were lowered to 0.9% and 1.2% for 2025 and 2026, respectively, and unemployment forecasts improved to 6.3%. ECB President Lagarde emphasized a data-dependent approach to potential pauses in the rate-cutting cycle, while ECB de Guindos suggested the Euro could challenge the dollar as a reserve currency if Europe deepens integration, though this is a long-term goal. April Preliminary PMI data for the Eurozone, including Germany and France, is due today, with manufacturing PMIs expected to remain contractionary and France’s services sector likely to lag.

 
USDJPY: technical overview

There are signs of a meaningful top in place after the market put in a multi-year high in 2024. At this point, the door is now open for a deeper setback below the 2024 low at 139.58 over the coming sessions.

USDJPY Chart
R2 143.60 - 15 April high - Medium
R1 143.22 - 23 April high - Medium
S1 139.89 - 22 April/2025 low - Medium
S2 139.58 - 2024 Low - Strong
USDJPY: fundamental overview

U.S.-Japan trade talks are critical, with markets watching for Trump’s concessions on tariffs, which could support the dollar and risk assets while prompting profit-taking on yen longs. Japan, led by Prime Minister Ishiba, is pushing back to protect its interests and engaging China to avoid trade friction. Quick wins like tariff-free U.S. rice imports are likely, but Japan’s Finance Minister Kato may avoid firm currency commitments, favoring “market-determined rates.” The BOJ remains cautious on rate hikes, potentially cutting 2027 inflation forecasts to 2% and this year’s growth projection from 1.1% to 0.5% due to a stronger yen and tariff uncertainties.

 
AUDUSD: technical overview

There are signs of the potential formation of a longer-term base with the market trading down into a meaningful longer-term support zone. Only a monthly close below 0.5500 would give reason for rethink. A monthly close back above 0.7000 will take the big picture pressure off the downside and strengthen case for a bottom.

AUDUSD Chart
R2 0.6500 - Psychological - Strong
R1 0.6440 - 22 April/2025 high - Medium
S1 0.6333 - 17 April low - Medium
S1 0.6275 - 14 April low - Strong
AUDUSD: fundamental overview

The Australian Dollar appears to be forming a bottom as investors rotate out of USD assets, with potential for further gains if China bolsters economic support to counter U.S. tariffs. And although U.S.-China trade dynamics remain volatile, the Trump administration’s signaling of a softer stance has helped the Australian Dollar. OIS markets are pricing in a certain RBA rate cut in May, as economic growth concerns outweigh inflation risks.

 
Suggested reading

Peak America?, J. Calhoun, Alhambra (April 20, 2025)

The ultimate self-driving car stock, S. McBride, RiskHedge (April 18, 2025)


Any opinions, news, research, analyses, prices or other information ("information") contained on this Blog, constitutes marketing communication and it has not been prepared in accordance with legal requirements designed to promote the independence of investment research. Further, the information contained within this Blog does not contain (and should not be construed as containing) investment advice or an investment recommendation, or an offer of, or solicitation for, a transaction in any financial instrument. LMAX Group has not verified the accuracy or basis-in-fact of any claim or statement made by any third parties as comments for every Blog entry.

LMAX Group will not accept liability for any loss or damage, including without limitation to, any loss of profit, which may arise directly or indirectly from use of or reliance on such information. No representation or warranty is given as to the accuracy or completeness of the above information. While the produced information was obtained from sources deemed to be reliable, LMAX Group does not provide any guarantees about the reliability of such sources. Consequently any person acting on it does so entirely at his or her own risk. It is not a place to slander, use unacceptable language or to promote LMAX Group or any other FX and CFD provider and any such postings, excessive or unjust comments and attacks will not be allowed and will be removed from the site immediately.