Day Image
23rd April 2025 | view in browser
Trade optimism lifts stocks, Buck still struggling

The U.S. market rebound, sparked by reported progress in trade talks with India and a softened U.S. stance toward China, including Trump’s dismissal of tariff hikes and threats to oust Federal Reserve Chair Powell, signals a welcome shift to a de-escalation phase in Trump’s trade strategy, with Treasury Secretary Bessent promoting pro-market policies.


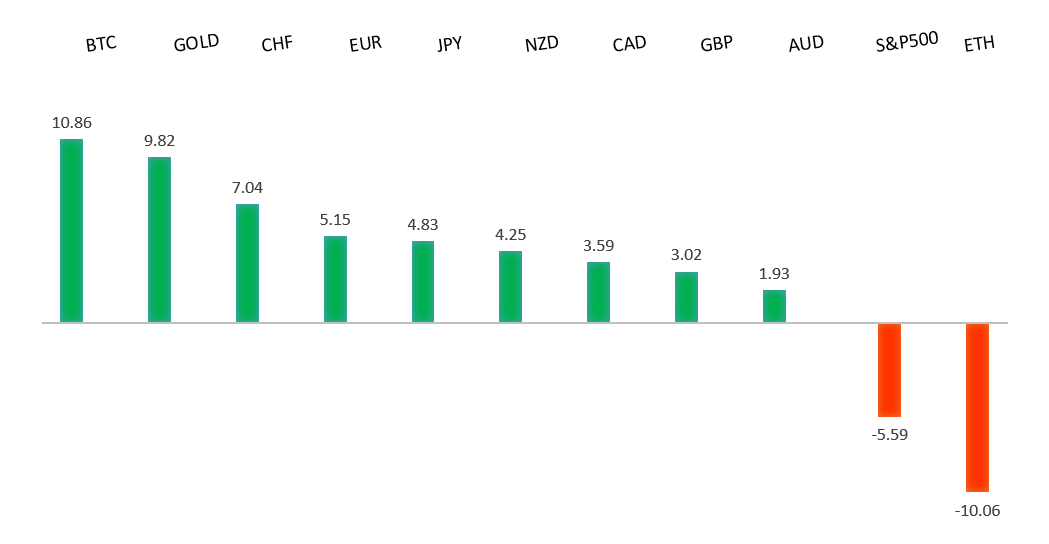
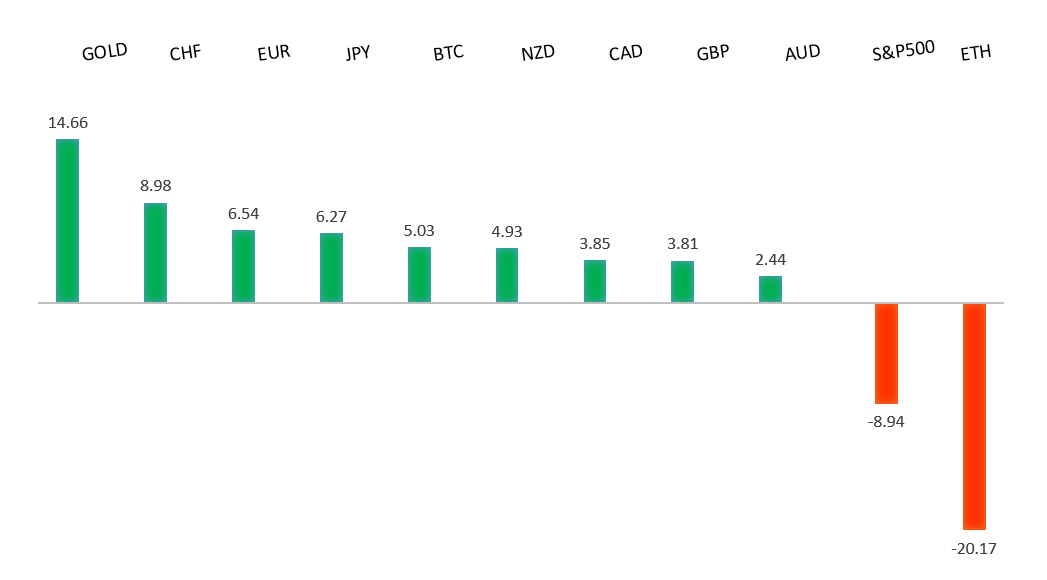
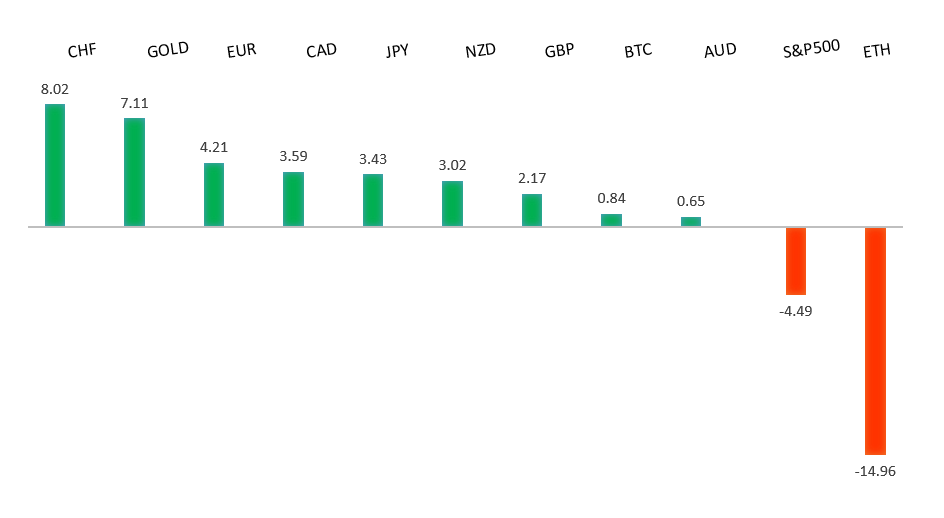
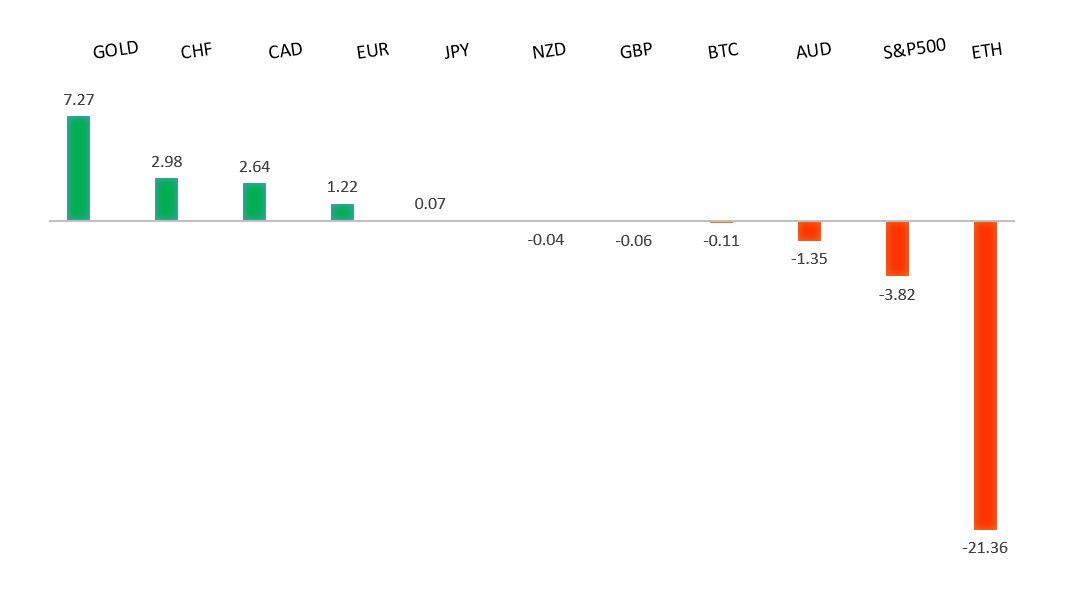
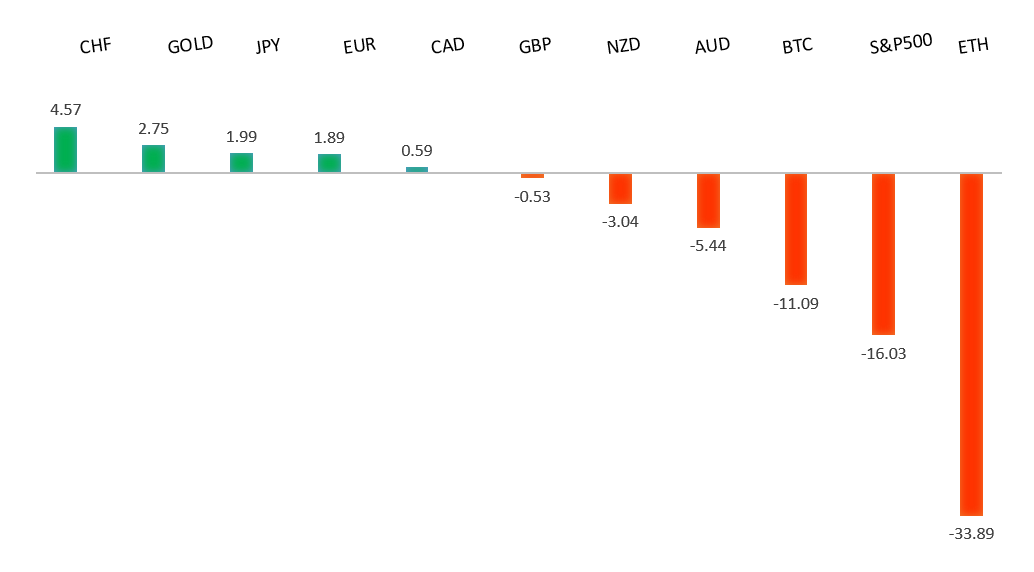
Performance chart 30day v. USD (%)
Performance Chart
 
 
Technical & fundamental highlights
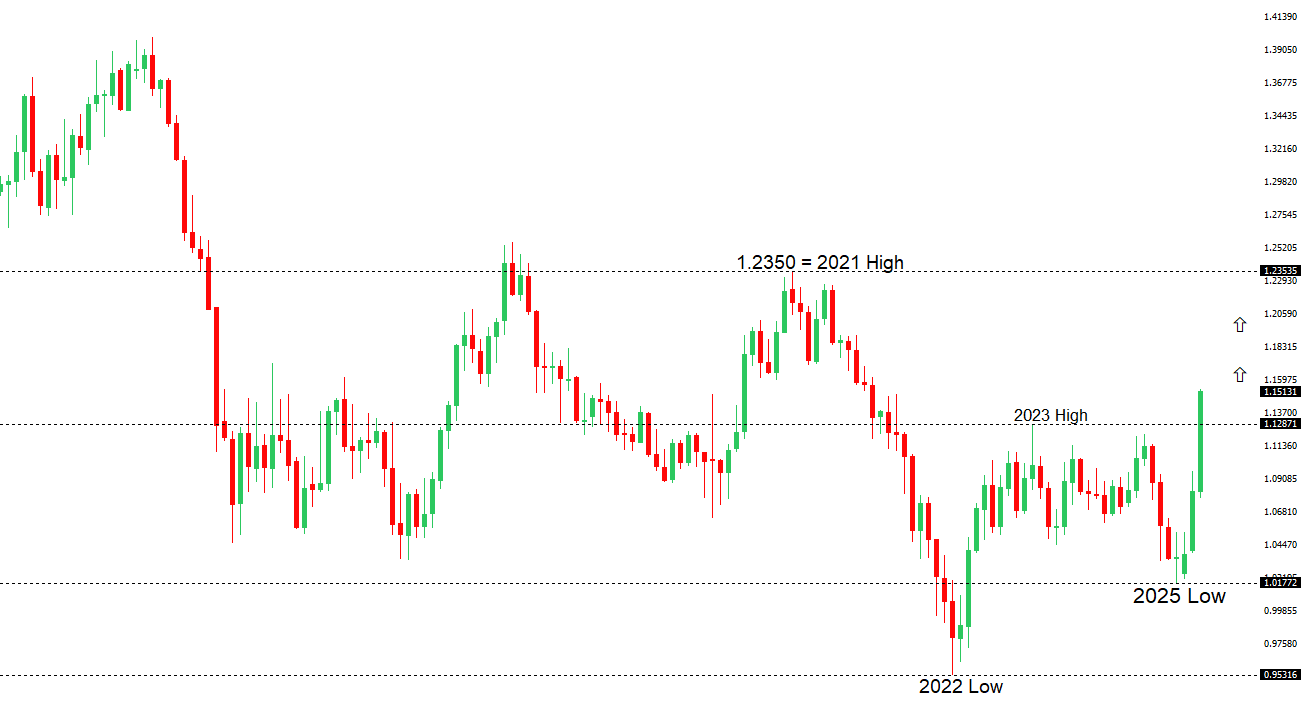
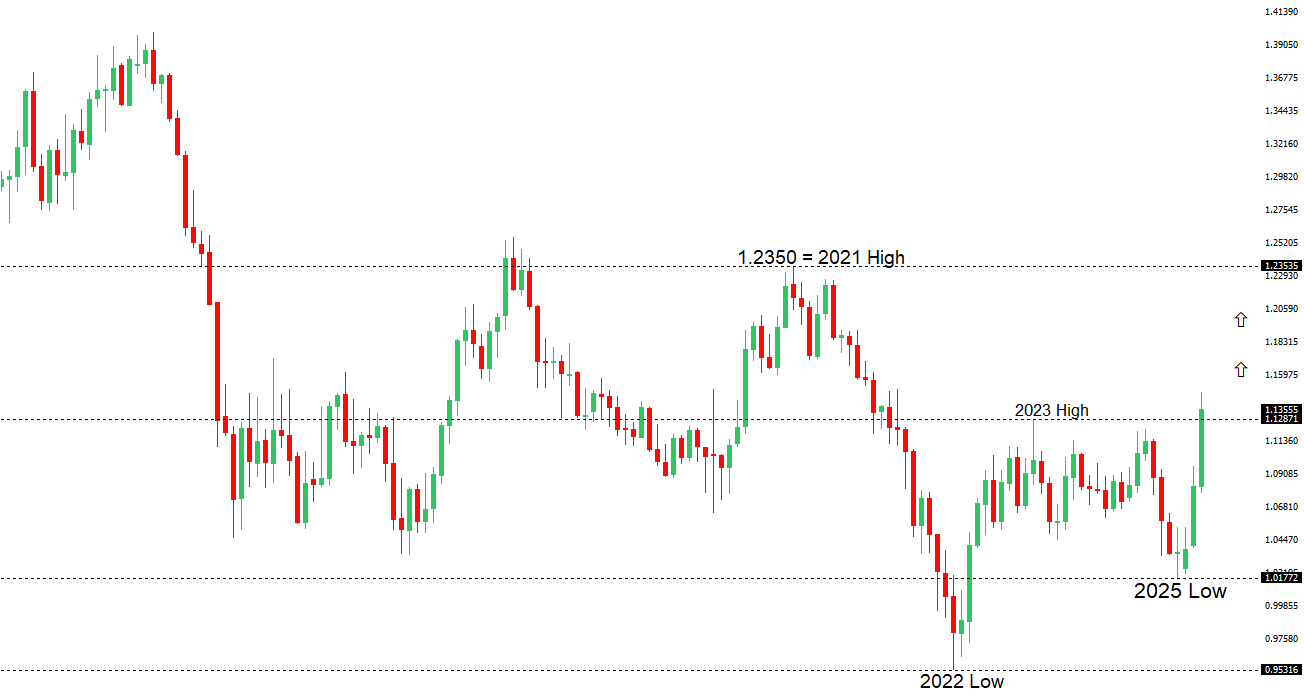
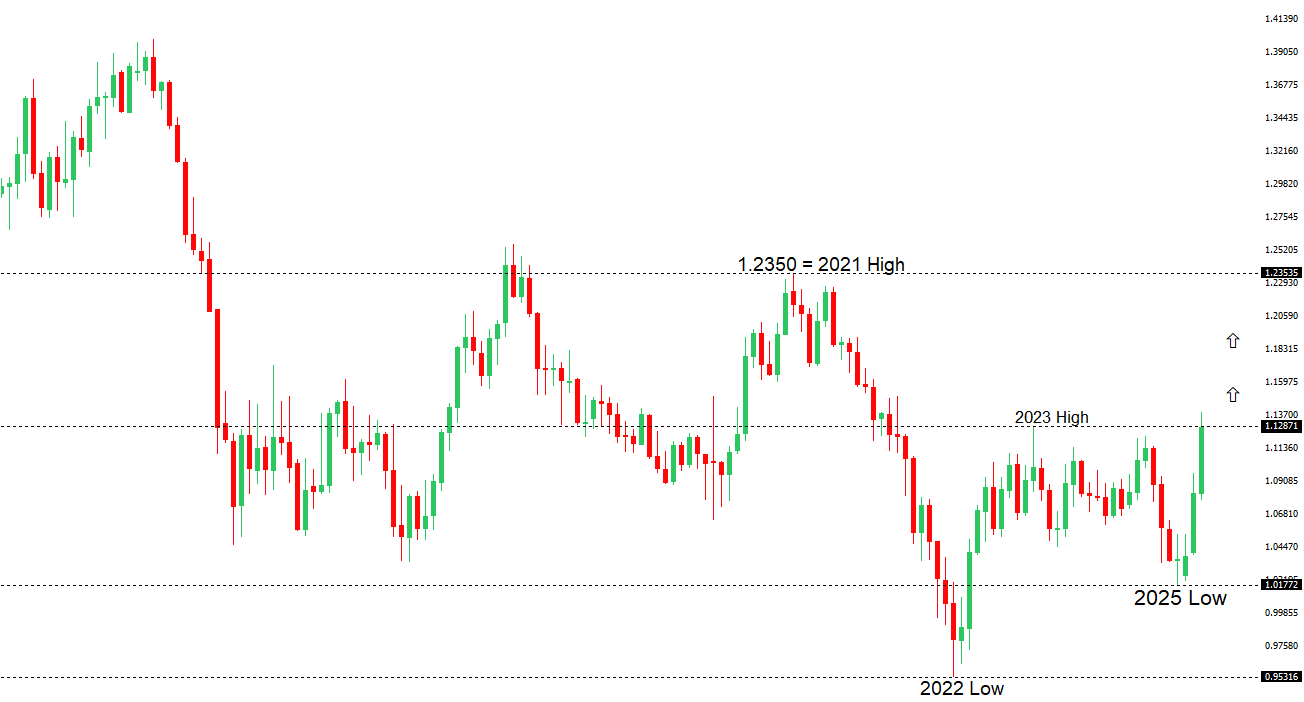
EURUSD: technical overview

The Euro has finally broken out from a multi-month consolidation off a critical longer-term low. This latest push through the 2023 high lends further support to the case for a meaningful bottom, setting the stage for a bullish structural shift and the next major upside extension targeting the 2021 high at 1.2350. Setbacks should be exceptionally well supported below 1.1000.

EURUSD Chart
R2 1.1600 - Figure - Medium
R1 1.1574 - 21 April/2025 high - Strong
S1 1.1308 - 23 April low - Medium
S2 1.1264 - 15 April low - Strong
EURUSD: fundamental overview

The Euro continues to benefit from a persistent trend of selling U.S. assets in favor of non-U.S. currencies. The ECB’s latest survey slightly raised inflation forecasts to 2.2% for 2025 and 2% for 2026, with long-term expectations steady at the 2% target, while economic growth projections were lowered to 0.9% and 1.2% for 2025 and 2026, respectively, and unemployment forecasts improved to 6.3%. ECB President Lagarde emphasized a data-dependent approach to potential pauses in the rate-cutting cycle, while ECB de Guindos suggested the Euro could challenge the dollar as a reserve currency if Europe deepens integration, though this is a long-term goal. April Preliminary PMI data for the Eurozone, including Germany and France, is due today, with manufacturing PMIs expected to remain contractionary and France’s services sector likely to lag.

 
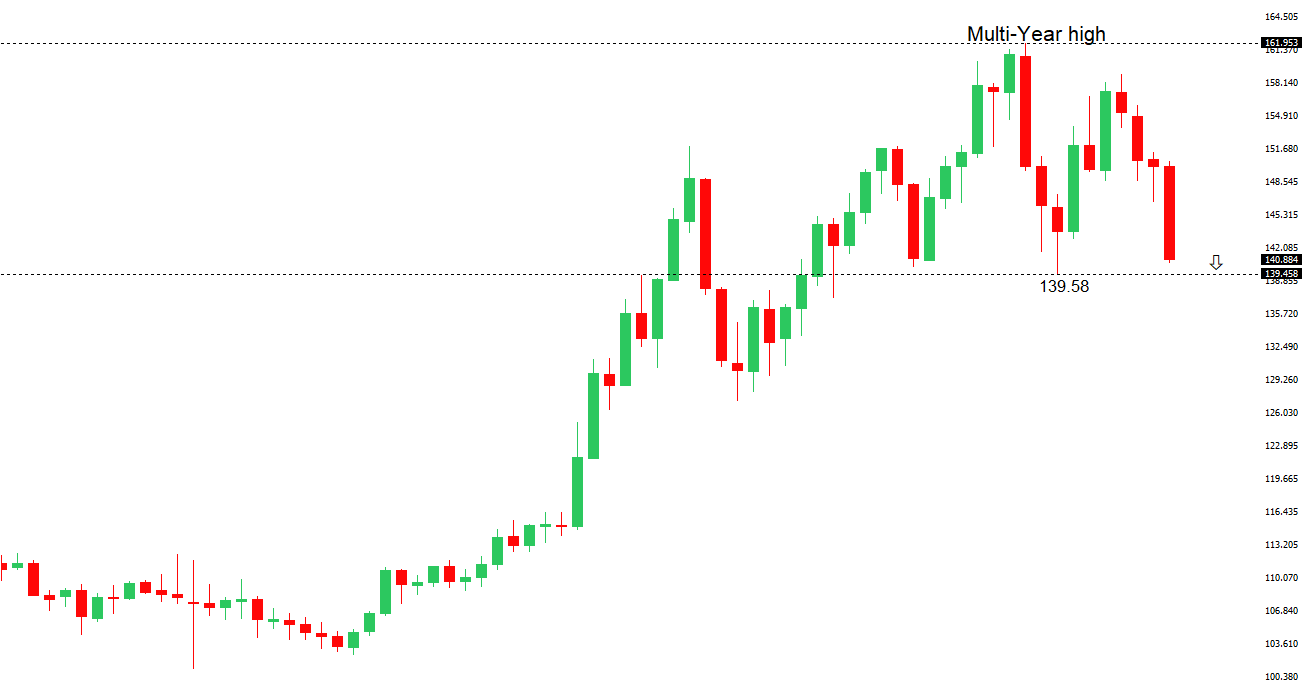
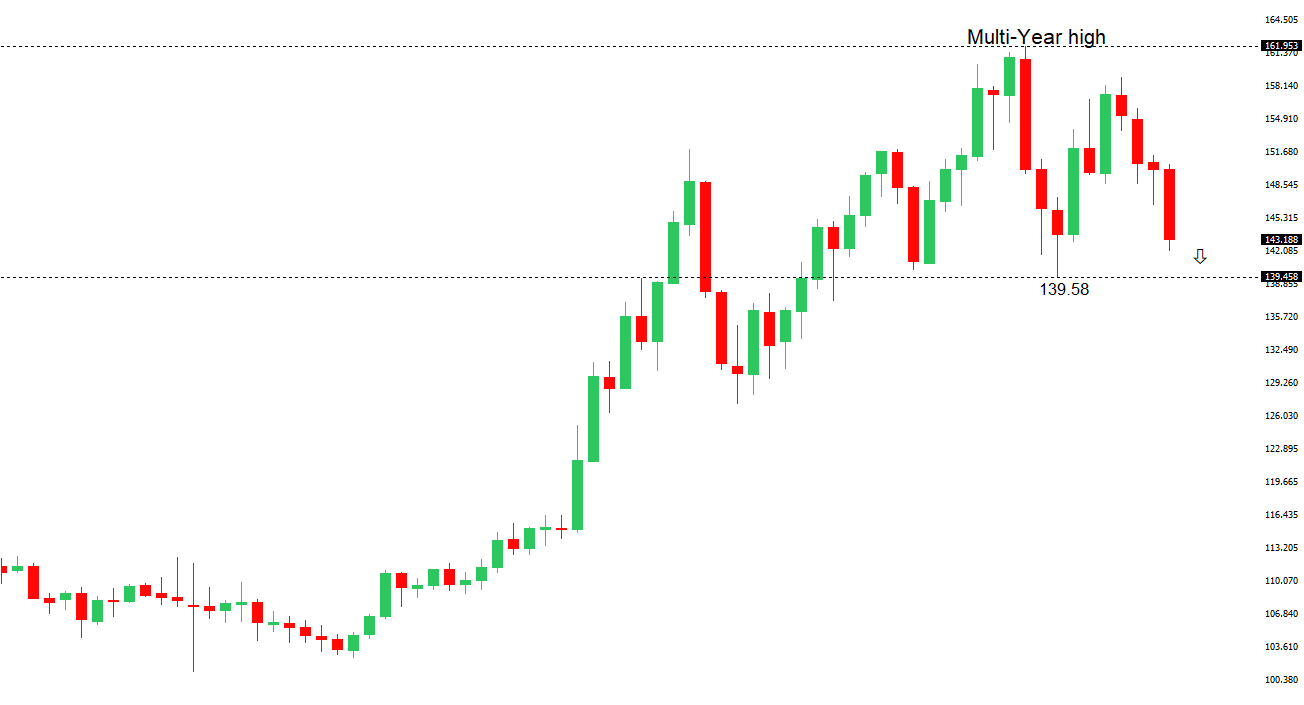
USDJPY: technical overview

There are signs of a meaningful top in place after the market put in a multi-year high in 2024. At this point, the door is now open for a deeper setback below the 2024 low at 139.58 over the coming sessions.

USDJPY Chart
R2 143.60 - 15 April high - Medium
R1 143.22 - 23 April high - Medium
S1 139.89 - 22 April/2025 low - Medium
S2 139.58 - 2024 Low - Strong
USDJPY: fundamental overview

U.S.-Japan trade talks are critical, with markets watching for Trump’s concessions on tariffs, which could support the dollar and risk assets while prompting profit-taking on yen longs. Japan, led by Prime Minister Ishiba, is pushing back to protect its interests and engaging China to avoid trade friction. Quick wins like tariff-free U.S. rice imports are likely, but Japan’s Finance Minister Kato may avoid firm currency commitments, favoring “market-determined rates.” The BOJ remains cautious on rate hikes, potentially cutting 2027 inflation forecasts to 2% and this year’s growth projection from 1.1% to 0.5% due to a stronger yen and tariff uncertainties.

 
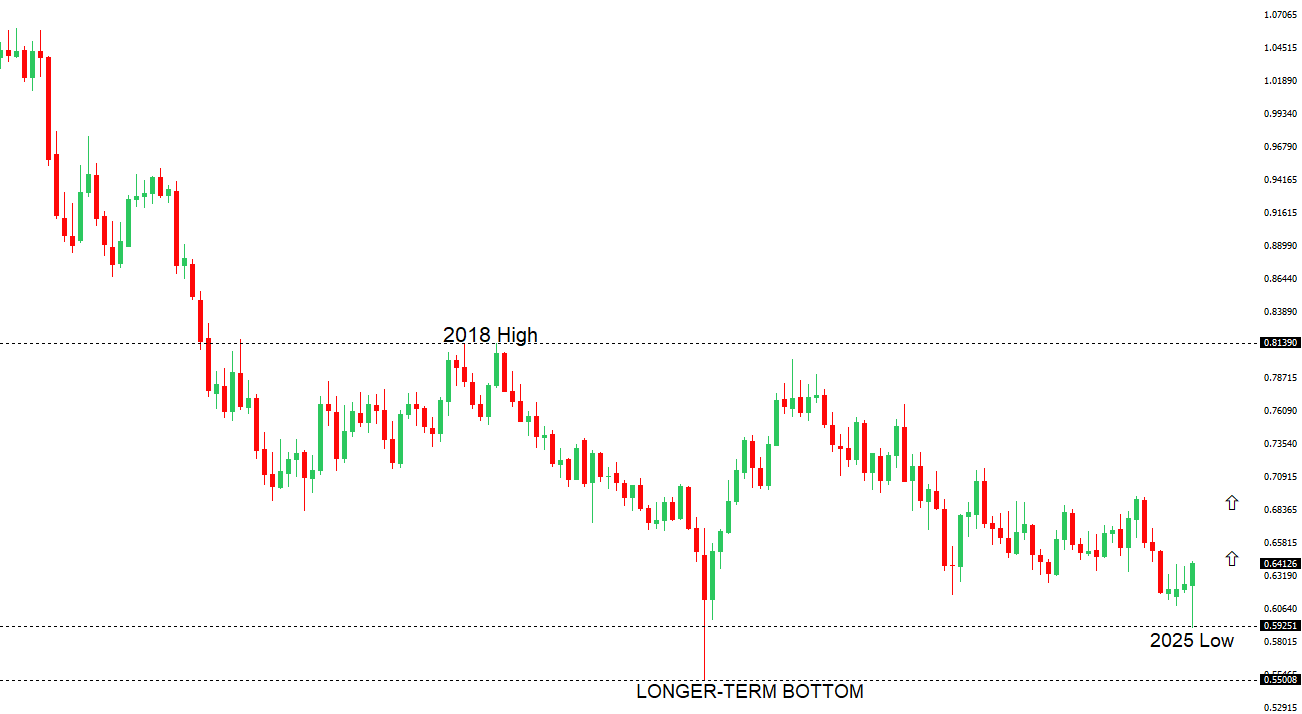
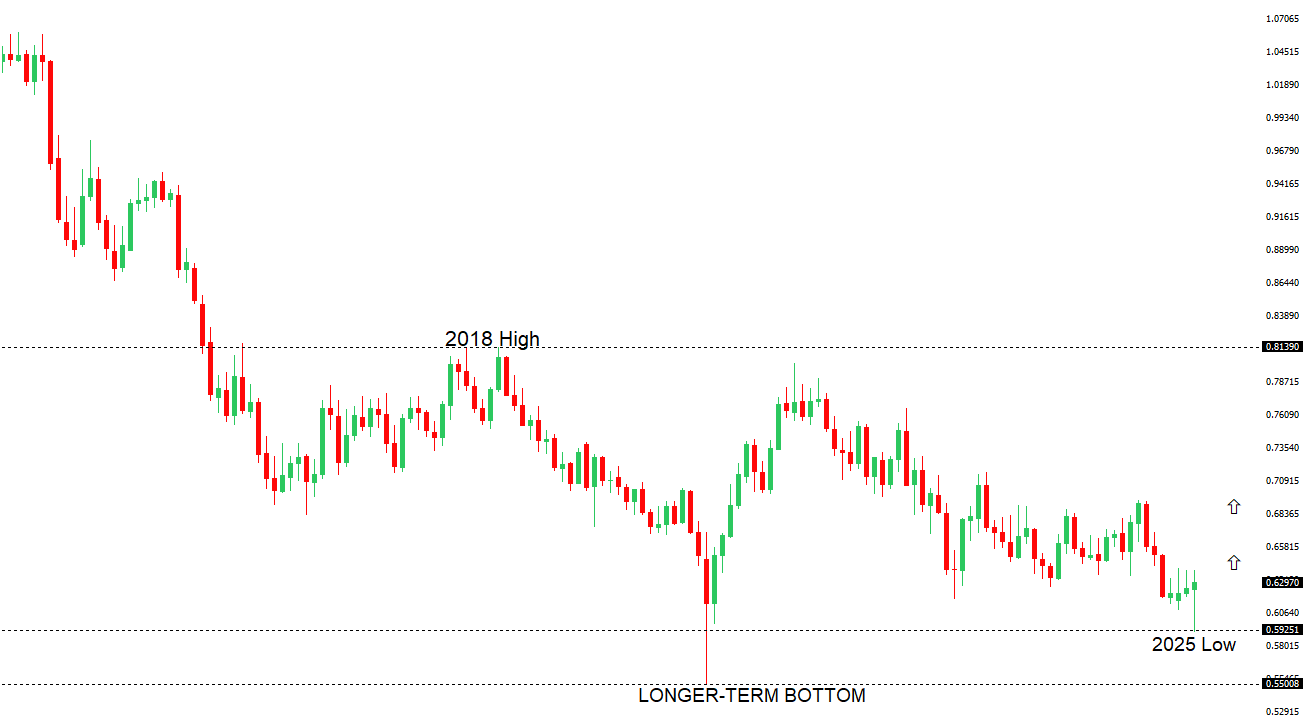
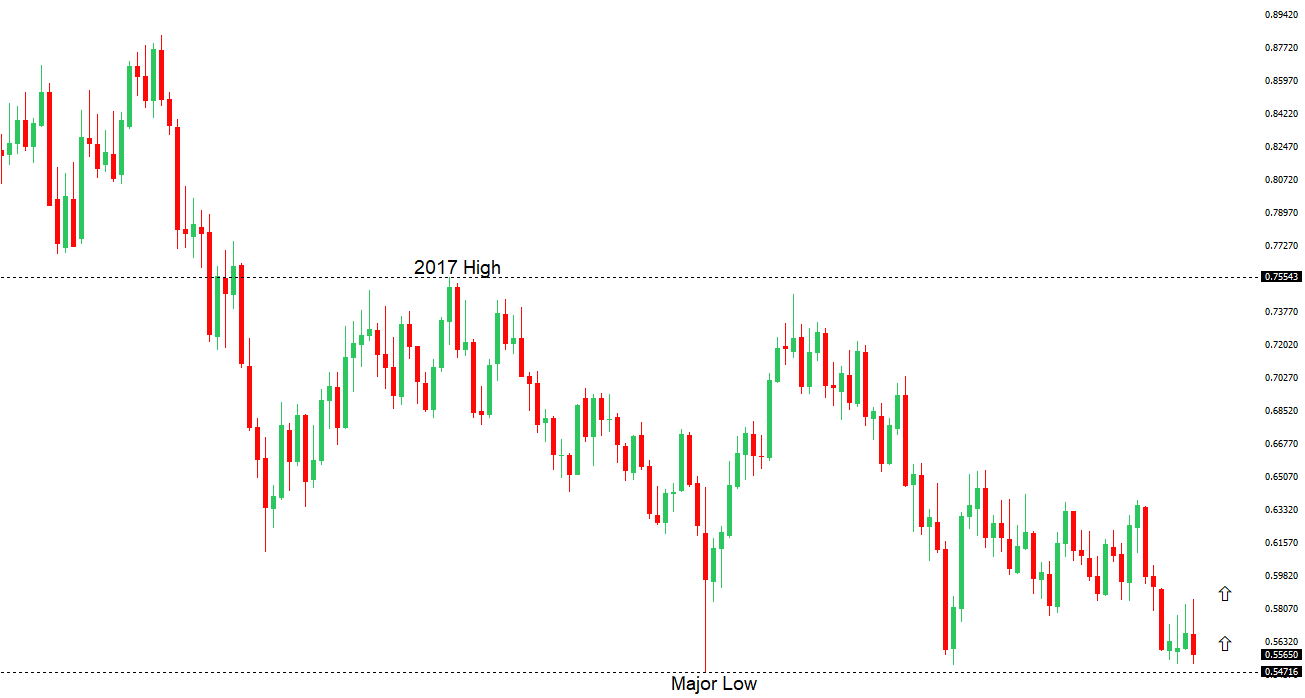
AUDUSD: technical overview

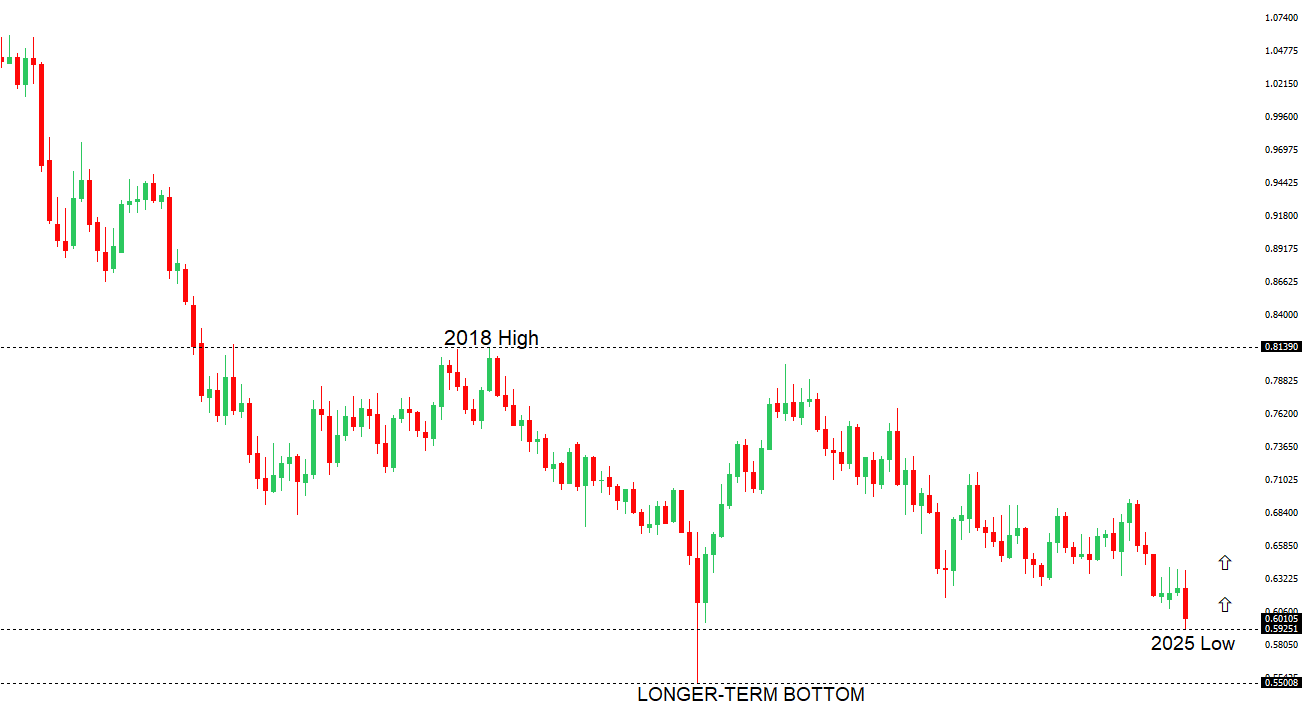
There are signs of the potential formation of a longer-term base with the market trading down into a meaningful longer-term support zone. Only a monthly close below 0.5500 would give reason for rethink. A monthly close back above 0.7000 will take the big picture pressure off the downside and strengthen case for a bottom.

AUDUSD Chart
R2 0.6500 - Psychological - Strong
R1 0.6440 - 22 April/2025 high - Medium
S1 0.6333 - 17 April low - Medium
S1 0.6275 - 14 April low - Strong
AUDUSD: fundamental overview

The Australian Dollar appears to be forming a bottom as investors rotate out of USD assets, with potential for further gains if China bolsters economic support to counter U.S. tariffs. And although U.S.-China trade dynamics remain volatile, the Trump administration’s signaling of a softer stance has helped the Australian Dollar. OIS markets are pricing in a certain RBA rate cut in May, as economic growth concerns outweigh inflation risks.

 
Suggested reading

Peak America?, J. Calhoun, Alhambra (April 20, 2025)

The ultimate self-driving car stock, S. McBride, RiskHedge (April 18, 2025)


Any opinions, news, research, analyses, prices or other information ("information") contained on this Blog, constitutes marketing communication and it has not been prepared in accordance with legal requirements designed to promote the independence of investment research. Further, the information contained within this Blog does not contain (and should not be construed as containing) investment advice or an investment recommendation, or an offer of, or solicitation for, a transaction in any financial instrument. LMAX Group has not verified the accuracy or basis-in-fact of any claim or statement made by any third parties as comments for every Blog entry.

LMAX Group will not accept liability for any loss or damage, including without limitation to, any loss of profit, which may arise directly or indirectly from use of or reliance on such information. No representation or warranty is given as to the accuracy or completeness of the above information. While the produced information was obtained from sources deemed to be reliable, LMAX Group does not provide any guarantees about the reliability of such sources. Consequently any person acting on it does so entirely at his or her own risk. It is not a place to slander, use unacceptable language or to promote LMAX Group or any other FX and CFD provider and any such postings, excessive or unjust comments and attacks will not be allowed and will be removed from the site immediately.

Day Image
22nd April 2025 | view in browser
Trump Slams Fed, Buck hits 3-Year low

Risk assets have come under added pressure following President Trump’s Truth Social post demanding “preemptive” Federal Reserve rate cuts, accusing the Fed Chair of lagging and politicizing monetary policy. This has translated to three-year lows for the US Dollar against outperforming peers.


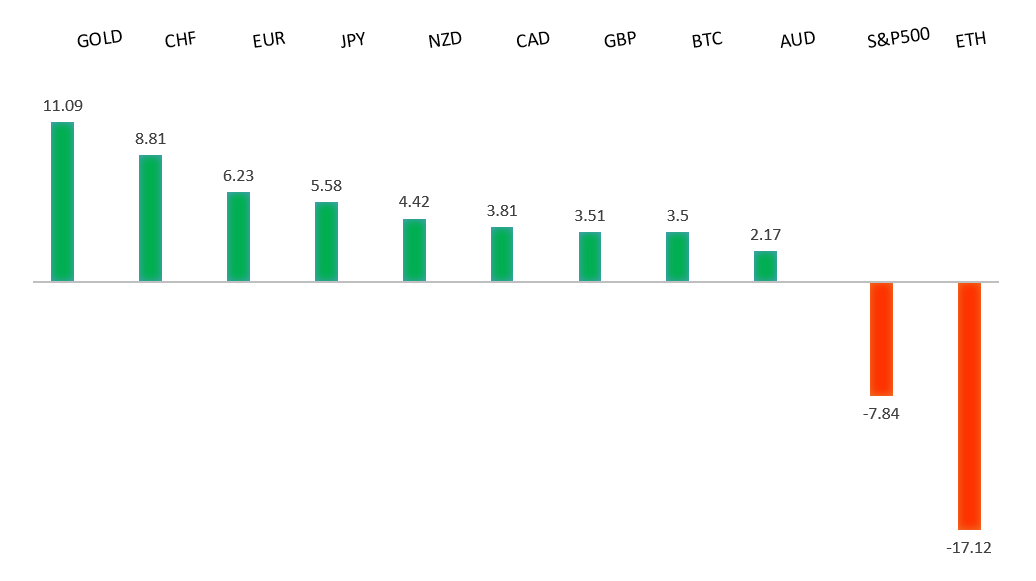
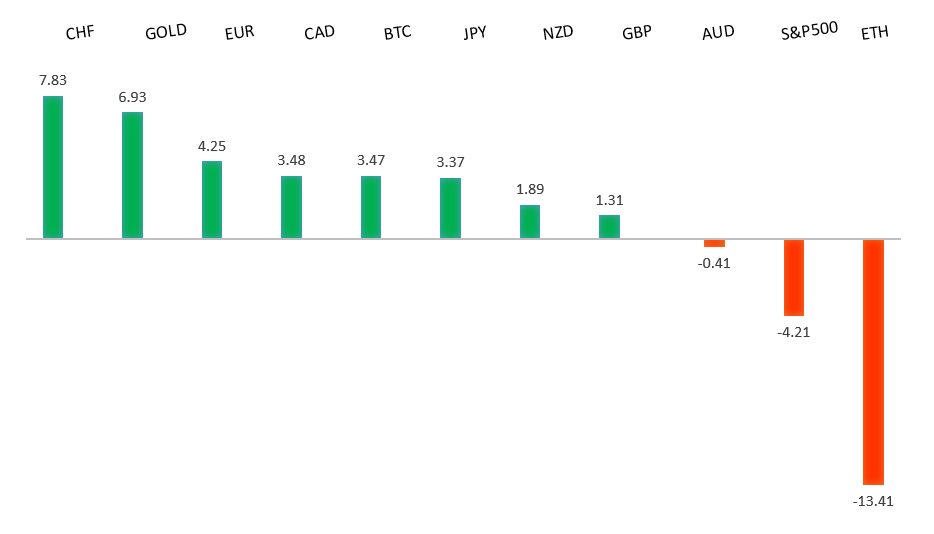
Performance chart 30day v. USD (%)
Performance Chart
 
 
Technical & fundamental highlights
EURUSD: technical overview

The Euro has finally broken out from a multi-month consolidation off a critical longer-term low. This latest push through the 2023 high lends further support to the case for a meaningful bottom, setting the stage for a bullish structural shift and the next major upside extension targeting the 2021 high at 1.2350. Setbacks should be exceptionally well supported below 1.1000.

EURUSD Chart
R2 1.1600 - Figure - Medium
R1 1.1574 - 21 April/2025 high - Strong
S1 1.1335 - 17 April low - Medium
S2 1.1264 - 15 April low - Strong
EURUSD: fundamental overview

The Euro has been a prime beneficiary of the ongoing “Sell America, Buy Gold, and non-USD currencies” theme, driven by a weakening U.S. dollar, which is increasingly treated like an emerging market currency despite its yield advantage. The Euro’s strength, as the largest DXY component, is bolstered by Chinese investors and global asset managers diversifying into European bonds, particularly German bunds, amid U.S. trade policy volatility under President Trump. The ECB’s recent rate cut and dovish leanings have not dented the Euro’s bull case, with improving Eurozone growth prospects and resilient service PMIs in Germany more than offsetting. Geopolitical developments, including Russia’s openness to a Ukraine ceasefire and Trump’s NATO proposal, further reduce regional risk premiums, indirectly supporting the Euro’s upward trajectory. Looking ahead, key standouts on Tuesday’s calendar come from some ECB speak, Fed speak, Eurozone consumer confidence, the Richmond Fed manufacturing index and BOE speak.

 
GBPUSD: technical overview

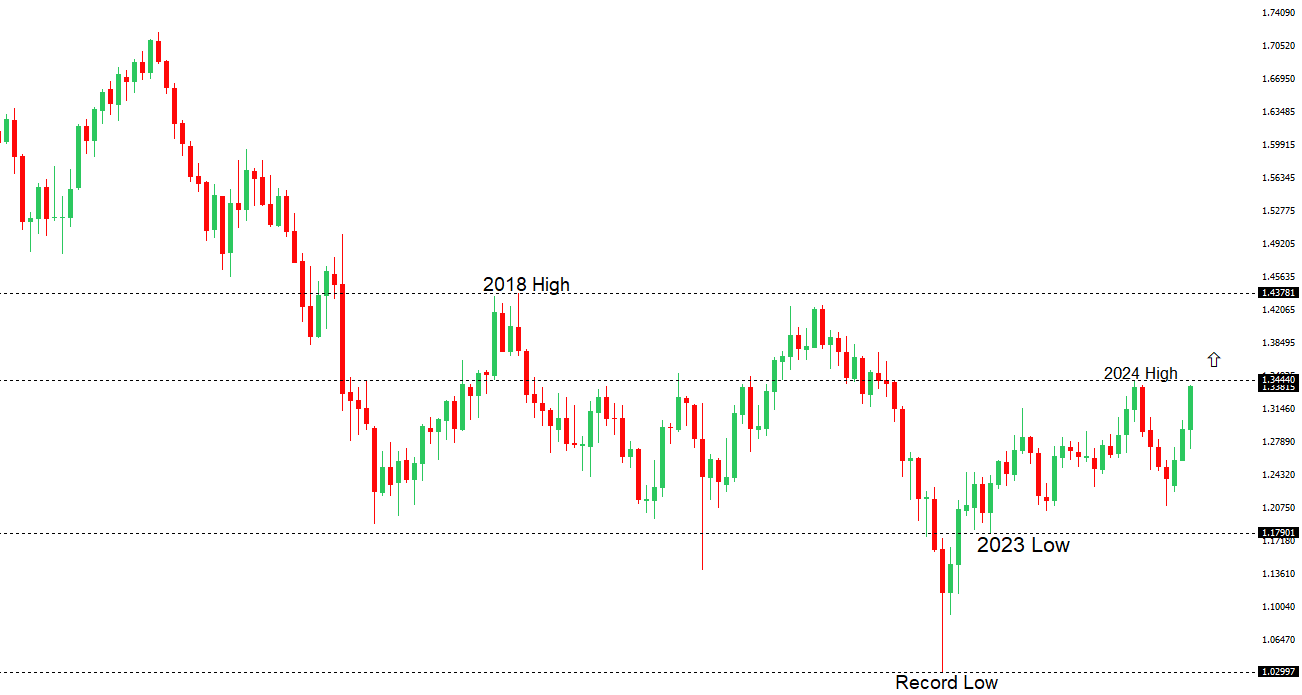
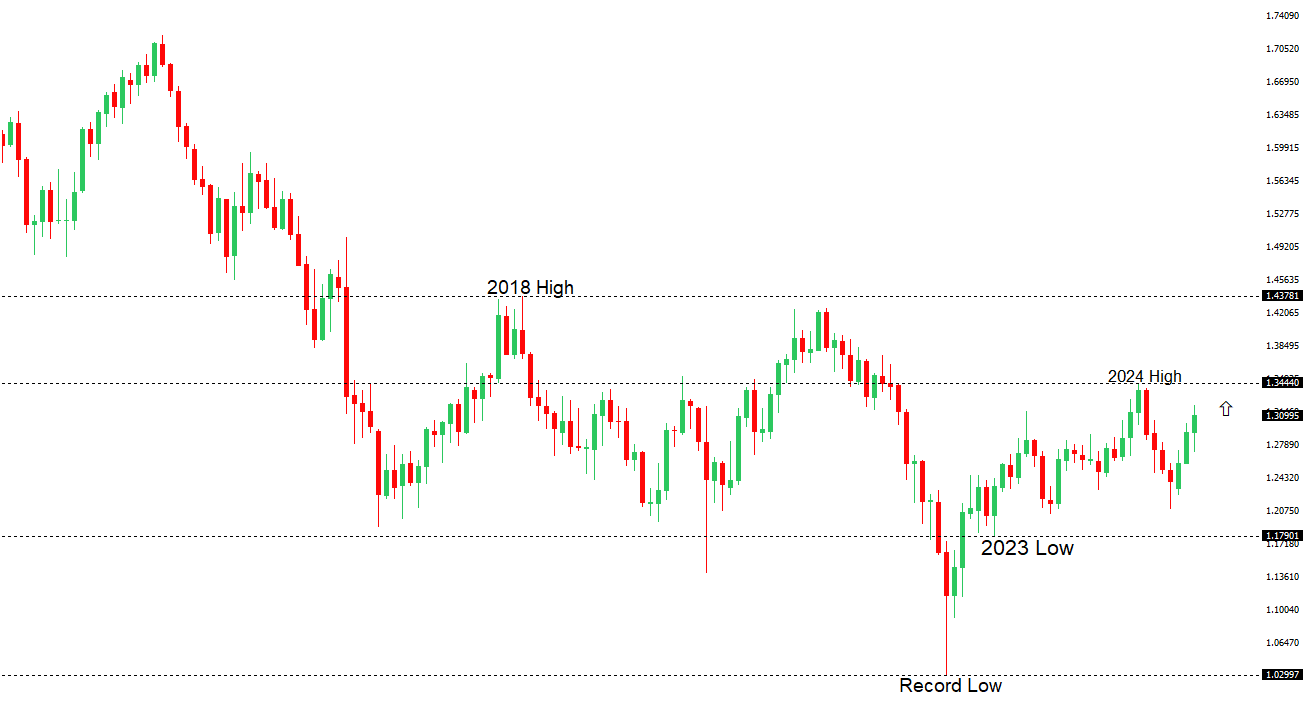
Signs have emerged of the market wanting to put in a longer-term base after collapsing to a record low in September 2022. The door is now open for the next major upside extension towards the 2018 high at 1.4377. Setbacks should be well supported above 1.2500 on a monthly close basis.

GBPUSD Chart
R2 1.3435 - 26 September high - Strong
R1 1.3424 - 22 April/2025 high - Medium
S1 1.3274 - 21 April low - Medium
S2 1.3203 - 17 April low - Medium
GBPUSD: fundamental overview

The Pound has run up to a fresh yearly high against the Buck, buoyed by optimism around a potential UK-U.S. trade deal. Vice President Vance has been on the wires saying there is a good chance a deal will get done. The UK’s strategic pivot to a narrow economic agreement, avoiding contentious issues like agriculture, has helped to mitigate tariff impacts and preserve GBP stability. Looking ahead, key standouts on Tuesday’s calendar come from some ECB speak, Fed speak, Eurozone consumer confidence, the Richmond Fed manufacturing index and BOE speak.

 
USDJPY: technical overview

There are signs of a meaningful top in place after the market put in a multi-year high in 2024. At this point, the door is now open for a deeper setback below the 2024 low at 139.58 over the coming sessions.

USDJPY Chart
R2 143.60 - 15 April high - Medium
R1 142.11 - 21 April high - Medium
S1 139.89 - 22 April/2025 low - Medium
S2 139.58 - 2024 Low - Strong
USDJPY: fundamental overview

CFTC data shows speculators’ net long JPY positions surging to 171,855 contracts, driven by heightened U.S.-Japan trade tensions and a weakening U.S. dollar amid fears of U.S. stagflation and declining asset credibility. Japan’s firm stance in trade talks, with PM Ishiba resisting U.S. demands for greater auto and agricultural market access while prioritizing national interests, has also fueled a risk-off sentiment supporting the Yen on traditional correlations. The Bank of Japan’s commitment to gradual rate hikes, despite potential downward revisions to growth and inflation forecasts, further underpins the Yen’s appeal. Looking ahead, key standouts on Tuesday’s calendar come from some ECB speak, Fed speak, Eurozone consumer confidence, the Richmond Fed manufacturing index and BOE speak.

 
AUDUSD: technical overview

There are signs of the potential formation of a longer-term base with the market trading down into a meaningful longer-term support zone. Only a monthly close below 0.5500 would give reason for rethink. A monthly close back above 0.7000 will take the big picture pressure off the downside and strengthen case for a bottom.

AUDUSD Chart
R2 0.6500 - Psychological - Strong
R1 0.6440 - 22 April/2025 high - Medium
S1 0.6333 - 17 April low - Medium
S1 0.6275 - 14 April low - Strong
AUDUSD: fundamental overview

The Australian Dollar has been resilient, despite tariff uncertainties, on account of offsetting expectations for Chinese policy stimulus to counter U.S. tariffs. The RBA’s cautious stance on rate cuts, with markets pricing in a May cut following robust labor data has also tempered expectations for an aggressive easing response. Upcoming April PMI surveys will be closely watched for any indication of tariff impacts on Australia’s economy. Looking ahead, key standouts on Tuesday’s calendar come from some ECB speak, Fed speak, Eurozone consumer confidence, the Richmond Fed manufacturing index and BOE speak.

 
Suggested reading

Paul Volcker Never Was Because Monetarism Never Will Be, J. Tamny, Forbes (April 20, 2025)

How will Wall Street react to the Trump-Powell showdown?, J. Mathis, The Week (April 20, 2025)


Any opinions, news, research, analyses, prices or other information ("information") contained on this Blog, constitutes marketing communication and it has not been prepared in accordance with legal requirements designed to promote the independence of investment research. Further, the information contained within this Blog does not contain (and should not be construed as containing) investment advice or an investment recommendation, or an offer of, or solicitation for, a transaction in any financial instrument. LMAX Group has not verified the accuracy or basis-in-fact of any claim or statement made by any third parties as comments for every Blog entry.

LMAX Group will not accept liability for any loss or damage, including without limitation to, any loss of profit, which may arise directly or indirectly from use of or reliance on such information. No representation or warranty is given as to the accuracy or completeness of the above information. While the produced information was obtained from sources deemed to be reliable, LMAX Group does not provide any guarantees about the reliability of such sources. Consequently any person acting on it does so entirely at his or her own risk. It is not a place to slander, use unacceptable language or to promote LMAX Group or any other FX and CFD provider and any such postings, excessive or unjust comments and attacks will not be allowed and will be removed from the site immediately.

Day Image
21st April 2025 | view in browser
Markets consumed with ‘Sell America’ theme

The Trump administration’s efforts to undermine the independence of agencies like the SEC, the Consumer Financial Protection Bureau, and potentially the Federal Reserve, alongside escalating U.S.-China trade tensions and tariff uncertainties, are fueling a “Sell America” sentiment and contributing to the U.S. dollar’s decline.


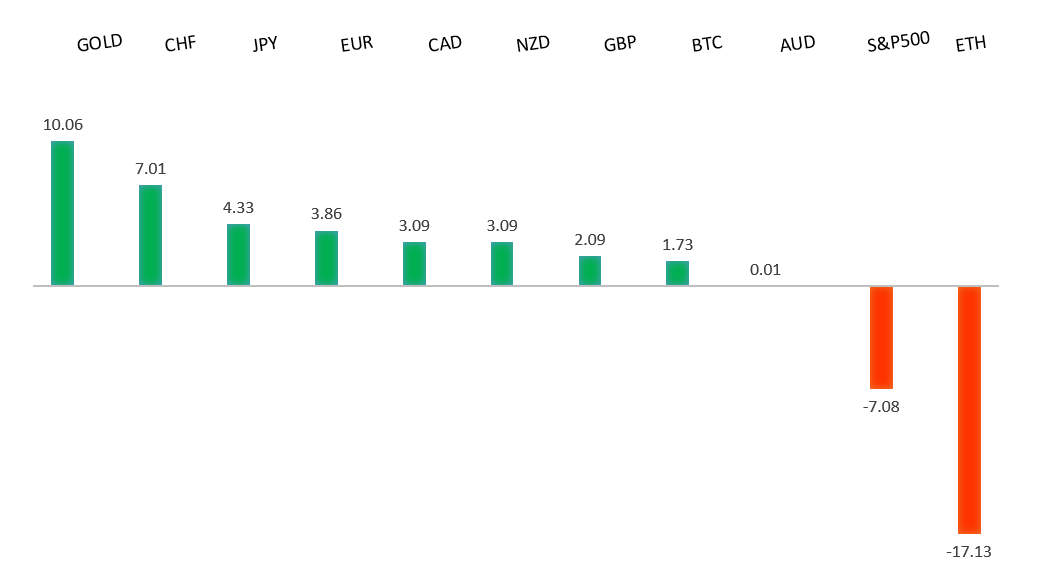
Performance chart 30day v. USD (%)
Performance Chart
 
 
Technical & fundamental highlights
EURUSD: technical overview

The Euro has finally broken out from a multi-month consolidation off a critical longer-term low. This latest push through the 2023 high lends further support to the case for a meaningful bottom, setting the stage for a bullish structural shift and the next major upside extension targeting the 2021 high at 1.2350. Setbacks should be exceptionally well supported below 1.1000.

EURUSD Chart
R2 1.1600 - Figure - Medium
R1 1.1533 - 21 April/2025 high - Strong
S1 1.1335 - 17 April low - Medium
S2 1.1264 - 15 April low - Strong
EURUSD: fundamental overview

The shifting landscape amidst a more unpredictable set of policies from the US administration has forced a major reconsideration of the US Dollar as the choice currency. Chinese investors are shifting from US Treasuries to European bonds, particularly German, Spanish, and Italian debt, while global asset managers like Vanguard and Citigroup favor European bonds, expecting ECB rate cuts and improved fiscal conditions.

 
USDJPY: technical overview

There are signs of a meaningful top in place after the market put in a multi-year high in 2024. At this point, the door is now open for a deeper setback to the 2024 low at 139.58 over the coming sessions.

USDJPY Chart
R2 143.60 - 15 April high - Medium
R1 142.11 - 21 April high - Medium
S1 140.62 - 21 April/2025 low - Medium
S2 140.00 - Psychological - Strong
USDJPY: fundamental overview

Japan’s March CPI data indicates persistent inflation, with core CPI rising 3.2% year-on-year, exceeding the Bank of Japan’s 2% target for nearly three years. This reinforces the central bank’s overall hawkish stance, though the BOJ is expected to cautiously pause rate hikes due to economic pressures from U.S. tariffs on Japanese goods. U.S.-Japan trade talks are progressing, with Japan aiming for favorable tariff exemptions, potentially sparking a relief rally in risk assets and impacting yen long positions, while a second round of discussions on April 24 may address currency issues amid U.S. accusations of yen weakening. Speculative net long yen positions have surged to 171,855 contracts, and a major Japanese bank has lowered its year-end dollar forecast to 137.50, citing concerns over U.S. stagflation and asset credibility.

 
AUDUSD: technical overview

There are signs of the potential formation of a longer-term base with the market trading down into a meaningful longer-term support zone. Only a monthly close below 0.5500 would give reason for rethink. A monthly close back above 0.7000 will take the big picture pressure off the downside and strengthen case for a bottom.

AUDUSD Chart
R2 0.6500 - Psychological - Strong
R1 0.6427 - 21 April/2025 high - Medium
S1 0.6333 - 17 April low - Medium
S1 0.6275 - 14 April low - Strong
AUDUSD: fundamental overview

The Australian Dollar has been performing well of late, potentially signaling a bottoming process for AUD/USD amid a shift away from USD assets and possible Chinese policy support against U.S. tariffs. Despite a robust Australian labor market with a March unemployment rate of 4.1%, the Reserve Bank of Australia is expected to cut rates in May, as markets anticipate economic growth concerns will outweigh inflation risks, with the RBA’s April meeting minutes indicating a cautious approach to policy adjustments. The U.S.-China trade tensions have weighed more heavily on the U.S. dollar than Aussie, positioning the dollar as a new risk currency, while markets await further Australian economic data to confirm the RBA’s rate cut decision at the May 19-20 meeting.

 
Suggested reading

Are we on the brink of a nuclear revival?, P. Clark, Financial Times (April 17, 2025)

Trade War May Have Supercharged AI Development, L. Lango, InvestorPlace (April 17, 2025)


Any opinions, news, research, analyses, prices or other information ("information") contained on this Blog, constitutes marketing communication and it has not been prepared in accordance with legal requirements designed to promote the independence of investment research. Further, the information contained within this Blog does not contain (and should not be construed as containing) investment advice or an investment recommendation, or an offer of, or solicitation for, a transaction in any financial instrument. LMAX Group has not verified the accuracy or basis-in-fact of any claim or statement made by any third parties as comments for every Blog entry.

LMAX Group will not accept liability for any loss or damage, including without limitation to, any loss of profit, which may arise directly or indirectly from use of or reliance on such information. No representation or warranty is given as to the accuracy or completeness of the above information. While the produced information was obtained from sources deemed to be reliable, LMAX Group does not provide any guarantees about the reliability of such sources. Consequently any person acting on it does so entirely at his or her own risk. It is not a place to slander, use unacceptable language or to promote LMAX Group or any other FX and CFD provider and any such postings, excessive or unjust comments and attacks will not be allowed and will be removed from the site immediately.

Day Image
18th April 2025 | view in browser
Easter slowdown hits markets

Trading conditions have thinned out into the end of the week with many market participants off the desks for the Easter weekend. As we come into Friday, things look relatively stable in the aftermath of the ECB decision to cut rates by another 25 basis points, bringing rates to a 2-year low.


Performance chart 30day v. USD (%)
Performance Chart
 
 
Technical & fundamental highlights
EURUSD: technical overview

The Euro has finally broken out from a multi-month consolidation off a critical longer-term low. This latest push through the 2023 high lends further support to the case for a meaningful bottom, setting the stage for a bullish structural shift and the next major upside extension targeting the 2021 high at 1.2350. Setbacks should be exceptionally well supported below 1.1000.

EURUSD Chart
R2 1.1496 - 2022 high - Strong
R1 1.1474 - 11 April/2025 high - Strong
S1 1.1181 - 11 April low - Medium
S2 1.1000 - Psychological - Strong
EURUSD: fundamental overview

The Euro came under mild pressure after the European Central Bank (ECB) cut interest rates by a quarter point, marking their seventh rate reduction in eight meetings, bringing rates to a two-year low. ECB President Lagarde said the cut was unanimous, with no support for a larger 50-basis-point reduction, while also highlighting “exceptional uncertainty” in the economy due to escalating trade tensions. Lagarde went on to add that the full impact of tariffs wouldn’t be clear by the June meeting, indicating a cautious approach to future policy decisions. Looking ahead, there is no first tier risk on the calendar for the remainder of the day, leaving all of the focus on the bigger picture stories.


USDJPY: technical overview

There are signs of a meaningful top in place after the market put in a multi-year high in 2024. At this point, the door is now open for a deeper setback towards the 140 area over the coming sessions.

USDJPY Chart
R2 146.54 - 11 March low - Strong
R1 144.58 - 11 April high - Medium
S1 141.61 - 17 April/2025 low - Medium
S2 140.00 - Psychological - Strong
USDJPY: fundamental overview

Then Yen has reconsidered the latest run of gains from optimism around progress on trade between Japan and the United States. This follows Japanese trade representative Akazawa’s comment that the Yen didn’t get any mention during the ongoing talks. On the data front, Japan inflation data didn’t inspire much volatility after coming in as expected on the whole. Looking ahead, there is no first tier risk on the calendar for the remainder of the day, leaving all of the focus on the bigger picture stories.


AUDUSD: technical overview

There are signs of the potential formation of a longer-term base with the market trading down into a meaningful longer-term support zone. Only a monthly close below 0.5500 would give reason for rethink. A monthly close back above 0.7000 will take the big picture pressure off the downside and strengthen case for a bottom.

AUDUSD Chart
R2 0.6409 - 21 February/2025 high - Strong
R1 0.6394 - 17 April high - Medium
S1 0.6181 - 11 April low - Medium
S1 0.6115 - 10 April low - Medium
AUDUSD: fundamental overview

The Australian Dollar looks set to close out the week near the highs on the back of encouraging comments from China’s He Lifeng which point to a possible trade dialogue with the United States. Looking ahead, there is no first tier risk on the calendar for the remainder of the day, leaving all of the focus on the bigger picture stories.


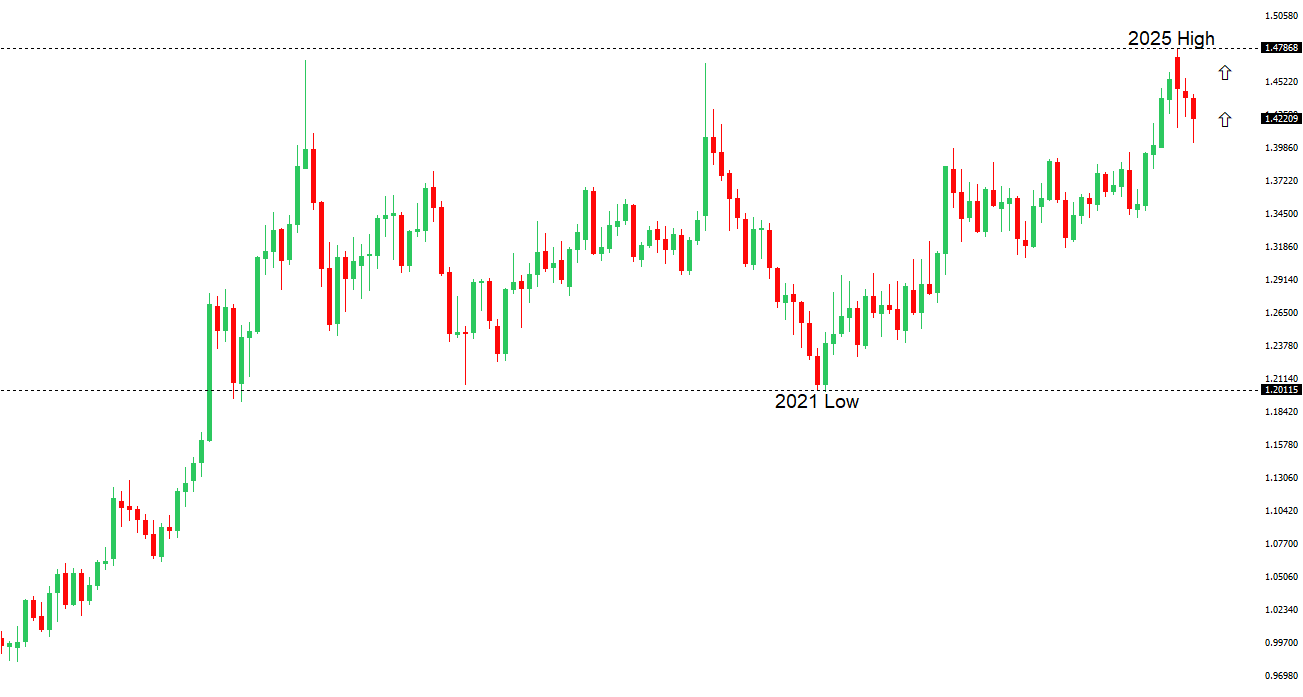
USDCAD: technical overview

A sustained upside pressure over the past several months signals an end to a period of longer-term bearish consolidation and suggests the market is in the process of carving out a more significant longer-term base. Next key resistance now comes in at the 1.5000 psychological barrier. Setbacks should be very well supported ahead of 1.3500.

USDCAD Chart
R2 1.4297 - 7 April high - Strong
R1 1.4111 - 10 April high - Medium
S1 1.3828 - 14 April/2025 low - Medium
S2 1.3817 - 6 November low - Medium
USDCAD: fundamental overview

The Canadian Dollar has retained a bid tone into the end of the week, getting its latest boost from a surge in the price of oil on the back of the news out of the Financial Times that China is helping the Houthis target US ships. Looking ahead, there is no first tier risk on the calendar for the remainder of the day, leaving all of the focus on the bigger picture stories.


Suggested reading

Jamie Dimon urges US to engage with China, R. Khalaf, Financial Times (April 15, 2025)

Risk, Not Volatility, Is the Real Enemy for Investors, C. Benz, Morningstar (April 16, 2025)


Any opinions, news, research, analyses, prices or other information ("information") contained on this Blog, constitutes marketing communication and it has not been prepared in accordance with legal requirements designed to promote the independence of investment research. Further, the information contained within this Blog does not contain (and should not be construed as containing) investment advice or an investment recommendation, or an offer of, or solicitation for, a transaction in any financial instrument. LMAX Group has not verified the accuracy or basis-in-fact of any claim or statement made by any third parties as comments for every Blog entry.

LMAX Group will not accept liability for any loss or damage, including without limitation to, any loss of profit, which may arise directly or indirectly from use of or reliance on such information. No representation or warranty is given as to the accuracy or completeness of the above information. While the produced information was obtained from sources deemed to be reliable, LMAX Group does not provide any guarantees about the reliability of such sources. Consequently any person acting on it does so entirely at his or her own risk. It is not a place to slander, use unacceptable language or to promote LMAX Group or any other FX and CFD provider and any such postings, excessive or unjust comments and attacks will not be allowed and will be removed from the site immediately.

Day Image
15th April 2025 | view in browser
Safe-haven currencies gain in uncertain trade landscape

Financial markets continue to navigate a complex landscape shaped by evolving US trade policies and global economic dynamics. US Dollar weakness is at the center of everything as investors reconsider the Buck’s safe-haven status in a world of trade wars.


Performance chart 30day v. USD (%)
Performance Chart
 
 
Technical & fundamental highlights
EURUSD: technical overview

The Euro has finally broken out from a multi-month consolidation off a critical longer-term low. This latest push through the 2023 high lends further support to the case for a meaningful bottom, setting the stage for a bullish structural shift and the next major upside extension targeting the 2021 high at 1.2350. Setbacks should be exceptionally well supported below 1.1000.

EURUSD Chart
R2 1.1496 - 2022 high - Strong
R1 1.1474 - 11 April/2025 high - Strong
S1 1.1181 - 11 April low - Medium
S2 1.1000 - Psychological - Strong
EURUSD: fundamental overview
German 10-year yields have softened since their March peak of 2.93%, despite expectations of increased fiscal spending, as investors shift from US assets to safe-haven options like the Euro and German bunds, amid a weakening US Dollar treated like an emerging market currency. The ECB is expected to cut rates by 25bps on April 17 due to US tariffs impacting Eurozone demand, with markets pricing in 79 basis points of cuts for 2025, while the EU seeks to diversify trade partnerships to counter long-term US policy shifts. Euro Area growth is forecasted at 0.8% for 2025, with a 40% recession risk, and upcoming data like the April ZEW Survey and February Industrial Production may signal further economic challenges. Key standouts on today’s calendar come from German wholesale prices, UK employment, Eurozone industrial production, German and Eurozone ZEW reads, Canada inflation, US import and export prices, Empire manufacturing, and Fed speak.
 
GBPUSD: technical overview

Signs have emerged of the market wanting to put in a longer-term base after collapsing to a record low in September 2022. The door is now open for the next major upside extension towards the 2018 high at 1.4377. Setbacks should be well supported above 1.2000 on a monthly close basis.

GBPUSD Chart
R2 1.3266 - 27 August high - Strong
R1 1.3218 - 15 April high - Medium
S1 1.3063 - 14 April low - Medium
S2 1.2965 - 11 April low - Medium
GBPUSD: fundamental overview
The Pound has been bolstered against the US Dollar in the past 24 hours, trading to a fresh yearly high, primarily on the back of uncertainties surrounding US trade policies, particularly President Trump’s temporary exemption of tariffs on certain Chinese goods. Robust UK economic indicators have also supported the Pound’s rise, as investors view it as a hedge amid US market volatility. Additionally, the Bank of England’s monetary policy stance continues to influence the UK currency, with market expectations leaning toward potential rate stability or hikes in late 2025. Key standouts on today’s calendar come from German wholesale prices, UK employment, Eurozone industrial production, German and Eurozone ZEW reads, Canada inflation, US import and export prices, Empire manufacturing, and Fed speak.
 
USDJPY: technical overview

There are signs of a meaningful top in place after the market put in a multi-year high in 2024. At this point, the door is now open for a deeper setback towards the 140 area over the coming sessions.

USDJPY Chart
R2 146.54 - 11 March low - Strong
R1 144.58 - 11 April high - Medium
S1 142.06 - 11 April/2025 low - Medium
S2 141.64 - 30 September low - Medium
USDJPY: fundamental overview

Then Yen continues to be a beneficiary of US-China trade tensions. Japan’s Prime Minister Ishiba highlighted the disruptive potential of US tariffs, signaling readiness for economic measures like a possible supplementary budget, while upcoming US-Japan trade talks on April 17 could pressure the Bank of Japan to raise rates if linked to Yen weakness and trade imbalances. Speculative JPY long positions have spiked, and a favorable deal for Japan could spark a risk asset rally, while narrowing US-Japan yield differentials may further strengthen the Yen if the Federal Reserve cuts rates. Key standouts on today’s calendar come from German wholesale prices, UK employment, Eurozone industrial production, German and Eurozone ZEW reads, Canada inflation, US import and export prices, Empire manufacturing, and Fed speak.


AUDUSD: technical overview

There are signs of the potential formation of a longer-term base with the market trading down into a meaningful longer-term support zone. Only a monthly close below 0.5500 would give reason for rethink. A monthly close back above 0.7000 will take the big picture pressure off the downside and strengthen case for a bottom.

AUDUSD Chart
R2 0.6409 - 21 February/2025 high - Strong
R1 0.6389 - 3 April high - Medium
S1 0.6181 - 11 April low - Medium
S1 0.6115 - 10 April low - Medium
AUDUSD: fundamental overview
The Australian Dollar has been propped up by China’s stable yuan fixing, as it helps to build on expectations for a moderate weakening rather than a sharp devaluation. Despite market anticipation of an RBA rate cut in May, driven by economic growth concerns outweighing inflation risks, some strategists see the Australian Dollar bottoming out, supported by China’s expected economic shielding measures and a broader shift away from US Dollar assets. Key standouts on today’s calendar come from German wholesale prices, UK employment, Eurozone industrial production, German and Eurozone ZEW reads, Canada inflation, US import and export prices, Empire manufacturing, and Fed speak.
 
Suggested reading

No Such Thing As ‘Adjusting’ The Gold Price To ‘Inflation’, J. Tamny, Forbes (April 13, 2025)

On Treasurys’ Post-Tariff Ride, Fisher Investments (April 11, 2025)


Any opinions, news, research, analyses, prices or other information ("information") contained on this Blog, constitutes marketing communication and it has not been prepared in accordance with legal requirements designed to promote the independence of investment research. Further, the information contained within this Blog does not contain (and should not be construed as containing) investment advice or an investment recommendation, or an offer of, or solicitation for, a transaction in any financial instrument. LMAX Group has not verified the accuracy or basis-in-fact of any claim or statement made by any third parties as comments for every Blog entry.

LMAX Group will not accept liability for any loss or damage, including without limitation to, any loss of profit, which may arise directly or indirectly from use of or reliance on such information. No representation or warranty is given as to the accuracy or completeness of the above information. While the produced information was obtained from sources deemed to be reliable, LMAX Group does not provide any guarantees about the reliability of such sources. Consequently any person acting on it does so entirely at his or her own risk. It is not a place to slander, use unacceptable language or to promote LMAX Group or any other FX and CFD provider and any such postings, excessive or unjust comments and attacks will not be allowed and will be removed from the site immediately.

Day Image
14th April 2025 | view in browser
De-escalation sparks rally, Dollar falters

Risk appetite has recovered for now, though the 90-day pause on reciprocal tariffs is still viewed as a tactical move to alleviate intense market stress rather than signaling a shift from the U.S. administration’s “America First” stance.


Performance chart 30day v. USD (%)
Performance Chart
 
 
Technical & fundamental highlights
EURUSD: technical overview

The Euro has finally broken out from a multi-month consolidation off a critical longer-term low. This latest push through the 2023 high lends further support to the case for a meaningful bottom, setting the stage for a bullish structural shift and the next major upside extension targeting the 2021 high at 1.2350. Setbacks should be exceptionally well supported below 1.1000.

EURUSD Chart
R2 1.1496 - 2022 high - Strong - S1 1.1181 - 11 April low - Medium
R1 1.1474 - 11 April/2025 high - Strong - S2 1.1000 - Psychological - Strong
EURUSD: fundamental overview

The Euro has resumed its uptrend, extending to a three-year peak at 1.1474. The single currency is gaining as a haven asset amid a flight from U.S. assets, while the dollar’s yield advantage weakens, diverging from the German 10-year and U.S. 10-year yield spread. Meanwhile, the EU’s pause on U.S. tariffs and pursuit of diversified trade partnerships signal a strategic shift amid U.S. policy uncertainty. The ECB is expected to cut rates by 25 basis points on April 17, with markets pricing in 78bps of cuts this year, reflecting disinflationary pressures from U.S. tariffs. Key standouts on Monday’s calendar come from US consumer inflation expectations and Fed speak.

 
GBPUSD: technical overview

Signs have emerged of the market wanting to put in a longer-term base after collapsing to a record low in September 2022. The door is now open for the next major upside extension towards the 2018 high at 1.4377. Setbacks should be well supported above 1.2000 on a monthly close basis.

GBPUSD Chart
R2 1.3208 - 3 April/2025 high - Strong - S1 1.2965 - 11 April low - Medium
R1 1.3145 - 11 April high - Medium - S2 1.2795 - 10 April low - Medium
GBPUSD: fundamental overview

The Pound remains in demand, driven by broad based US Dollar selling and robust UK economic data. The latest round of impressive UK data includes a 0.5% month-on-month GDP increase, reversing a prior 0.1% decline. Meanwhile, industrial production surged to 1.5% from -0.9%, and manufacturing hit a 2022 peak at 2.2%, up from -1.1%, signaling strong economic momentum. Key standouts on Monday’s calendar come from US consumer inflation expectations and Fed speak.

 
USDJPY: technical overview

There are signs of a meaningful top in place after the market put in a multi-year high in 2024. At this point, the door is now open for a deeper setback towards the 140 area over the coming sessions.

USDJPY Chart
R2 146.54 - 11 March low - Strong - S1 142.06 - 11 April/2025 low - Medium
R1 144.58 - 11 April high - Medium - S2 141.64 - 30 September low - Medium
USDJPY: fundamental overview

Then Yen has emerged as a top-performing G10 currency, driven by safe-haven demand amid escalating U.S.-China trade tensions. Japanese household inflation expectations have surged to a 9.6% average over the next five years, the highest since June 2006, potentially reviving BOJ rate hike expectations if U.S.-Japan trade talks on April 17, involving U.S. Treasury Secretary Scott Bessent and Trade Representative Jamieson Greer, lead to pressure for a stronger yen to address trade imbalances. Markets may increase yen longs ahead of the talks, anticipating Japan could secure a favorable deal, especially as OIS markets currently expect a BOJ rate hike pause but could shift if tariff negotiations spotlight the yen. Key standouts on Monday’s calendar come from US consumer inflation expectations and Fed speak.

 
AUDUSD: technical overview

There are signs of the potential formation of a longer-term base with the market trading down into a meaningful longer-term support zone. Only a monthly close below 0.5500 would give reason for rethink. A monthly close back above 0.7000 will take the big picture pressure off the downside and strengthen case for a bottom.

AUDUSD Chart
R2 0.6332 - 4 April high - Medium - S1 0.6115 - 10 April low - Medium
R1 0.6315 - 14 April high - Medium - S2 0.5914 - 9 April/2025 low - Strong
AUDUSD: fundamental overview

The Australian dollar faces headwinds as a yuan proxy amid U.S.-China trade tensions, with the yuan fixing at its weakest since September 2023. Many analysts expect China to avoid a sharp devaluation, prioritizing global stability, reducing the likelihood of revisiting its COVID-era low of 0.5510. RBA Governor Bullock has resisted pressure for a 50bps rate cut in May, citing the need to assess global demand and supply impacts from U.S. tariffs, but OIS markets still price in a certain cut, driven by economic growth concerns outweighing inflation risks, as seen in past crises. Contrarian strategists argue the Australian Dollar may be oversold, with China’s potential stimulus expansion expected to be discussed Thursday, likely to boost demand for Australian commodities, while the RBA remains cautiously optimistic about China’s infrastructure and monetary measures offsetting trade war effects. Key standouts on Monday’s calendar come from US consumer inflation expectations and Fed speak.

 
Suggested reading

U.S. and China Wrestling for Global Leadership, M. Vassalou, Barron’s (April 11, 2025)

US would be better off without the global dollar, M. Pettis, Financial Times (April 11, 2025)


Any opinions, news, research, analyses, prices or other information ("information") contained on this Blog, constitutes marketing communication and it has not been prepared in accordance with legal requirements designed to promote the independence of investment research. Further, the information contained within this Blog does not contain (and should not be construed as containing) investment advice or an investment recommendation, or an offer of, or solicitation for, a transaction in any financial instrument. LMAX Group has not verified the accuracy or basis-in-fact of any claim or statement made by any third parties as comments for every Blog entry.

LMAX Group will not accept liability for any loss or damage, including without limitation to, any loss of profit, which may arise directly or indirectly from use of or reliance on such information. No representation or warranty is given as to the accuracy or completeness of the above information. While the produced information was obtained from sources deemed to be reliable, LMAX Group does not provide any guarantees about the reliability of such sources. Consequently any person acting on it does so entirely at his or her own risk. It is not a place to slander, use unacceptable language or to promote LMAX Group or any other FX and CFD provider and any such postings, excessive or unjust comments and attacks will not be allowed and will be removed from the site immediately.

Day Image
11th April 2025 | view in browser
Euro becoming currency of choice

The US-China trade war has intensified with tariffs on China now at 145%. President Trump has threatened to impose reciprocal tariffs on up to 70 countries within three months if trade deals aren’t reached, creating significant policy uncertainty that markets dread, especially given the complexity and time typically required for such negotiations.


Performance chart 30day v. USD (%)
Performance Chart
 
 
Technical & fundamental highlights
EURUSD: technical overview

The Euro has finally broken out from a multi-month consolidation off a critical longer-term low. This latest push through the 2023 high lends further support to the case for a meaningful bottom, setting the stage for a bullish structural shift and the next major upside extension targeting the 2021 high at 1.2350. Setbacks should be exceptionally well supported below 1.1000.

EURUSD Chart
R2 1.1400 - Figure - Medium - S1 1.1181 - 11 April low - Medium
R1 1.1385 - 11 April/2025 high - Strong - S2 1.1000 - Psychological - Strong
EURUSD: fundamental overview

EU Commission President Ursula von der Leyen has suspended planned tariffs on US products for 90 days, following a US call for a pause on reciprocal tariffs, to allow time for negotiations. Friedrich Merz, Germany’s likely next chancellor, supports dialogue but stresses the EU’s readiness to protect its interests, noting that Trump’s unpredictable approach has created uncertainty and criticism in the US. Bloomberg economists predict a 25bps ECB rate cut on April 17, expecting US tariffs to reduce euro area demand and inflation, with markets anticipating 75bps in cuts over the year. Key standouts on Friday’s calendar come from German inflation data, UK GDP, trade, industrial production, construction output, an ECB Lagarde speech, US producer prices, Michigan sentiment, and Fed speak.

 
USDJPY: technical overview

There are signs of a meaningful top in place after the market put in a multi-year high in 2024. At this point, the door is now open for a deeper setback towards the 140 area over the coming sessions.

USDJPY Chart
R2 146.54 - 11 March low - Strong - S1 142.88 - 11 April/2025 low - Medium
R1 144.58 - 11 April high - Medium - S2 141.64 - 30 September low - Medium
USDJPY: fundamental overview

Then Yen has extended its run against the US Dollar amid escalating US-China trade tensions. The US Trade Secretary attributed Yen strength to Japan’s robust economic growth and inflation expectations, suggesting BOJ rate hikes are natural. Japan faces potential US pressure to raise rates in upcoming trade talks to address Yen weakness and trade imbalances, with markets pricing in minimal BOJ hikes but higher odds if tariffs are moderated. Recent strong Japan PPI data (4.2% YoY vs. 3.9% forecast) supports rate hike speculation. Japan’s strategic importance and Trump’s appointment of key negotiators could lead to lenient tariff terms, with traders eyeing more Yen gains if a favorable deal emerges. Key standouts on Friday’s calendar come from German inflation data, UK GDP, trade, industrial production, construction output, an ECB Lagarde speech, US producer prices, Michigan sentiment, and Fed speak.

 
AUDUSD: technical overview

There are signs of the potential formation of a longer-term base with the market trading down into a meaningful longer-term support zone. Only a monthly close below 0.5500 would give reason for rethink. A monthly close back above 0.7000 will take the big picture pressure off the downside and strengthen case for a bottom.

AUDUSD Chart
R2 0.6332 - 4 April high - Medium - S1 0.6115 - 10 April low - Medium
R1 0.6259 - 11 April high - Medium - S2 0.5914 - 9 April/2025 low - Strong
AUDUSD: fundamental overview

The Australian dollar has benefited from broad based currency demand but faces pressure as a risk-sensitive currency amid ongoing US tariffs on China, Australia’s key trading partner. But at least for now, fears of revisiting its COVID-era low of 0.5510 have eased. The yuan’s stable fixing at 7.2087 signals China’s intent to avoid sharp devaluation, prioritizing global stability over tariff countermeasures. Meanwhile, RBA Governor Bullock has resisted calls for a 50 basis point rate cut in May, emphasizing a cautious approach to US tariff impacts and noting Australia’s resilient financial system, with market volatility expected but economic fallout limited compared to 2008. Key standouts on Friday’s calendar come from German inflation data, UK GDP, trade, industrial production, construction output, an ECB Lagarde speech, US producer prices, Michigan sentiment, and Fed speak.

 
USDCAD: technical overview

A sustained upside pressure over the past several months signals an end to a period of longer-term bearish consolidation and suggests the market is in the process of carving out a more significant longer-term base. Next key resistance now comes in at the 1.5000 psychological barrier. Setbacks should be very well supported ahead of 1.3500.

USDCAD Chart
R2 1.4297 - 7 April high - Strong - S1 1.3908 - 11 April/2025 low - Medium
R1 1.4111 - 10 April high - Medium - S2 1.3817 - 6 November low - Medium
USDCAD: fundamental overview

We’ve seen a surge in demand for the Canadian Dollar on the back of President Trump’s 90-day tariff pause. The resulting development has translated to broad based risk on flow and concurrent surge in the price of oil. Meanwhile, PM Carney has been helping the Canadian Dollar this week as well, after pledging to make Canada an energy superpower. Key standouts on Friday’s calendar come from German inflation data, UK GDP, trade, industrial production, construction output, an ECB Lagarde speech, US producer prices, Michigan sentiment, and Fed speak.

 
Suggested reading

Which US Stocks Are Most at Risk From Tariffs?, I. Pontikis, Morningstar (April 10, 2025)

An apology to the bond vigilantes, A. Scaggs, Financial Times (April 9, 2025)


Any opinions, news, research, analyses, prices or other information ("information") contained on this Blog, constitutes marketing communication and it has not been prepared in accordance with legal requirements designed to promote the independence of investment research. Further, the information contained within this Blog does not contain (and should not be construed as containing) investment advice or an investment recommendation, or an offer of, or solicitation for, a transaction in any financial instrument. LMAX Group has not verified the accuracy or basis-in-fact of any claim or statement made by any third parties as comments for every Blog entry.

LMAX Group will not accept liability for any loss or damage, including without limitation to, any loss of profit, which may arise directly or indirectly from use of or reliance on such information. No representation or warranty is given as to the accuracy or completeness of the above information. While the produced information was obtained from sources deemed to be reliable, LMAX Group does not provide any guarantees about the reliability of such sources. Consequently any person acting on it does so entirely at his or her own risk. It is not a place to slander, use unacceptable language or to promote LMAX Group or any other FX and CFD provider and any such postings, excessive or unjust comments and attacks will not be allowed and will be removed from the site immediately.

Day Image
10th April 2025 | view in browser
Trump’s tariff timeout boosts markets

The financial strain on global markets was getting to be a little too much following the 100%+ US levy on China and China’s retaliatory 34% and 50% tariffs on US goods. And so finally, on Wednesday, President Trump cooled things down after announcing a 90-day pause on reciprocal tariffs.


Performance chart 30day v. USD (%)
Performance Chart
 
 
Technical & fundamental highlights
EURUSD: technical overview

The Euro has been in a multi-month consolidation since bottoming out in 2022. Setbacks have since been exceptionally well supported on dips towards parity, with a higher platform sought out ahead of the next major upside extension. Look for a push back towards the 2023 high at 1.1276 in the days ahead. Only a monthly close below 1.0000 negates.

EURUSD Chart
R2 1.1148 - 3 April/2025 high - Strong - S1 1.0880 - 7 April low - Medium
R1 1.1108 - 4 April high - Medium - S2 1.0733 - 27 March low - Strong
EURUSD: fundamental overview

ECB Villeroy cautiously welcomed President Trump’s 90-day tariff pause but noted US unpredictability still hampered the growth outlook. Meanwhile, BNP Paribas’ chief economist urged the EU to focus on domestic growth via single-market investments rather than retaliation. ECB Holzmann suggested pausing rate cuts in April due to trade uncertainty, despite markets expecting a cut. And a UK-EU defense pact eyes a May 19 completion date to bolster European security amid US policy shifts. Finally, ECB Cipollone was out pushing for digital euro and cash regulations to reduce reliance on foreign payment firms. As far as today’s economic calendar goes, key standouts come from US initial jobless claims and inflation data.

 
USDJPY: technical overview

There are signs of a meaningful top in place after the market put in a multi-year high in 2024. At this point, the door is now open for a deeper setback towards the 140 area.

USDJPY Chart
R2 148.28 - 9 April high - Strong - S1 145.96 - 8 April low - Medium
R1 147.88 - 10 April high - Medium - S2 144.00 - 9 April/2025 low - Strong
USDJPY: fundamental overview

President Trump’s erratic tariff policies have undermined the dollar’s safe-haven status, boosting the Yen as a consequence. Japan PM Ishiba aims to leverage Trump’s pause on reciprocal tariffs to negotiate better terms on steel and auto levies, banking on Japan’s strategic alliance and investment in the US, with key appointees Bessent and Greer leading talks. Bloomberg Economics has warned that if the 24% tariffs and 25% auto levy resume, Japan’s GDP could drop by 0.9%, while OIS markets now see little chance of rate hikes this year. As far as today’s economic calendar goes, key standouts come from US initial jobless claims and inflation data.

 
AUDUSD: technical overview

There are signs of the potential formation of a longer-term base with the market trading down into a meaningful longer-term support zone. Only a monthly close below 0.5500 would give reason for rethink. A monthly close back above 0.7000 will take the big picture pressure off the downside and strengthen case for a bottom.

AUDUSD Chart
R2 0.6332 - 4 April high - Medium - S1 0.6100 - Figure - Medium
R1 0.6219 - 31 March low - Medium - S2 0.5914 - 9 April/2025 low - Strong
AUDUSD: fundamental overview

The Australian Dollar rebounded from a year-to-date low after President Trump’s tariff pause eased risk aversion. Despite levies persisting on China, and Trump’s unpredictable tariff stance, the risk of deeper setbacks in 2025 has eased for now. In fact, there have been some strategists making a bullish case for the Australian Dollar, citing China’s stimulus boosting commodity demand and US economic self-harm from tariffs. There is support for this view via CME data showing call options doubling puts. Meanwhile, Treasurer Chalmers has convened top economic leaders to mitigate global volatility. Speculation has been growing for a potential 50 basis point RBA cut in May. As far as today’s economic calendar goes, key standouts come from US initial jobless claims and inflation data.

 
USDCAD: technical overview

A sustained hold above 1.3000 over the past several months signals an end to a period of longer-term bearish consolidation and suggests the market is in the process of carving out a more significant longer-term base. Next key resistance now comes in at the 1.5000 psychological barrier. Setbacks should be very well supported ahead of 1.3500.

USDCAD Chart
R2 1.4297 - 7 April high - Strong - S1 1.4054 - 4 April low - Medium
R1 1.4143 - 8 April low - Medium - S2 1.4027 - 3 April/2025 low - Strong
USDCAD: fundamental overview

We’ve seen a surge in demand for the Canadian Dollar on the back of President Trump’s 90-day tariff pause. The resulting development has translated to broad based risk on flow and concurrent surge in the price of oil. Meanwhile, PM Carney has been helping the Canadian Dollar as well, after pledging to make Canada an energy superpower. As far as today’s economic calendar goes, key standouts come from Canada building permits, US initial jobless claims and US inflation data.

 
Suggested reading

Why The Dollar Will Keep Falling, V. Katsenelson, The Intellectual Investor (April 7, 2025)

Bear Markets and Bad Decisions, J. Wiggins, Behavioral Investment (April 8, 2025)


Any opinions, news, research, analyses, prices or other information ("information") contained on this Blog, constitutes marketing communication and it has not been prepared in accordance with legal requirements designed to promote the independence of investment research. Further, the information contained within this Blog does not contain (and should not be construed as containing) investment advice or an investment recommendation, or an offer of, or solicitation for, a transaction in any financial instrument. LMAX Group has not verified the accuracy or basis-in-fact of any claim or statement made by any third parties as comments for every Blog entry.

LMAX Group will not accept liability for any loss or damage, including without limitation to, any loss of profit, which may arise directly or indirectly from use of or reliance on such information. No representation or warranty is given as to the accuracy or completeness of the above information. While the produced information was obtained from sources deemed to be reliable, LMAX Group does not provide any guarantees about the reliability of such sources. Consequently any person acting on it does so entirely at his or her own risk. It is not a place to slander, use unacceptable language or to promote LMAX Group or any other FX and CFD provider and any such postings, excessive or unjust comments and attacks will not be allowed and will be removed from the site immediately.

Day Image
9th April 2025 | view in browser
Tariffs, turmoil, and trades

US equities, Treasuries, and the US dollar have all come under added pressure as worry around the outlook for the US economy and status of the US as a safe haven is called into question amidst all the turmoil around tariffs and trade wars.


Performance chart 30day v. USD (%)
Performance Chart
 
 
Technical & fundamental highlights
EURUSD: technical overview

The Euro has been in a multi-month consolidation since bottoming out in 2022. Setbacks have since been exceptionally well supported on dips towards parity, with a higher platform sought out ahead of the next major upside extension. Look for a push back towards the 2023 high at 1.1276 in the days ahead. Only a monthly close below 1.0000 negates.

EURUSD Chart
R2 1.1148 - 3 April/2025 high - Strong - S1 1.0880 - 7 April low - Medium
R1 1.1108 - 4 April high - Medium - S2 1.0733 - 27 March low - Strong
EURUSD: fundamental overview

The Euro continues to be a beneficiary of all of the turmoil around US trade tariffs, with market participants opting to find comfort in the single currency amidst President Trump’s 104% China tariff confirmation. The EU is preparing to counter President Trump’s 25% tariffs on steel and aluminum with levies next week, followed by a second phase addressing US tariffs on auto exports. Meanwhile, the ECB is expected to cut rates consecutively to 1.5%. Looking ahead, key standouts on the calendar come from ECB speak, Fed speak, and the Fed Minutes late in the day.

 
GBPUSD: technical overview

Signs have emerged of the market wanting to put in a longer-term base after collapsing to a record low in September 2022. The door is now open for the next major upside extension towards the 2018 high at 1.4377. Setbacks should be well supported above 1.2000 on a monthly close basis.

GBPUSD Chart
R2 1.3208 - 3 April/2025 high - Strong - S1 1.2708 - 7 April low - Medium
R1 1.2934 - 7 April high - Medium - S2 1.2679 - 4 March low - Medium
GBPUSD: fundamental overview

The Pound has been a beneficiary of fallout from the US Dollar on the back of unpredictability and uncertainty around the outlook for the US economy amidst an intense round of tariffs and escalation in trade tension. PM Starmer’s maintenance of a pragmatic, all hands on deck approach to negotiations with the US has also served to keep the Pound well supported into dips. Looking ahead, key standouts on the calendar come from ECB speak, Fed speak, and the Fed Minutes late in the day.

 
USDJPY: technical overview

There are signs of a meaningful top in place after the market put in a multi-year high in 2024. At this point, the door is now open for a deeper setback towards the 140 area.

USDJPY Chart
R2 148.15 - 7 April high - Strong - S1 144.55 - 4 April/2025 low - Medium
R1 146.35 - 9 April high - Medium - S2 144.00 - Figure - Medium
USDJPY: fundamental overview

Following a call with President Trump, Japanese PM Ishiba secured Japan a spot on the “priority” list among roughly 70 countries vying to negotiate US tariffs, despite his concerns about their alignment with WTO and Japan-USA. trade agreements. President Trump’s appointment of Treasury Secretary Bessent and Trade Representative Greer to lead talks signals a potentially favorable and swift resolution for Japan, leveraging its role as a key US. ally and top investor, with hopes of milder tariff terms and discussions possibly involving a stronger yen. OIS markets are now expecting just 10 basis points of BOJ rate hikes for the year, largely dismissing earlier rate hike bets amid the tariff fallout. Looking ahead, key standouts on the calendar come from ECB speak, Fed speak, and the Fed Minutes late in the day.

 
AUDUSD: technical overview

There are signs of the potential formation of a longer-term base with the market trading down into a meaningful longer-term support zone. Only a monthly close below 0.5500 would give reason for rethink. A monthly close back above 0.7000 will take the big picture pressure off the downside and strengthen case for a bottom.

AUDUSD Chart
R2 0.6128 - 7 April high - Strong - S1 0.5914 - 9 April/2025 low - Strong
R1 0.6086 - 8 April high - Medium - S2 0.5900 - Figure - Medium
AUDUSD: fundamental overview

The Australian Dollar has sunk to yet another yearly low and sits at its lowest level against the US Dollar since 2020. The risk correlated commodity currency has been unable to ignore fallout in US equity markets and global risk reduction on the back of an intensification of trade wars. The latest US +100% tariff on China is driving fresh Aussie selling given the Australian economy’s close relationship with China as its top trading partner. Futures markets now anticipate the RBA will slash rates in May, July, and August, with two more cuts to follow thereafter. Looking ahead, key standouts on the calendar come from ECB speak, Fed speak, and the Fed Minutes late in the day.

 
USDCAD: technical overview

A sustained hold above 1.3000 over the past several months signals an end to a period of longer-term bearish consolidation and suggests the market is in the process of carving out a more significant longer-term base. Next key resistance now comes in at the 1.5000 psychological barrier. Setbacks should be very well supported ahead of 1.4000.

USDCAD Chart
R2 1.4416 - 1 April high - Strong - S1 1.4151 - 14 April low - Medium
R1 1.4319 - 3 April high - Medium - S2 1.4027 - 3 April/2025 low - Strong
USDCAD: fundamental overview

The Canadian Dollar has done a formidable job shaking off the latest downside risk from lower US equities and lower oil on the back of escalating global trade tensions. It seems the Loonie is more focused on the fact that Canada may have avoided additional tariffs from the Trump administration. Looking ahead, key standouts on the calendar come from ECB speak, Fed speak, and the Fed Minutes late in the day.

 
NZDUSD: technical overview

Overall pressure remains on the downside with the market continuing to stall out on runs up into the 0.6500 area. At the same time, there are some signs of the market wanting to put in a longer-term base. Ultimately, a break back above 0.6500 would be required to take the medium-term pressure off the downside and encourage this prospect. A monthly close below 0.5469 will intensify bearish price action.

NZDUSD Chart
R2 0.5798 - 4 April high - Medium - S1 0.5485 - 9 April/2025 low - Strong
R1 0.5648 - 31 March low - Medium - S2 0.5469 - 2020 low - Very Strong
NZDUSD: fundamental overview

The New Zealand Dollar extended its decline to another yearly low earlier today, on the back of a fresh wave of risk off flow from escalating tensions on the global trade front. Meanwhile, the RBNZ went ahead and cut rates 25 basis points as widely expected and looks set to increase the pace of easing at the next meeting in May. The RBNZ considers US reciprocal tariffs a major threat to global economic growth and domestic inflation prospects, and noted there was room to cut the official cash rate further as the tariffs’ impacts unfold. Looking ahead, key standouts on the calendar come from ECB speak, Fed speak, and the Fed Minutes late in the day.

 
Suggested reading

This Time, It Really Is the Tariffs, J. Rekenthaler, Morningstar (April 8, 2025)

What to do about the tariff crash, C. Reilly, RiskHedge (April 7, 2025)


Any opinions, news, research, analyses, prices or other information ("information") contained on this Blog, constitutes marketing communication and it has not been prepared in accordance with legal requirements designed to promote the independence of investment research. Further, the information contained within this Blog does not contain (and should not be construed as containing) investment advice or an investment recommendation, or an offer of, or solicitation for, a transaction in any financial instrument. LMAX Group has not verified the accuracy or basis-in-fact of any claim or statement made by any third parties as comments for every Blog entry.

LMAX Group will not accept liability for any loss or damage, including without limitation to, any loss of profit, which may arise directly or indirectly from use of or reliance on such information. No representation or warranty is given as to the accuracy or completeness of the above information. While the produced information was obtained from sources deemed to be reliable, LMAX Group does not provide any guarantees about the reliability of such sources. Consequently any person acting on it does so entirely at his or her own risk. It is not a place to slander, use unacceptable language or to promote LMAX Group or any other FX and CFD provider and any such postings, excessive or unjust comments and attacks will not be allowed and will be removed from the site immediately.

Day Image
8th April 2025 | view in browser
Volatility grips global currencies

President Trump’s rumored 90-day tariff pause on all but China was quickly denied, leading US stock indices to slide before closing higher, halting a three-day drop, though uncertainty lingers as over 50 countries await trade talks. President Trump remains defiant, pushing for a trade reset with threats of 104% tariffs on China by Thursday.


Performance chart 30day v. USD (%)
Performance Chart
 
 
Technical & fundamental highlights
EURUSD: technical overview

The Euro has been in a multi-month consolidation since bottoming out in 2022. Setbacks have since been exceptionally well supported on dips towards parity, with a higher platform sought out ahead of the next major upside extension. Look for a push back towards the 2023 high at 1.1276 in the days ahead. Only a monthly close below 1.0000 negates.

EURUSD Chart
R2 1.1148 - 3 April/2025 high - Strong - S1 1.0880 - 7 April low - Medium
R1 1.1000 - Psychological - Medium - S2 1.0733 - 27 March low - Strong
EURUSD: fundamental overview

The Euro has edged up against the US Dollar on a cautious market response to renewed US Dollar strength and as traders weigh the potential for retaliatory moves from Europe against US trade policies. At the same time, the rally has been tempered on expectations of a dovish ECB stance amid tariff-related uncertainties. Key standouts on Tuesday’s calendar come from ECB speak, Canada Ivey PMIs, and some Fed speak.

 
GBPUSD: technical overview

Signs have emerged of the market wanting to put in a longer-term base after collapsing to a record low in September 2022. The door is now open for the next major upside extension towards the 2018 high at 1.4377. Setbacks should be well supported above 1.2000 on a monthly close basis.

GBPUSD Chart
R2 1.3208 - 3 April/2025 high - Strong - S1 1.2708 - 7 April low - Medium
R1 1.2934 - 7 April high - Medium - S2 1.2679 - 4 March low - Medium
GBPUSD: fundamental overview

The Pound came under quite a bit of pressure on Monday on the back of uncertainty around the fallout from China’s retaliatory tariffs. Markets have now priced an additional 30 basis points of cuts from the BoE in the first week of April alone, while eyeing an additional 80 basis points of rate cuts by year end. Key standouts on Tuesday’s calendar come from ECB speak, Canada Ivey PMIs, and some Fed speak.

 
USDJPY: technical overview

There are signs of a meaningful top in place after the market put in a multi-year high in 2024. At this point, the door is now open for a deeper setback towards the 140 area.

USDJPY Chart
R2 149.28 - 3 April high - Medium - S1 144.55 - 4 April/2025 low - Medium
R1 148.15 - 7 April high - Medium - S2 144.00 - Figure - Medium
USDJPY: fundamental overview

According to Treasury Secretary Bessent, Japan PM Ishiba arranged a highly productive call with President Trump, reportedly securing Japan a top spot among countries awaiting negotiations with the United States. Key standouts on Tuesday’s calendar come from ECB speak, Canada Ivey PMIs, and some Fed speak.

 
AUDUSD: technical overview

There are signs of the potential formation of a longer-term base with the market trading down into a meaningful longer-term support zone. Only a monthly close below 0.5500 would give reason for rethink. A monthly close back above 0.7000 will take the big picture pressure off the downside and strengthen case for a bottom.

AUDUSD Chart
R2 0.6187 - 4 March low - Medium - S1 0.5932 - 7 April/2025 low - Strong
R1 0.6332 - 4 April high - Medium - S2 0.5900 - Figure - Medium
AUDUSD: fundamental overview

The Australian Dollar has been getting some welcome relief early Tuesday as the market tries to look for the worst to the out of the way with respect to fallout from US tariffs. However, there is still plenty of uncertainty out there and a rate cut from the RBA in May followed by 3 more cuts thereafter is looking increasingly likely. Key standouts on Tuesday’s calendar come from ECB speak, Canada Ivey PMIs, and some Fed speak.

 
USDCAD: technical overview

A sustained hold above 1.3000 over the past several months signals an end to a period of longer-term bearish consolidation and suggests the market is in the process of carving out a more significant longer-term base. Next key resistance now comes in at the 1.5000 psychological barrier. Setbacks should be very well supported ahead of 1.4000.

USDCAD Chart
R2 1.4416 - 1 April high - Strong - S1 1.4151 - 14 April low - Medium
R1 1.4319 - 3 April high - Medium - S2 1.4027 - 3 April/2025 low - Strong
USDCAD: fundamental overview

The Canadian Dollar has managed to steady itself a bit on the back of a rebound in oil prices and comments from PM Carney that the US is driving itself into recession. Key standouts on Tuesday’s calendar come from ECB speak, Canada Ivey PMIs, and some Fed speak.

 
NZDUSD: technical overview

Overall pressure remains on the downside with the market continuing to stall out on runs up into the 0.6500 area. At the same time, there are some signs of the market wanting to put in a longer-term base. Ultimately, a break back above 0.6500 would be required to take the medium-term pressure off the downside and encourage this prospect. A monthly close below 0.5469 will intensify bearish price action.

NZDUSD Chart
R2 0.5798 - 4 April high - Medium - S1 0.5516 - 3 February low - Medium
R1 0.5648 - 31 March low - Medium - S2 0.5506 - 7 April/2025 low - Strong
NZDUSD: fundamental overview

The New Zealand Dollar has managed to find some bids on Tuesday thus far, with the currency following along with a period of relief in risk assets. Still overall, there continues to be plenty of uncertainty around the state of global trade, which could the Kiwi rate well offered into rallies. Key standouts on Tuesday’s calendar come from ECB speak, Canada Ivey PMIs, and some Fed speak.

 
Suggested reading

The Urgent Economic Response Needed After Trump’s Tariff Bombshell, , S. Forbes, Forbes (April 4, 2025)

As They Disrupt Banks, How to Profit From Stablecoins, S. McBride, RiskHedge (April, 2025)


Any opinions, news, research, analyses, prices or other information ("information") contained on this Blog, constitutes marketing communication and it has not been prepared in accordance with legal requirements designed to promote the independence of investment research. Further, the information contained within this Blog does not contain (and should not be construed as containing) investment advice or an investment recommendation, or an offer of, or solicitation for, a transaction in any financial instrument. LMAX Group has not verified the accuracy or basis-in-fact of any claim or statement made by any third parties as comments for every Blog entry.

LMAX Group will not accept liability for any loss or damage, including without limitation to, any loss of profit, which may arise directly or indirectly from use of or reliance on such information. No representation or warranty is given as to the accuracy or completeness of the above information. While the produced information was obtained from sources deemed to be reliable, LMAX Group does not provide any guarantees about the reliability of such sources. Consequently any person acting on it does so entirely at his or her own risk. It is not a place to slander, use unacceptable language or to promote LMAX Group or any other FX and CFD provider and any such postings, excessive or unjust comments and attacks will not be allowed and will be removed from the site immediately.