Day Image
19th January 2026 | view in browser
Macro tone turns cautious

With US markets closed and the Fed in blackout, global macro sentiment leans cautious, with Asia data highlighting uneven growth, rising policy uncertainty, and renewed inflation risks shaping an increasingly complex outlook for markets.


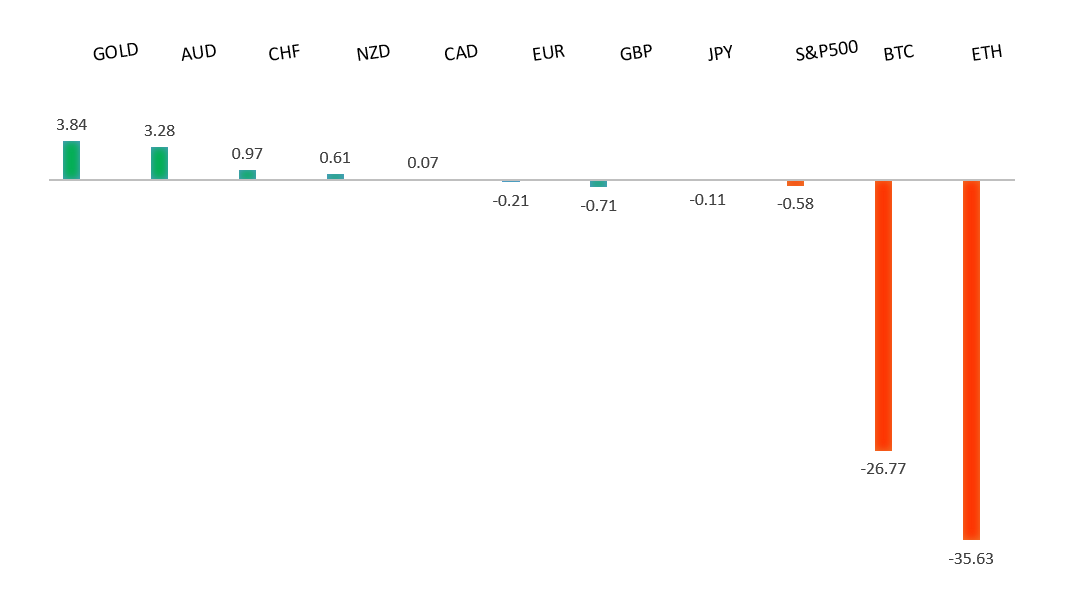
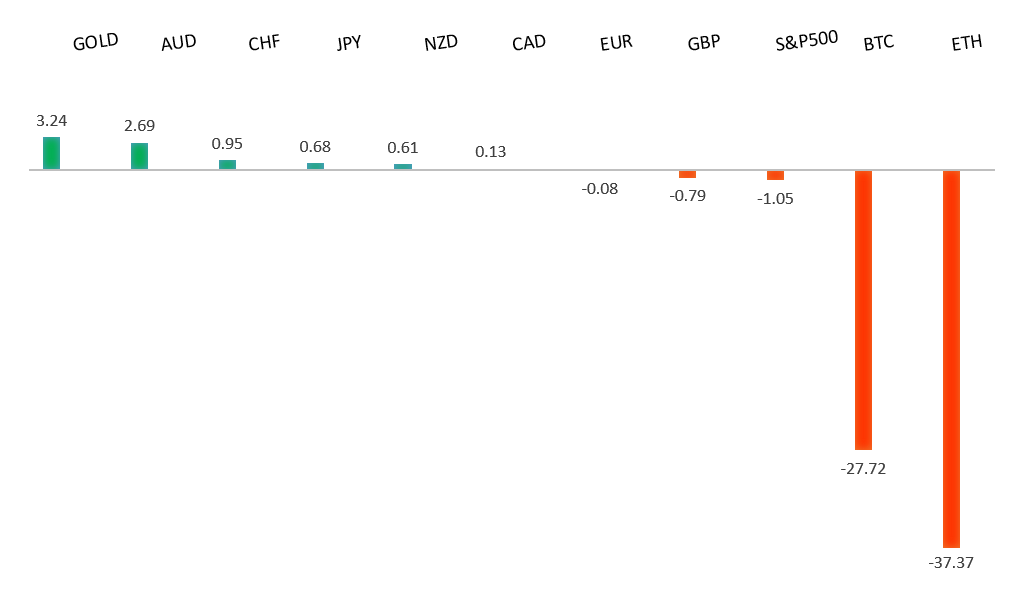
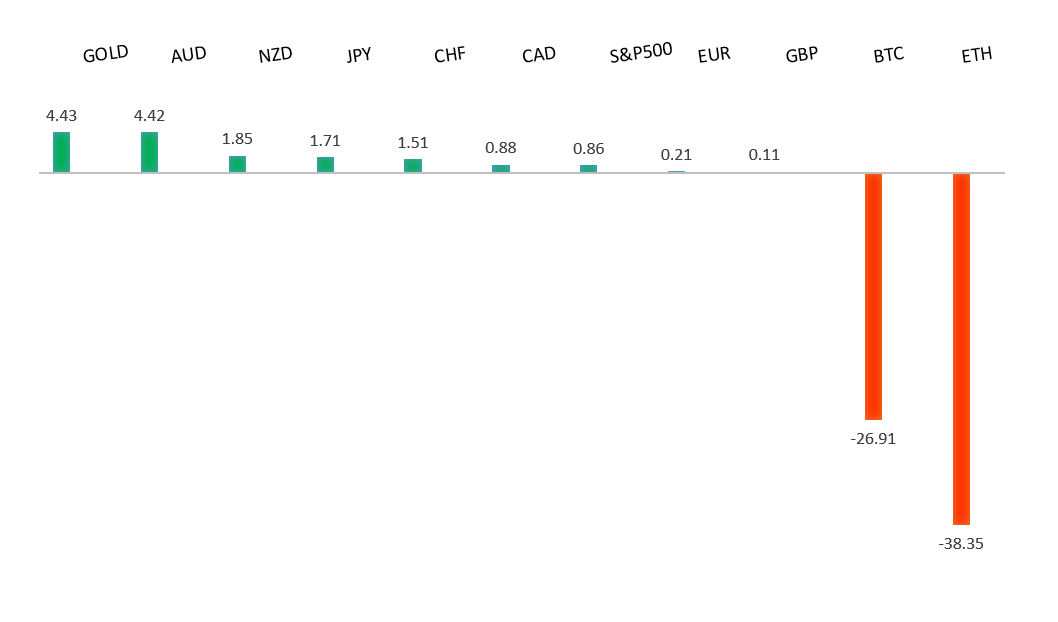
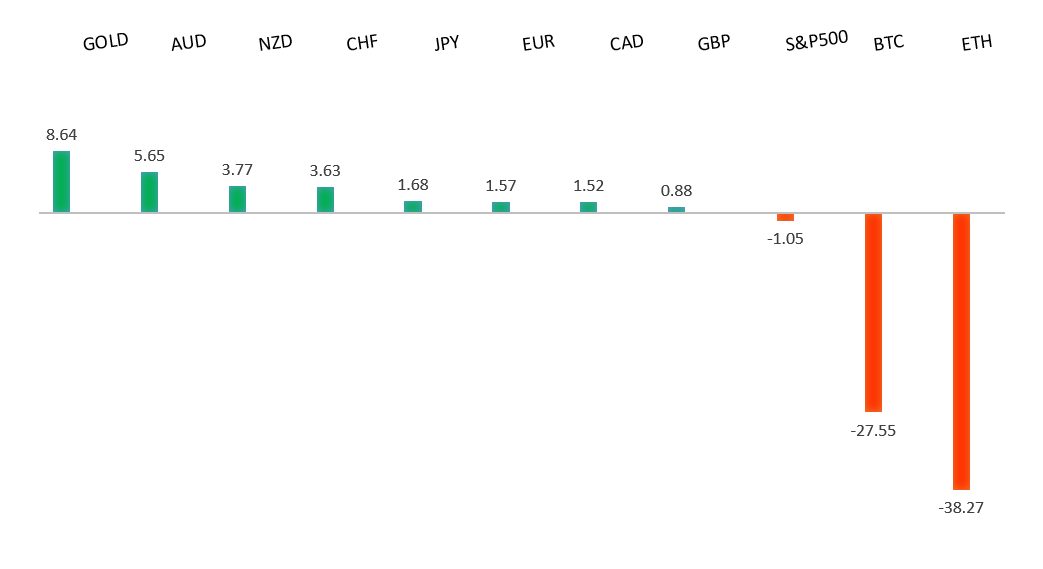
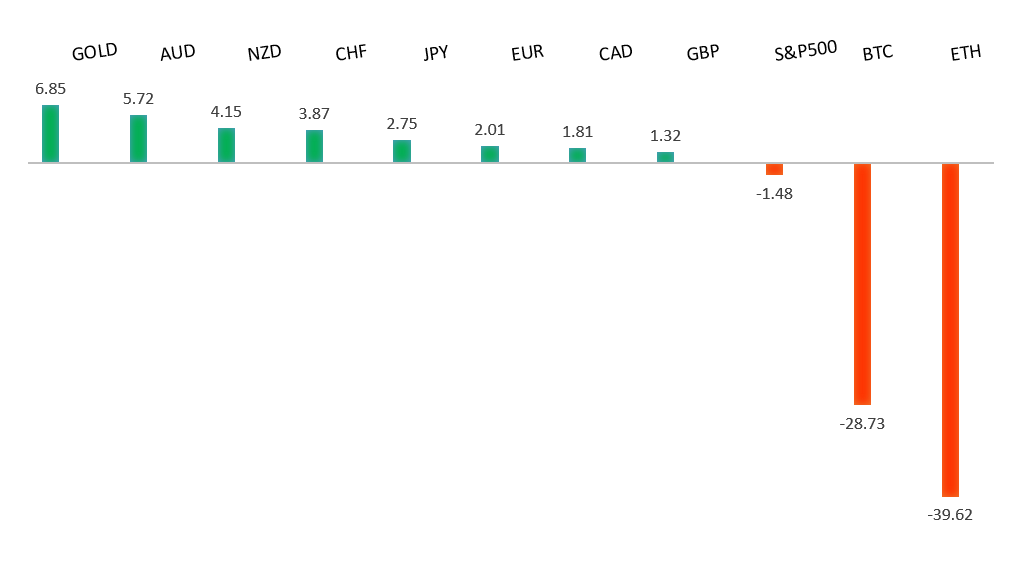
Performance chart 30day v. USD (%)
Performance Chart
 
 
Technical & fundamental highlights
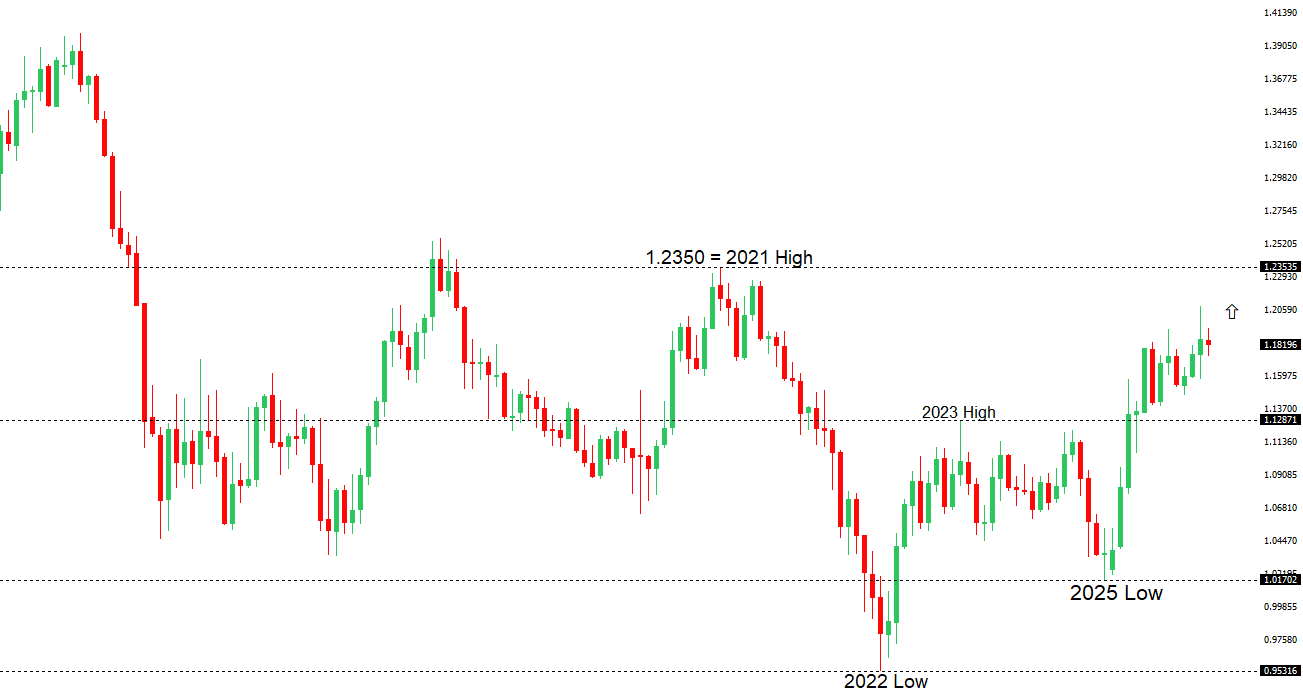
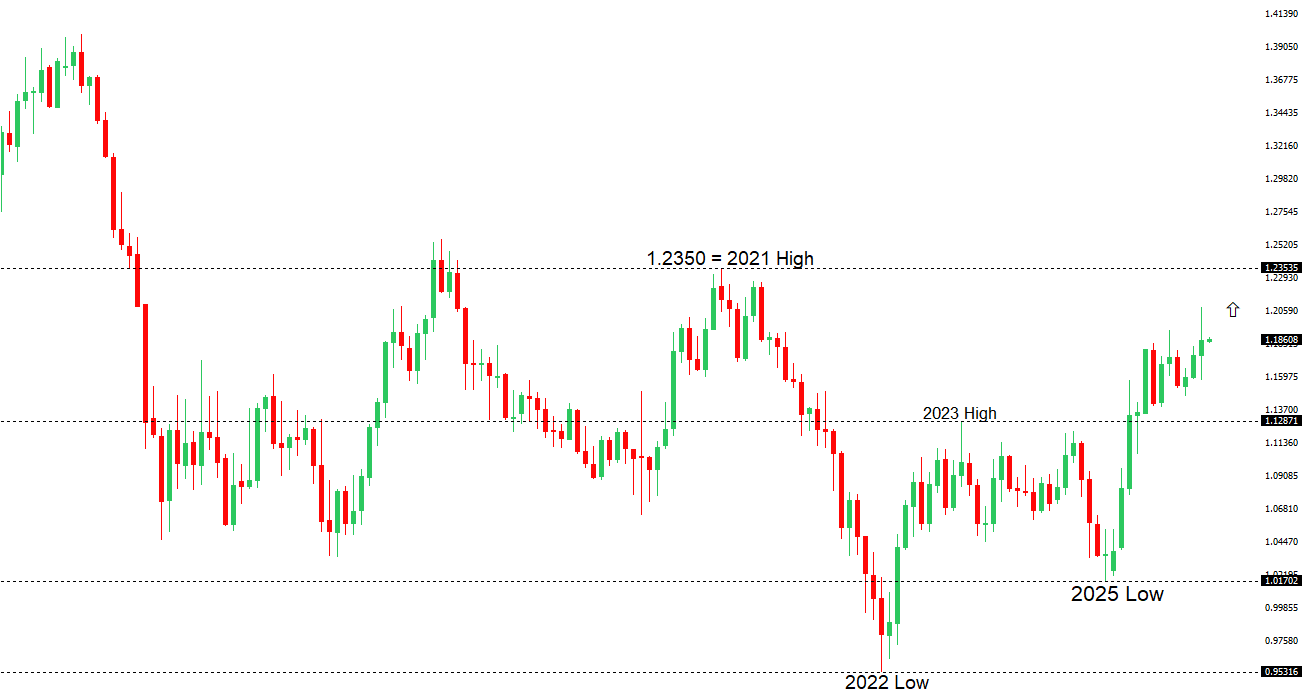
EURUSD: technical overview

The Euro outlook remains constructive with higher lows sought out on dips in favor of the next major upside extension targeting the 2021 high at 1.2350. Setbacks should be exceptionally well supported ahead of 1.1400.

EURUSD Chart
R2 1.1808 - 24 December high -Strong
R1 1.1699 - 12 Janaury high - Medium
S1 1.1577 - 19 January /2026 low - Medium
S2 1.1530 - 7 November low - Medium
EURUSD: fundamental overview

Europe is facing fresh tensions with the Trump administration after Trump announced a 10% tariff from Feb. 1 on countries backing Greenland against US pressure, with a threat to raise it to 25% unless a deal is reached to purchase the territory. Rather than weakening the euro, the news has helped spark a rebound, as markets see the dispute as a potential catalyst for stronger European political unity. One European bank warns the standoff could strain the Western alliance, while France is pushing for a coordinated EU response. Meanwhile, investors are watching key eurozone data this week, including Germany’s ZEW survey and January PMI readings.

 
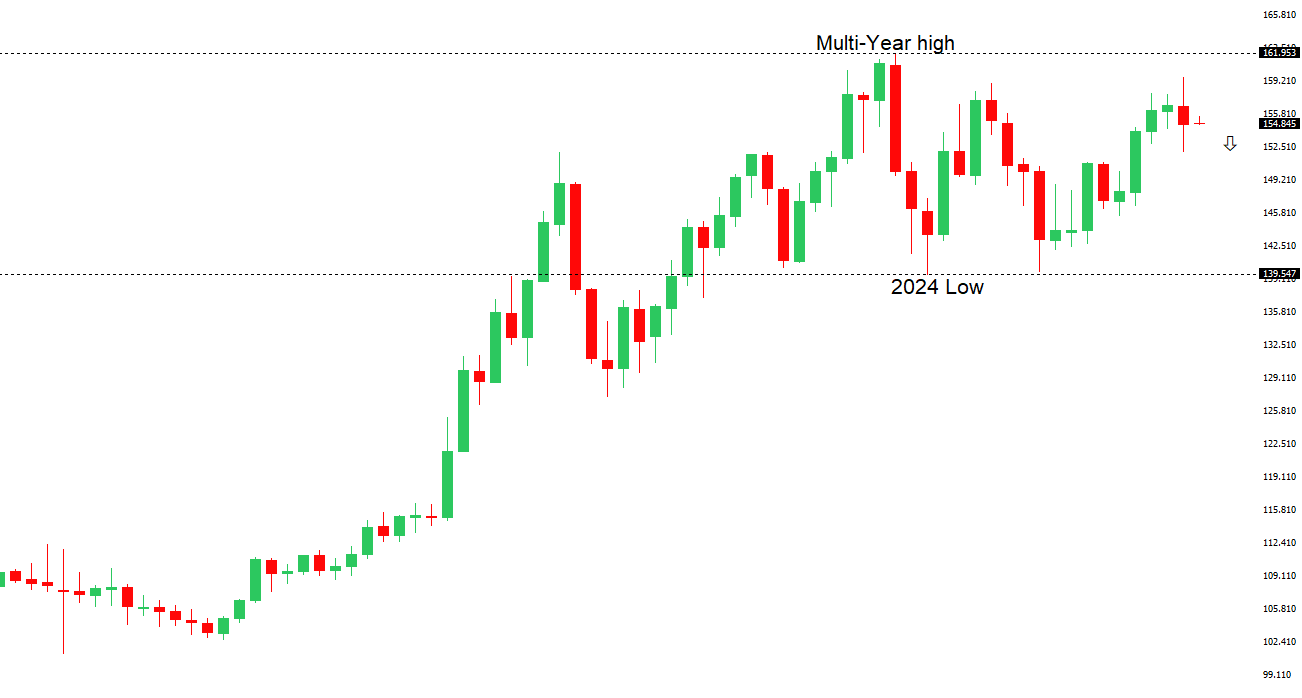
USDJPY: technical overview

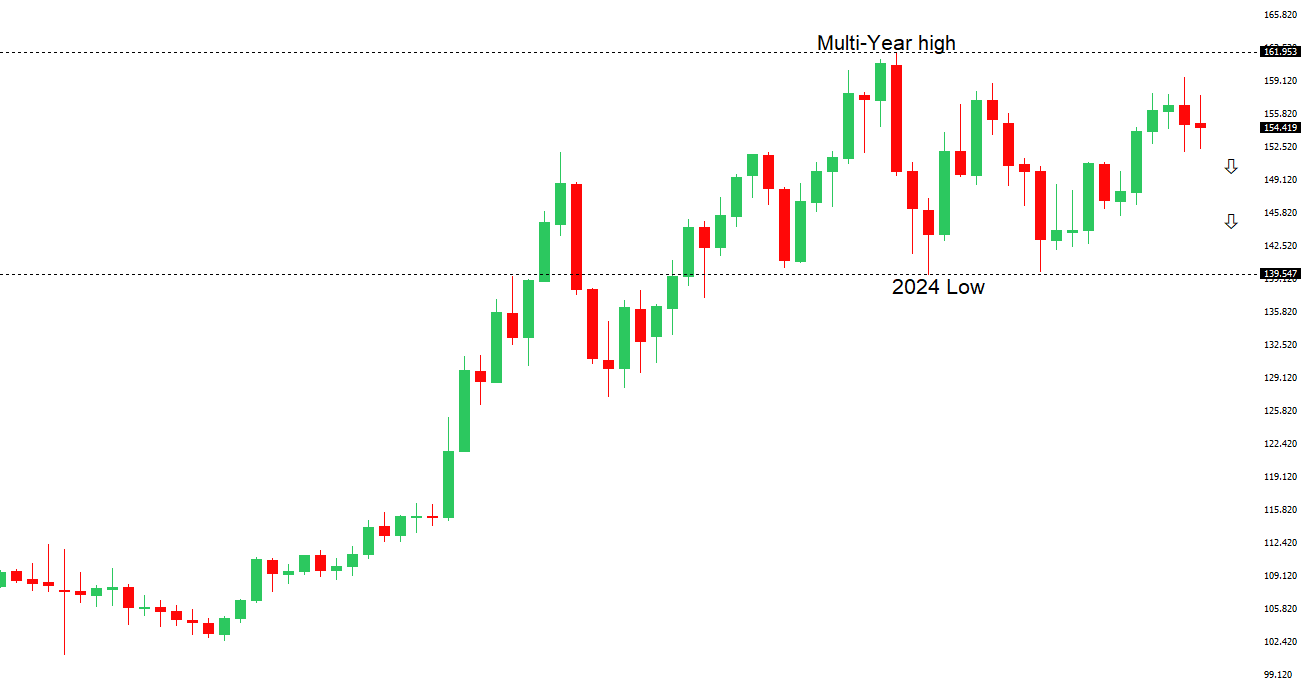
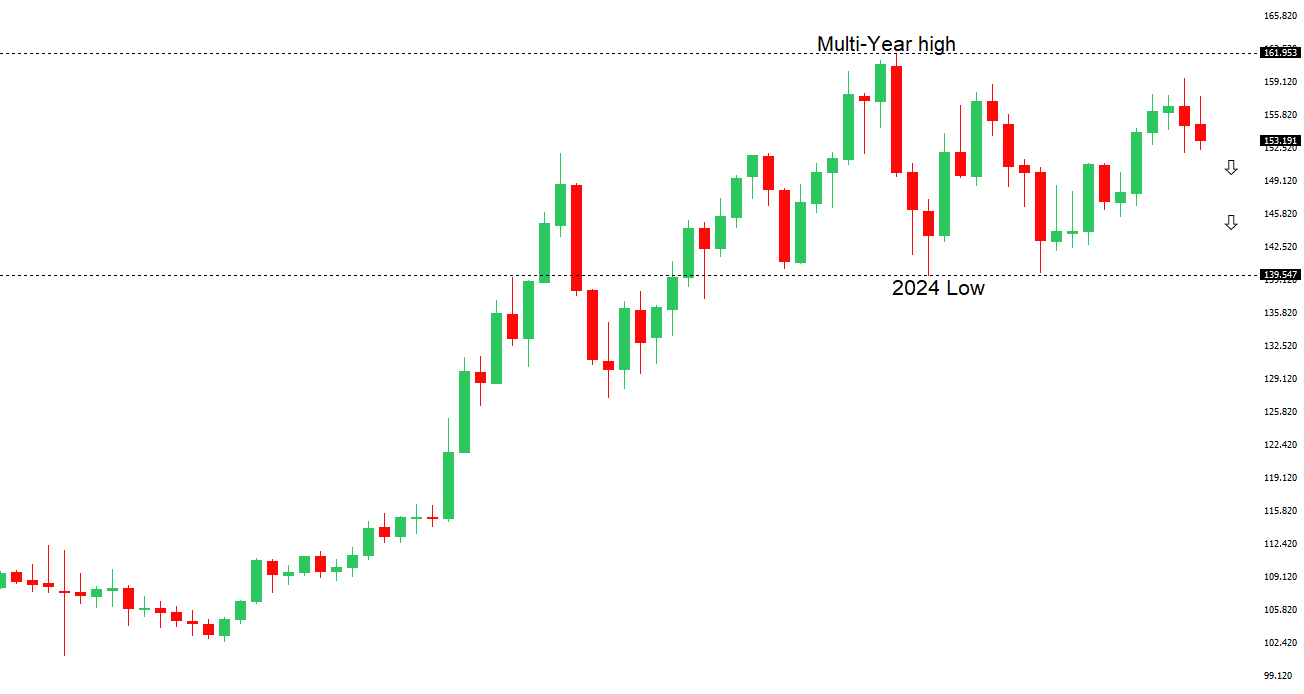
There are signs of a meaningful top in place after the market put in a multi-year high in 2024. At this point, rallies should be well capped ahead of 160.00 ahead of a fresh down-leg back towards the 2024 low at 139.58. A break below 154.39 will strengthen the outlook.

USDJPY Chart
R2 160.00 - Psychological - Strong
R1 159.46 - 14 January /2026 high - Medium
S1 157.42 - 19 January low - Medium
S2 156.11 - 5 January/2026 low - Strong
USDJPY: fundamental overview

The pair has dipped on profit taking and heightened sensitivity to intervention rhetoric, with both Japanese officials and US Treasury Secretary Bessent stepping up verbal warnings. The BoJ is expected to hold rates at 0.75% this week, with markets watching for any hints on the timing of the next hike, still seen only in the second half of the year, even as yen weakness is increasingly viewed as a trigger for earlier tightening rather than a reason to delay. For now, 160.00 remains a key near-term line in the sand, with political and fiscal risks offsetting any support from potential BoJ hawkish signals, while upcoming bond operations, auctions and inflation data will be closely watched.

 
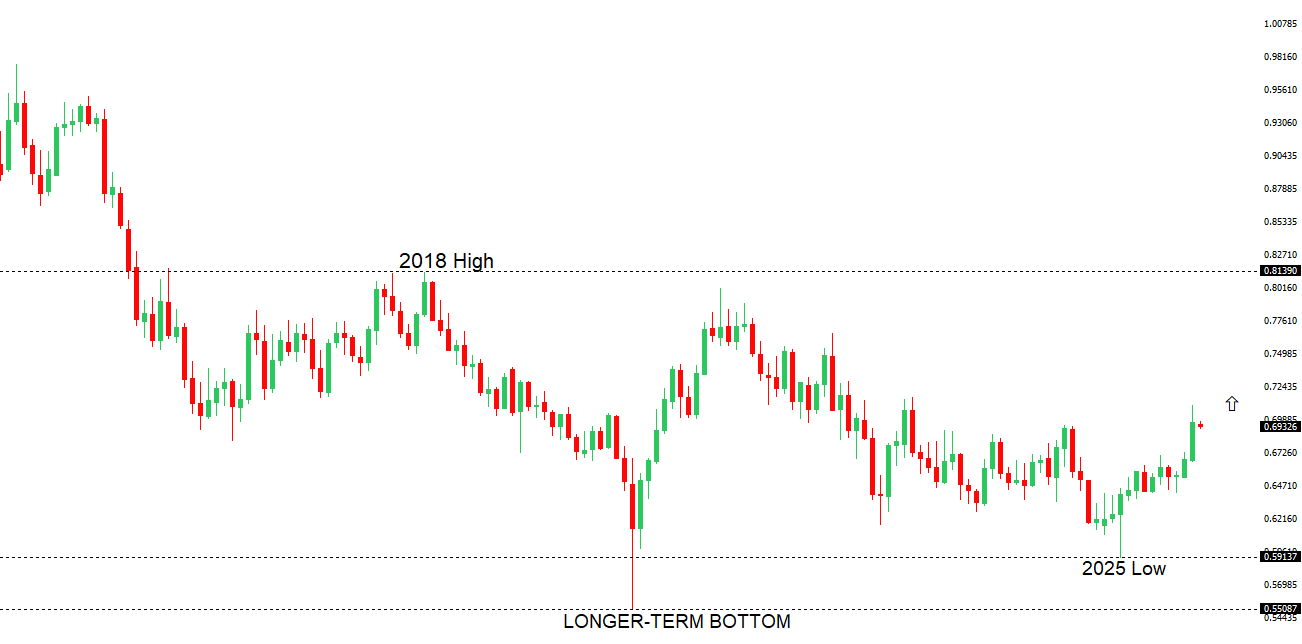
AUDUSD: technical overview

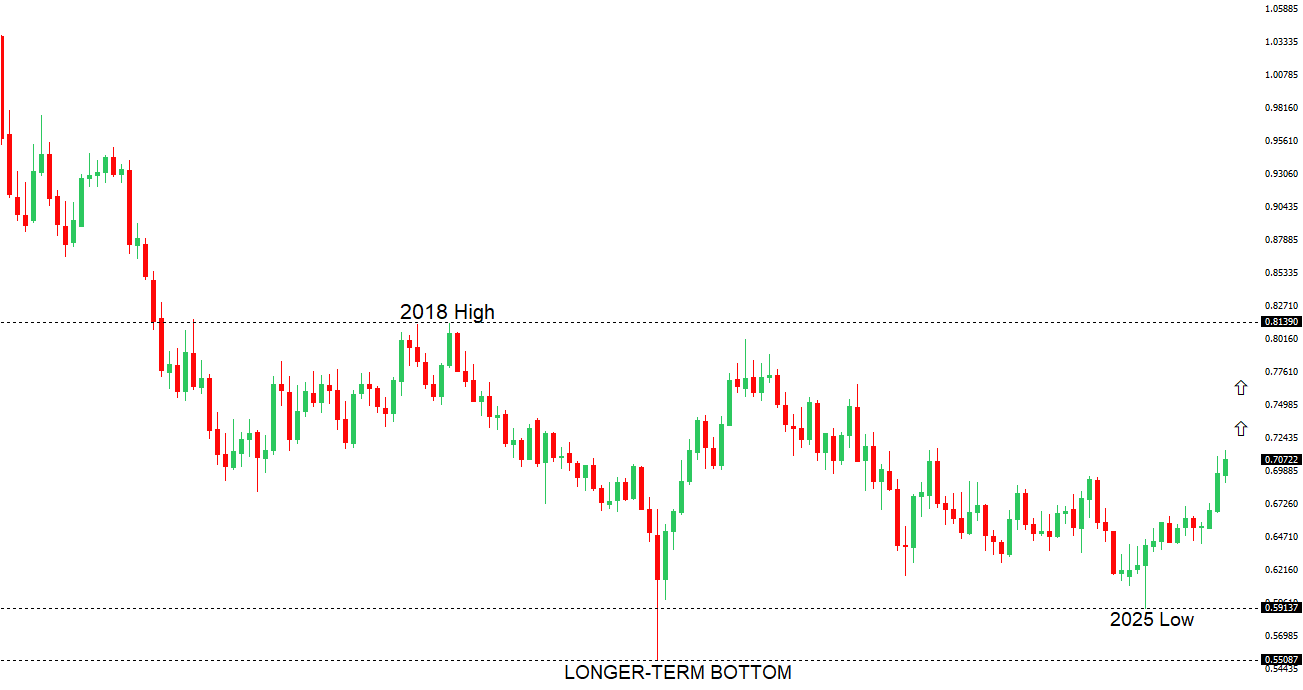
There are signs of the potential formation of a longer-term base with the market trading down into a meaningful longer-term support zone. Only a monthly close below 0.5500 would give reason for rethink. A monthly close back above 0.7000 will take the big picture pressure off the downside and strengthen case for a bottom.

AUDUSD Chart
R2 0.6800 - Figure - Medium
R1 0.6767 - 7 January/2026 high - Medium
S1 0.6660 - 31 December low - Medium
S2 0.6592 - 18 December low - Strong
AUDUSD: fundamental overview

The Australian dollar is the top-performing G10 currency versus the US dollar so far this year, supported by strong domestic data, resilient household spending, and a hawkish RBA that is seen more likely to hike than cut rates. While weaker Chinese demand is a near-term headwind, expected stimulus, a firmer yuan, and strong Chinese trade flows could offset the drag. Markets still price around 40bps of RBA hikes this year, and with US dollar weakness expected over 2026, AUD upside remains intact — though near-term moves will stay highly data-dependent.

 
Suggested reading

The Industrial Renaissance Is Here, T. Slok, Apollo Academy (January 15, 2026)

Why Are Credit Card Rates So High?, B. Carlson, AWOCS (January 15, 2026)


Any opinions, news, research, analyses, prices or other information ("information") contained on this Blog, constitutes marketing communication and it has not been prepared in accordance with legal requirements designed to promote the independence of investment research. Further, the information contained within this Blog does not contain (and should not be construed as containing) investment advice or an investment recommendation, or an offer of, or solicitation for, a transaction in any financial instrument. LMAX Group has not verified the accuracy or basis-in-fact of any claim or statement made by any third parties as comments for every Blog entry.

LMAX Group will not accept liability for any loss or damage, including without limitation to, any loss of profit, which may arise directly or indirectly from use of or reliance on such information. No representation or warranty is given as to the accuracy or completeness of the above information. While the produced information was obtained from sources deemed to be reliable, LMAX Group does not provide any guarantees about the reliability of such sources. Consequently any person acting on it does so entirely at his or her own risk. It is not a place to slander, use unacceptable language or to promote LMAX Group or any other FX and CFD provider and any such postings, excessive or unjust comments and attacks will not be allowed and will be removed from the site immediately.

Day Image
16th January 2026 | view in browser
Calm surface, shifting currents

Markets head into Friday with a cautiously constructive tone, balancing easing inflation and supportive central bank signals against soft growth data and lingering policy uncertainty across major regions.


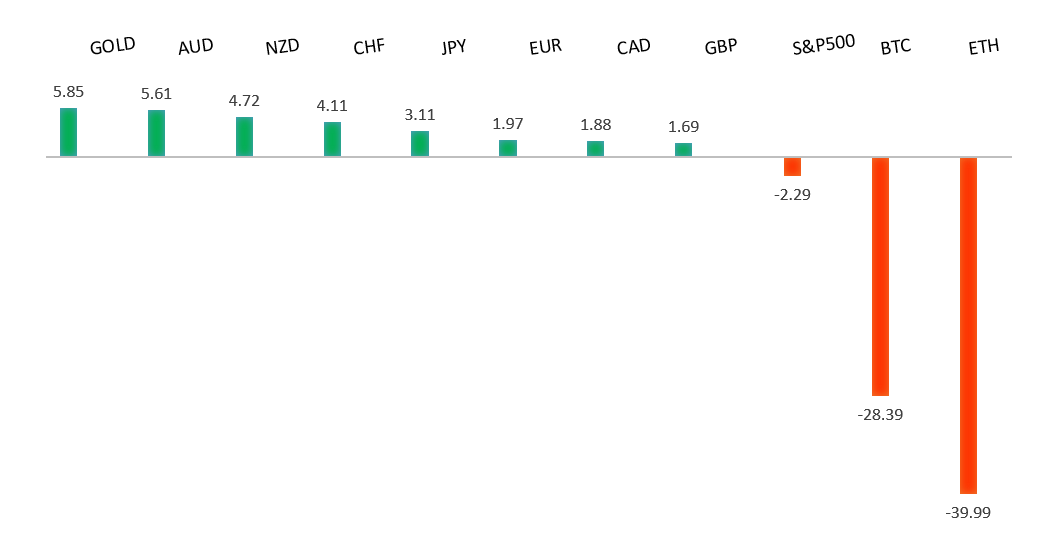
Performance chart 30day v. USD (%)
Performance Chart
 
 
Technical & fundamental highlights
EURUSD: technical overview

The Euro outlook remains constructive with higher lows sought out on dips in favor of the next major upside extension targeting the 2021 high at 1.2350. Setbacks should be exceptionally well supported ahead of 1.1400.

EURUSD Chart
R2 1.1808 - 24 December high -Strong
R1 1.1699 - 12 Janaury high - Medium
S1 1.1593 - 16 January /2026 low - Medium
S2 1.1530 - 7 November low - Medium
EURUSD: fundamental overview

Recent U.S. data continue to look far more resilient than weak euro-area numbers. Germany returned to modest growth in 2025 after two years of contraction, helped by a big shift toward defense and infrastructure spending, but the recovery remains fragile amid weak exports, a manufacturing slump, and rising Chinese competition. While some see echoes of West Germany’s successful industrial pivot in the 1980s, markets remain unconvinced. The Euro is struggling to gain traction as the euro-area trade surplus narrows, imports outpace exports, and ECB projections point to only around 0.2% GDP growth in Q4 with clear downside risks.

 
USDJPY: technical overview

There are signs of a meaningful top in place after the market put in a multi-year high in 2024. At this point, rallies should be well capped ahead of 160.00 ahead of a fresh down-leg back towards the 2024 low at 139.58. A break below 154.39 will strengthen the outlook.

USDJPY Chart
R2 160.00 - Psychological - Strong
R1 159.46 - 14 January /2026 high - Medium
S1 157.52 - 12 January low - Medium
S2 156.11 - 5 January/2026 low - Strong
USDJPY: fundamental overview

We’ve been seeing some Yen demand on long USD profit-taking and intervention talk, with U.S. and Japanese officials stepping up the jawboning. While the BOJ is likely to stay on hold in the very near term, officials are increasingly signalling that a persistently weak yen could actually bring forward future rate hikes, as depreciation is pushing up import prices and keeping inflation near or above target. For now, wide yield differentials and a gradualist BOJ keep the yen biased weaker, but the growing economic and political costs of a cheap currency mean that further losses raise the risk of a stronger policy response or FX intervention.

 
AUDUSD: technical overview

There are signs of the potential formation of a longer-term base with the market trading down into a meaningful longer-term support zone. Only a monthly close below 0.5500 would give reason for rethink. A monthly close back above 0.7000 will take the big picture pressure off the downside and strengthen case for a bottom.

AUDUSD Chart
R2 0.6800 - Figure - Medium
R1 0.6767 - 7 January/2026 high - Medium
S1 0.6660 - 31 December low - Medium
S2 0.6592 - 18 December low - Strong
AUDUSD: fundamental overview

Markets are increasingly pricing a possible RBA rate hike by mid-2026, with some economists even flagging February as a risk, though views remain split as others expect rates to stay on hold until inflation proves more persistent. The next key test will be December jobs data (Jan 22) and Q4 inflation (Jan 28) ahead of the Feb 2–3 RBA meeting. AUD upside remains cautious amid sticky US inflation, rising geopolitical risks, and uncertainty around Trump-related developments, while speculators have sharply reduced short positions and now appear to be waiting for fresh catalysts.

 
Suggested reading

10 Breakthrough Technologies 2026, A. Nordrum, MIT Technology Review (January 12, 2026)

The Haves, Have-Nots & Have-Lots Economy, J. VandeHei, Axios (January 9, 2026)


Any opinions, news, research, analyses, prices or other information ("information") contained on this Blog, constitutes marketing communication and it has not been prepared in accordance with legal requirements designed to promote the independence of investment research. Further, the information contained within this Blog does not contain (and should not be construed as containing) investment advice or an investment recommendation, or an offer of, or solicitation for, a transaction in any financial instrument. LMAX Group has not verified the accuracy or basis-in-fact of any claim or statement made by any third parties as comments for every Blog entry.

LMAX Group will not accept liability for any loss or damage, including without limitation to, any loss of profit, which may arise directly or indirectly from use of or reliance on such information. No representation or warranty is given as to the accuracy or completeness of the above information. While the produced information was obtained from sources deemed to be reliable, LMAX Group does not provide any guarantees about the reliability of such sources. Consequently any person acting on it does so entirely at his or her own risk. It is not a place to slander, use unacceptable language or to promote LMAX Group or any other FX and CFD provider and any such postings, excessive or unjust comments and attacks will not be allowed and will be removed from the site immediately.

Day Image
15th January 2026 | view in browser
Dollar steady as markets digest calm from Washington

The dollar stays firm as markets take comfort from a calmer tone out of Washington, softer oil and cooling metals, while investors brace for a packed global data slate and closely watch signs of labor market softening and currency stability in Asia.


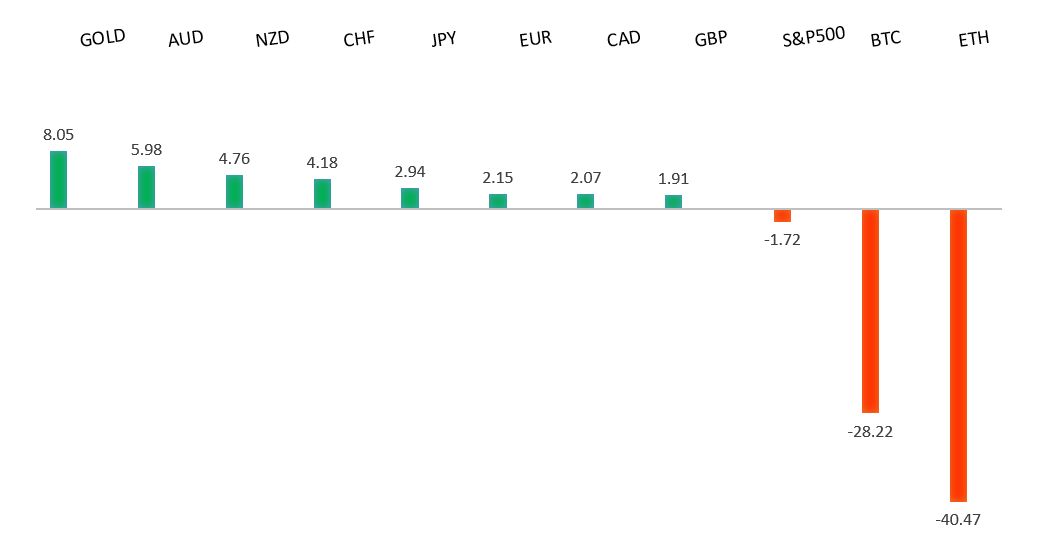
Performance chart 30day v. USD (%)
Performance Chart
 
 
Technical & fundamental highlights
EURUSD: technical overview

The Euro outlook remains constructive with higher lows sought out on dips in favor of the next major upside extension targeting the 2021 high at 1.2350. Setbacks should be exceptionally well supported ahead of 1.1400.

EURUSD Chart
R2 1.1919 - 17 September/2025 high -Strong
R1 1.1765 - 2 Janaury/2026 high - Medium
S1 1.1618 - 9 January /2026 low - Medium
S2 1.1615 - 9 December low - Strong
EURUSD: fundamental overview

The Euro is consolidating, remaining under mild one-month pressure despite a supportive 200-day moving average. Major banks stay constructive on the medium-term outlook, expecting a move above 1.20 in 2026 as eurozone growth stabilizes and the dollar weakens, though January seasonality points to near-term consolidation or a modest pullback. ECB officials say inflation is on track around 2% but warn that global uncertainty and trade tensions are weighing on growth, while Germany’s GDP data this week is expected to confirm an economy stuck near stagnation.

 
USDJPY: technical overview

There are signs of a meaningful top in place after the market put in a multi-year high in 2024. At this point, rallies should be well capped ahead of 160.00 ahead of a fresh down-leg back towards the 2024 low at 139.58. A break below 154.39 will strengthen the outlook.

USDJPY Chart
R2 160.00 - Psychological - Strong
R1 159.46 - 14 January /2026 high - Medium
S1 157.52 - 12 January low - Medium
S2 156.11 - 5 January/2026 low - Strong
USDJPY: fundamental overview

The yen is struggling to hold recovery gains after officials stepped up intervention rhetoric. Markets see a potential early election and a strong showing for Takaichi as reinforcing the reflationary “Takaichi trade” of higher yields and a weaker yen, with some calling for a move toward 160 or higher, though much of that story already looks priced in. While a decisive win could still see USDJPY test the 160–162 area, risks are two-sided: a narrow victory, a more cautious policy tone, or a hawkish BOJ or dovish Fed could trigger consolidation or even a sharp yen rebound.

 
AUDUSD: technical overview

There are signs of the potential formation of a longer-term base with the market trading down into a meaningful longer-term support zone. Only a monthly close below 0.5500 would give reason for rethink. A monthly close back above 0.7000 will take the big picture pressure off the downside and strengthen case for a bottom.

AUDUSD Chart
R2 0.6800 - Figure - Medium
R1 0.6767 - 7 January/2026 high - Medium
S1 0.6660 - 31 December low - Medium
S2 0.6592 - 18 December low - Strong
AUDUSD: fundamental overview

The Australian dollar edged lower as domestic data softened, with inflation expectations easing slightly and bond yields dipping, reinforcing the view that the RBA is likely to keep rates on hold for now. Job vacancies continue to fall but at a much slower pace, signalling stabilizing labor conditions. Markets see only modest odds of a rate hike before mid-2026, with upcoming employment and inflation data set to be key. In the US, expectations for Fed cuts remain but are increasingly data-dependent, keeping investors cautious amid rising geopolitical risks.

 
Suggested reading

Killing the Goose that Lays the Golden Egg, J. Wiggins, Behavioral Investment (January 13, 2026)

It’s the End of the World as We Know It—and the Market Feels Fine, A. Salzman, Barron’s (January 9, 2026)


Any opinions, news, research, analyses, prices or other information ("information") contained on this Blog, constitutes marketing communication and it has not been prepared in accordance with legal requirements designed to promote the independence of investment research. Further, the information contained within this Blog does not contain (and should not be construed as containing) investment advice or an investment recommendation, or an offer of, or solicitation for, a transaction in any financial instrument. LMAX Group has not verified the accuracy or basis-in-fact of any claim or statement made by any third parties as comments for every Blog entry.

LMAX Group will not accept liability for any loss or damage, including without limitation to, any loss of profit, which may arise directly or indirectly from use of or reliance on such information. No representation or warranty is given as to the accuracy or completeness of the above information. While the produced information was obtained from sources deemed to be reliable, LMAX Group does not provide any guarantees about the reliability of such sources. Consequently any person acting on it does so entirely at his or her own risk. It is not a place to slander, use unacceptable language or to promote LMAX Group or any other FX and CFD provider and any such postings, excessive or unjust comments and attacks will not be allowed and will be removed from the site immediately.

Day Image
14th January 2026 | view in browser
Mixed growth, policy in the spotlight

Global markets start the day mixed, with Europe’s industrial slowdown offset by resilient US demand and Asia leaning on trade and stimulus, as investors focus on key inflation data and central bank signals for the policy path ahead.


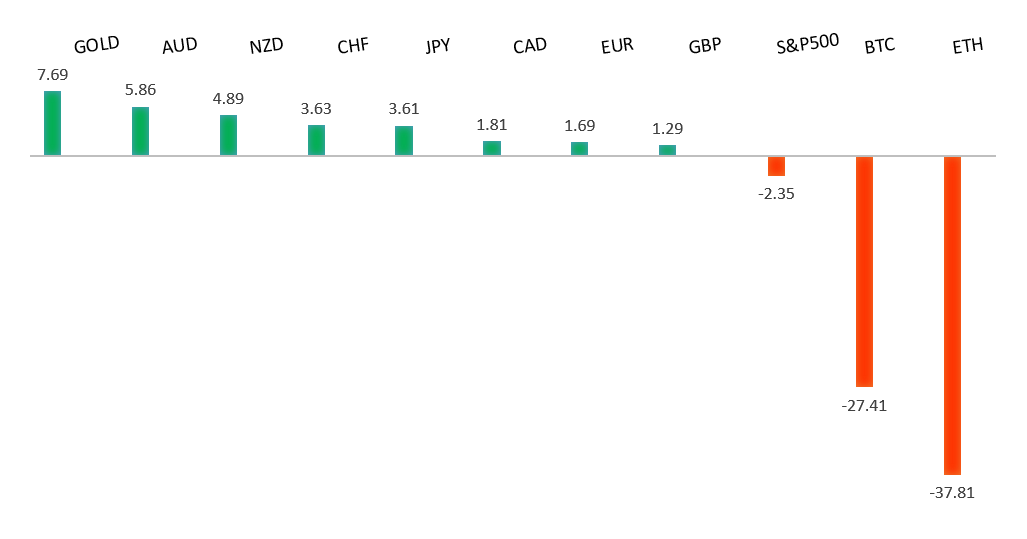
Performance chart 30day v. USD (%)
Performance Chart
 
 
Technical & fundamental highlights
EURUSD: technical overview

The Euro outlook remains constructive with higher lows sought out on dips in favor of the next major upside extension targeting the 2021 high at 1.2350. Setbacks should be exceptionally well supported ahead of 1.1400.

EURUSD Chart
R2 1.1919 - 17 September/2025 high -Strong
R1 1.1765 - 2 Janaury/2026 high - Medium
S1 1.1618 - 9 January /2026 low - Medium
S2 1.1615 - 9 December low - Strong
EURUSD: fundamental overview

The Euro has edged up and is likely to grind higher in a choppy, low-volatility environment, with dips supported by the rising 200-day average but upside capped unless fresh US data weakens the dollar. Big banks remain constructive on the euro into 2026, targeting a move above 1.20 as eurozone growth stabilizes and the dollar fades, though January seasonality points to near-term consolidation. Persistent yen weakness and strong carry trades, alongside subdued option volatility, may also limit how aggressively EURUSD can rally for now.

 
USDJPY: technical overview

There are signs of a meaningful top in place after the market put in a multi-year high in 2024. At this point, rallies should be well capped ahead of 160.00 ahead of a fresh down-leg back towards the 2024 low at 139.58. A break below 154.39 will strengthen the outlook.

USDJPY Chart
R2 160.00 - Psychological - Strong
R1 159.46 - 14 January /2026 high - Medium
S1 157.52 - 12 January low - Medium
S2 156.11 - 5 January/2026 low - Strong
USDJPY: fundamental overview

USDJPY is tracking just below 160 with the yen the weakest G10 currency this week, pressured by surging JGB yields near 27-year highs, widening US-Japan yield gaps, and renewed focus on a possible snap election under PM Takaichi that could reinforce reflationary, yen-negative policies. Speculative yen longs have been largely unwound, leaving room for fresh short positioning if USDJPY breaks higher through 160, though rising intervention warnings from Japanese officials add two-way risk. Overall, markets see a heavy yen bias near term, with political headlines and intervention chatter driving volatility.

 
AUDUSD: technical overview

There are signs of the potential formation of a longer-term base with the market trading down into a meaningful longer-term support zone. Only a monthly close below 0.5500 would give reason for rethink. A monthly close back above 0.7000 will take the big picture pressure off the downside and strengthen case for a bottom.

AUDUSD Chart
R2 0.6800 - Figure - Medium
R1 0.6767 - 7 January/2026 high - Medium
S1 0.6660 - 31 December low - Medium
S2 0.6592 - 18 December low - Strong
AUDUSD: fundamental overview

The Aussie dollar is holding comfortably above recent support as rate expectations remain largely unchanged, with markets pricing around a 30–40% chance of an RBA hike by early 2026. Job vacancies were more resilient than expected, while Australian bond yields briefly pushed higher. Policymakers continue to warn inflation is still too high, and Australia’s high G10 yields are seen as supportive for AUD, though upcoming employment and inflation data will be key for February’s RBA decision. Meanwhile, the USD outlook is more balanced as Fed cut expectations depend on data, and rising global political risks could still trigger safe-haven flows that would weigh on the Aussie.

 
Suggested reading

The Economic Debate Becomes More Political, J. Calhoun, Alhambra (January 11, 2026)

2025 Disappointments May Prove a Winner for Crypto, S. McBride, RiskHedge (January 9, 2026)


Any opinions, news, research, analyses, prices or other information ("information") contained on this Blog, constitutes marketing communication and it has not been prepared in accordance with legal requirements designed to promote the independence of investment research. Further, the information contained within this Blog does not contain (and should not be construed as containing) investment advice or an investment recommendation, or an offer of, or solicitation for, a transaction in any financial instrument. LMAX Group has not verified the accuracy or basis-in-fact of any claim or statement made by any third parties as comments for every Blog entry.

LMAX Group will not accept liability for any loss or damage, including without limitation to, any loss of profit, which may arise directly or indirectly from use of or reliance on such information. No representation or warranty is given as to the accuracy or completeness of the above information. While the produced information was obtained from sources deemed to be reliable, LMAX Group does not provide any guarantees about the reliability of such sources. Consequently any person acting on it does so entirely at his or her own risk. It is not a place to slander, use unacceptable language or to promote LMAX Group or any other FX and CFD provider and any such postings, excessive or unjust comments and attacks will not be allowed and will be removed from the site immediately.

Day Image
13th January 2026 | view in browser
Markets hold firm amid Fed noise and slowing China

Global markets open mixed but steady, with a softer dollar supporting major currencies, Fed politics making noise without derailing sentiment, and Asia sending mixed signals as growth momentum softens in China and Japan’s weak yen keeps policy in focus.


Performance chart 30day v. USD (%)
Performance Chart
 
 
Technical & fundamental highlights
EURUSD: technical overview

The Euro outlook remains constructive with higher lows sought out on dips in favor of the next major upside extension targeting the 2021 high at 1.2350. Setbacks should be exceptionally well supported ahead of 1.1400.

EURUSD Chart
R2 1.1919 - 17 September/2025 high -Strong
R1 1.1765 - 2 Janaury/2026 high - Medium
S1 1.1618 - 9 January /2026 low - Medium
S2 1.1615 - 9 December low - Strong
EURUSD: fundamental overview

The euro edged slightly lower as a mildly stronger dollar ahead of US inflation data kept the pair range-bound, with near-term moves still driven by key US events. However, the recent drop in the dollar is reviving memories of the 2025 “Liberation Day” tariff shock, when the euro and gold benefited as liquid alternatives to the greenback. Investor sentiment in the eurozone has improved sharply, pointing to stabilization rather than further deterioration, and one notable research house expects a small pickup in German growth later this year, supported by stronger investment and industrial output.

 
USDJPY: technical overview

There are signs of a meaningful top in place after the market put in a multi-year high in 2024. At this point, rallies should be well capped ahead of 160.00 ahead of a fresh down-leg back towards the 2024 low at 139.58. A break below 154.39 will strengthen the outlook.

USDJPY Chart
R2 160.00 - Psychological - Strong
R1 158.92 - 13 January /2026 high - Medium
S1 157.52 - 12 January low - Medium
S2 156.11 - 5 January/2026 low - Strong
USDJPY: fundamental overview

USDJPY jumped to a fresh one-year high, even as Japanese 10-year yields hit their highest level since 1999, because investors remain focused on political uncertainty and expectations that PM Takaichi may pursue stimulus-heavy fiscal policy after a possible February snap election. Markets see this as delaying Japan’s policy normalization and keeping the yen weak, with some banks forecasting further depreciation. Tensions with China, including new curbs on rare-earth exports to Japan, also weigh on growth prospects and the yen, despite Japan posting a solid current-account surplus in November.

 
AUDUSD: technical overview

There are signs of the potential formation of a longer-term base with the market trading down into a meaningful longer-term support zone. Only a monthly close below 0.5500 would give reason for rethink. A monthly close back above 0.7000 will take the big picture pressure off the downside and strengthen case for a bottom.

AUDUSD Chart
R2 0.6800 - Figure - Medium
R1 0.6767 - 7 January/2026 high - Medium
S1 0.6660 - 31 December low - Medium
S2 0.6592 - 18 December low - Strong
AUDUSD: fundamental overview

The Australian dollar is little changed after Monday’s gains, as markets continue to price in a possible RBA rate hike later this year. Strong November household spending and ongoing warnings from RBA officials that inflation remains “too high” are keeping pressure on policymakers, even as job ads point to a cooling labor market and consumer sentiment stays weak. Markets are watching December jobs and Q4 inflation data closely ahead of the February RBA meeting to assess whether a rate rise is becoming more likely.

 
Suggested reading

Friendly Reminder That Sentiment Affects Bond Markets Too, Fisher Investments (January 9, 2026)

A Casino In Every Pocket, S. Hariharan, Dopamine Markets (January 8, 2026)


Any opinions, news, research, analyses, prices or other information ("information") contained on this Blog, constitutes marketing communication and it has not been prepared in accordance with legal requirements designed to promote the independence of investment research. Further, the information contained within this Blog does not contain (and should not be construed as containing) investment advice or an investment recommendation, or an offer of, or solicitation for, a transaction in any financial instrument. LMAX Group has not verified the accuracy or basis-in-fact of any claim or statement made by any third parties as comments for every Blog entry.

LMAX Group will not accept liability for any loss or damage, including without limitation to, any loss of profit, which may arise directly or indirectly from use of or reliance on such information. No representation or warranty is given as to the accuracy or completeness of the above information. While the produced information was obtained from sources deemed to be reliable, LMAX Group does not provide any guarantees about the reliability of such sources. Consequently any person acting on it does so entirely at his or her own risk. It is not a place to slander, use unacceptable language or to promote LMAX Group or any other FX and CFD provider and any such postings, excessive or unjust comments and attacks will not be allowed and will be removed from the site immediately.

Day Image
12th January 2026 | view in browser
Iran on edge, Fed under fire

Global markets open against a backdrop of rising geopolitical risk, with Iran facing its most serious unrest in decades, oil prices climbing on supply fears, and US politics rattling markets after an unprecedented Justice Department probe into the Federal Reserve sent the dollar lower and gold to record highs. While the US economy remains resilient and earnings season begins, China continues to expand its global economic influence through trade and technology, even as Europe and Asia show signs of slowing growth, cooling labor markets, and weakening domestic demand.


Performance chart 30day v. USD (%)
Performance Chart
 
 
Technical & fundamental highlights
EURUSD: technical overview

The Euro outlook remains constructive with higher lows sought out on dips in favor of the next major upside extension targeting the 2021 high at 1.2350. Setbacks should be exceptionally well supported ahead of 1.1400.

EURUSD Chart
R2 1.1919 - 17 September/2025 high -Strong
R1 1.1765 - 2 Janaury/2026 high - Medium
S1 1.1618 - 9 January /2026 low - Medium
S2 1.1615 - 9 December low - Strong
EURUSD: fundamental overview

The has euro edged up as a softer dollar and renewed political pressure on the Fed prompted a reassessment of USD positioning, though markets still expect the ECB to keep rates on hold amid contained inflation and only modest growth. Major banks remain structurally bullish on the euro for 2026, but warn of near-term consolidation or mild pullbacks early in the year, with EURUSD likely to trade sideways in the 1.15–1.17 range before resuming its longer-term uptrend. Eurozone growth is seen improving gradually and inflation staying near target, supporting the currency over the medium term, while geopolitical tensions and upcoming euro area data remain key near-term drivers.

 
USDJPY: technical overview

There are signs of a meaningful top in place after the market put in a multi-year high in 2024. At this point, rallies should be well capped ahead of 160.00 ahead of a fresh down-leg back towards the 2024 low at 139.58. A break below 154.39 will strengthen the outlook.

USDJPY Chart
R2 158.88 - 10 January/2025 high - Strong
R1 158.21 - 12 January /2026 high - Medium
S1 156.68 - 9 January low - Medium
S2 156.11 - 5 January/2026 low - Strong
USDJPY: fundamental overview

The yen has weakened further, with USDJPY tracking near a one-year high around 158, as mixed Japanese data and political uncertainty complicate the Bank of Japan’s path to policy normalization. Seasonal NISA investment outflows and speculation over a snap election by Prime Minister Sanae Takaichi — aimed at securing support for a large stimulus budget and tougher security stance — are adding pressure to the currency. Markets see a strong LDP mandate as reducing fiscal discipline and delaying BoJ tightening, reinforcing expectations for further yen weakness toward 160 per dollar, despite intervention risks.

 
AUDUSD: technical overview

There are signs of the potential formation of a longer-term base with the market trading down into a meaningful longer-term support zone. Only a monthly close below 0.5500 would give reason for rethink. A monthly close back above 0.7000 will take the big picture pressure off the downside and strengthen case for a bottom.

AUDUSD Chart
R2 0.6800 - Figure - Medium
R1 0.6767 - 7 January/2026 high - Medium
S1 0.6660 - 31 December low - Medium
S2 0.6592 - 18 December low - Strong
AUDUSD: fundamental overview

The Australian dollar has edged to start the week, pointing back towards near 15-month highs as solid household spending, strong gold prices and elevated commodity markets provide support, despite softer labor-market signals. Markets see only modest odds of an RBA rate hike in early 2026, with policymakers focused on medium-term inflation rather than short-term data. Ongoing trade surpluses, a strengthening commodity cycle and expectations of a weaker US dollar over time continue to underpin a positive medium-term outlook for the AUD, even as geopolitical risks weigh on high-beta currencies.

 
Suggested reading

Odds Are Changing: 2026 Is For Investors Not Gamblers, R. Rieder, BlackRock (January 2, 2026)

The Future Of Oil To 2050, P. Caldwell, Morningstar (January 7, 2026)


Any opinions, news, research, analyses, prices or other information ("information") contained on this Blog, constitutes marketing communication and it has not been prepared in accordance with legal requirements designed to promote the independence of investment research. Further, the information contained within this Blog does not contain (and should not be construed as containing) investment advice or an investment recommendation, or an offer of, or solicitation for, a transaction in any financial instrument. LMAX Group has not verified the accuracy or basis-in-fact of any claim or statement made by any third parties as comments for every Blog entry.

LMAX Group will not accept liability for any loss or damage, including without limitation to, any loss of profit, which may arise directly or indirectly from use of or reliance on such information. No representation or warranty is given as to the accuracy or completeness of the above information. While the produced information was obtained from sources deemed to be reliable, LMAX Group does not provide any guarantees about the reliability of such sources. Consequently any person acting on it does so entirely at his or her own risk. It is not a place to slander, use unacceptable language or to promote LMAX Group or any other FX and CFD provider and any such postings, excessive or unjust comments and attacks will not be allowed and will be removed from the site immediately.

Day Image
9th January 2026 | view in browser
Geopolitics, inflation and payrolls

Global markets kick off with geopolitics in focus as the US deepens involvement in Venezuela’s oil revival and eyes regional security, while investors also parse today’s key US labor data for clues on growth and rates. At the same time, easing inflation across Europe and mixed economic signals globally are keeping central banks cautious and market expectations finely balanced.


Performance chart 30day v. USD (%)
Performance Chart
 
 
Technical & fundamental highlights
EURUSD: technical overview

The Euro outlook remains constructive with higher lows sought out on dips in favor of the next major upside extension targeting the 2021 high at 1.2350. Setbacks should be exceptionally well supported ahead of 1.1400.

EURUSD Chart
R2 1.1919 - 17 September/2025 high -Strong
R1 1.1765 - 2 Janaury/2026 high - Medium
S1 1.1642 - 8 January /2026 low - Medium
S2 1.1615 - 9 December low - Strong
EURUSD: fundamental overview

The euro has been quietly consolidating, hovering near a four-week low as a firmer dollar and pre-NFP positioning weighed on sentiment. Eurozone data, however, remain relatively supportive: unemployment fell to 6.3% in November, job creation continued into December, growth in Q4 was the strongest since 2023, and inflation expectations stayed anchored just above 2%, suggesting the ECB is likely to keep rates on hold for longer. German factory orders also surprised to the upside, while geopolitical tensions rose after criticism from President Macron toward Washington and fresh Russian strikes on Ukraine.

 
USDJPY: technical overview

There are signs of a meaningful top in place after the market put in a multi-year high in 2024. At this point, rallies should be well capped ahead of 160.00 ahead of a fresh down-leg back towards the 2024 low at 139.58. A break below 154.39 will strengthen the outlook.

USDJPY Chart
R2 157.90 - 20 November/2025 high - Strong
R1 157.44 - 9 January /2026 high - Medium
S1 155.55 - 24 December low - Medium
S2 154.39 - 16 December low - Strong
USDJPY: fundamental overview

The yen is under mild pressure but still holding within a narrow weekly range despite softer-than-expected wage data, as investors await fresh direction from upcoming US labor figures. The BOJ’s latest regional report reassured markets that Japan’s economy is still recovering and that further gradual rate hikes remain likely, supported by expectations of another strong round of wage increases. However, potential Chinese restrictions on rare-earth exports to Japan could weigh on manufacturing and slow the BOJ’s tightening path, reinforcing forecasts from major banks that the yen may weaken toward 160 per dollar or beyond over the medium term.

 
AUDUSD: technical overview

There are signs of the potential formation of a longer-term base with the market trading down into a meaningful longer-term support zone. Only a monthly close below 0.5500 would give reason for rethink. A monthly close back above 0.7000 will take the big picture pressure off the downside and strengthen case for a bottom.

AUDUSD Chart
R2 0.6800 - Figure - Medium
R1 0.6767 - 7 January/2026 high - Medium
S1 0.6660 - 31 December low - Medium
S2 0.6592 - 18 December low - Strong
AUDUSD: fundamental overview

The Australian dollar has been under pressure, extending its pullback from a 15-month high, as weaker-than-expected November trade data and softer gold prices weighed on sentiment. The smaller trade surplus signals softer demand for key exports like iron ore, coal and LNG, while markets have slightly scaled back expectations for an RBA rate hike in early 2026. That said, the broader backdrop remains supportive for the AUD, with strong commodity prices, a rising Bloomberg Commodity Index, and the RBA signaling that rate cuts are likely over — a stance that contrasts with expected Fed easing and could help the AUD regain upside momentum.

 
Suggested reading

A Simple Metric To Predict Future Stock Returns, L. Swedroe, Morningstar (January 8, 2026)

Rebuilding Ukraine Could Be Top Euro Investment Theme, J. Klement, Reuters (January 7, 2026)


Any opinions, news, research, analyses, prices or other information ("information") contained on this Blog, constitutes marketing communication and it has not been prepared in accordance with legal requirements designed to promote the independence of investment research. Further, the information contained within this Blog does not contain (and should not be construed as containing) investment advice or an investment recommendation, or an offer of, or solicitation for, a transaction in any financial instrument. LMAX Group has not verified the accuracy or basis-in-fact of any claim or statement made by any third parties as comments for every Blog entry.

LMAX Group will not accept liability for any loss or damage, including without limitation to, any loss of profit, which may arise directly or indirectly from use of or reliance on such information. No representation or warranty is given as to the accuracy or completeness of the above information. While the produced information was obtained from sources deemed to be reliable, LMAX Group does not provide any guarantees about the reliability of such sources. Consequently any person acting on it does so entirely at his or her own risk. It is not a place to slander, use unacceptable language or to promote LMAX Group or any other FX and CFD provider and any such postings, excessive or unjust comments and attacks will not be allowed and will be removed from the site immediately.

Day Image
8th January 2026 | view in browser
Soft data, steady policy

Global macro conditions remain cautious but relatively stable as economies head into the new day. The U.S. continues to show strong productivity and underlying resilience, though a softening labor market is keeping the Fed firmly in wait-and-see mode, with markets leaning toward steady rates and potential cuts later in 2026.


Performance chart 30day v. USD (%)
Performance Chart
 
 
Technical & fundamental highlights
EURUSD: technical overview

The Euro outlook remains constructive with higher lows sought out on dips in favor of the next major upside extension targeting the 2021 high at 1.2350. Setbacks should be exceptionally well supported ahead of 1.1400.

EURUSD Chart
R2 1.1919 - 17 September/2025 high -Strong
R1 1.1765 - 2 Janaury/2026 high - Medium
S1 1.1659 - 5 January /2026 low - Medium
S2 1.1615 - 9 December low - Strong
EURUSD: fundamental overview

The euro has been largely quiet in recent sessions as broader USD data and upcoming US labor releases continued to dominate price action. Eurozone December inflation returned to the ECB’s 2% target, easing underlying pressures and reinforcing expectations that rates will remain on hold, with policymakers still cautious and ECB hawks likely to resist near-term cuts. In Germany, weak November retail sales highlighted the fragile state of the consumer, while unemployment remained steady as expected. Geopolitically, Trump’s comments on Greenland drew criticism both domestically and from European leaders, who reaffirmed support for Danish sovereignty and stressed NATO-led cooperation on Arctic security.

 
USDJPY: technical overview

There are signs of a meaningful top in place after the market put in a multi-year high in 2024. At this point, rallies should be well capped ahead of 160.00 ahead of a fresh down-leg back towards the 2024 low at 139.58. A break below 154.39 will strengthen the outlook.

USDJPY Chart
R2 157.90 - 20 November/2025 high - Strong
R1 157.30 - 5 January /2026 high - Medium
S1 155.55 - 24 December low - Medium
S2 154.39 - 16 December low - Strong
USDJPY: fundamental overview

The yen is little changed as attention remains on Japanese rates, with bond yields easing and markets still debating how quickly the BOJ can normalize policy. November wage data disappointed, with nominal pay growth slowing sharply and real wages falling faster than expected, weakening the case for near-term aggressive tightening and posing risks to household consumption. While some underlying measures suggest pay momentum remains intact, markets are likely to see the data as mildly negative for the yen. Adding to the uncertainty, rising Sino-Japanese trade tensions—especially around rare earths critical to manufacturing—could slow economic growth and reinforce expectations of a more gradual BOJ hiking path. Against this backdrop, global banks remain bearish on the yen into 2026, though sharp moves toward 158–160 could raise the risk of FX intervention without necessarily accelerating rate hikes.

 
AUDUSD: technical overview

There are signs of the potential formation of a longer-term base with the market trading down into a meaningful longer-term support zone. Only a monthly close below 0.5500 would give reason for rethink. A monthly close back above 0.7000 will take the big picture pressure off the downside and strengthen case for a bottom.

AUDUSD Chart
R2 0.6800 - Figure - Medium
R1 0.6767 - 7 January/2026 high - Medium
S1 0.6660 - 31 December low - Medium
S2 0.6592 - 18 December low - Strong
AUDUSD: fundamental overview

The Australian dollar edged lower after weaker-than-expected November trade data showed a narrower surplus, with exports falling and imports rising, while softer gold prices also weighed. Markets have slightly pared back expectations for RBA tightening, now pricing only modest odds of a rate hike by early 2026, though medium-term inflation risks from subsidy removal and price resets continue to support the case for eventual tightening. A rising commodity complex, easing Fed policy expectations, and ongoing short-covering in AUD positioning have helped lift AUDUSD since mid-December, suggesting further gains could be driven by commodities and macro fundamentals rather than positioning alone.

 
Suggested reading

4 Investing Ideas for 2026 From Great Money Minds, D. Lefkovitz, Morningstar (January 7, 2026)

A Few Things I’m Pretty Sure About, M. Housel, Collaborative Fund (January 6, 2026)


Any opinions, news, research, analyses, prices or other information ("information") contained on this Blog, constitutes marketing communication and it has not been prepared in accordance with legal requirements designed to promote the independence of investment research. Further, the information contained within this Blog does not contain (and should not be construed as containing) investment advice or an investment recommendation, or an offer of, or solicitation for, a transaction in any financial instrument. LMAX Group has not verified the accuracy or basis-in-fact of any claim or statement made by any third parties as comments for every Blog entry.

LMAX Group will not accept liability for any loss or damage, including without limitation to, any loss of profit, which may arise directly or indirectly from use of or reliance on such information. No representation or warranty is given as to the accuracy or completeness of the above information. While the produced information was obtained from sources deemed to be reliable, LMAX Group does not provide any guarantees about the reliability of such sources. Consequently any person acting on it does so entirely at his or her own risk. It is not a place to slander, use unacceptable language or to promote LMAX Group or any other FX and CFD provider and any such postings, excessive or unjust comments and attacks will not be allowed and will be removed from the site immediately.

Day Image
7th January 2026 | view in browser
Global growth cools as central banks tilt dovish

Global macro sentiment heading into the new day reflects a broad slowdown in growth alongside an increasingly accommodative policy bias across major economies.


Performance chart 30day v. USD (%)
Performance Chart
 
 
Technical & fundamental highlights
EURUSD: technical overview

The Euro outlook remains constructive with higher lows sought out on dips in favor of the next major upside extension targeting the 2021 high at 1.2350. Setbacks should be exceptionally well supported ahead of 1.1400.

EURUSD Chart
R2 1.1919 - 17 September/2025 high -Strong
R1 1.1765 - 2 Janaury/2026 high - Medium
S1 1.1659 - 5 January /2026 low - Medium
S2 1.1615 - 9 December low - Strong
EURUSD: fundamental overview

The euro edged up as the dollar softened, with expectations of a stronger euro into 2026 driven by diverging central-bank paths, anticipated Fed rate cuts, and improving Eurozone growth. German inflation data showed faster-than-expected cooling, reinforcing the broader euro-area disinflation trend, though core pressures remain sticky, supporting the ECB’s relatively hawkish stance and resistance to further rate cuts. At the same time, Europe faces mounting political and geopolitical risks—from Germany’s fragile economic outlook and coalition tensions to concerns over US foreign policy moves and unresolved frictions around Ukraine—that add uncertainty to the otherwise improving macro picture.

 
USDJPY: technical overview

There are signs of a meaningful top in place after the market put in a multi-year high in 2024. At this point, rallies should be well capped ahead of 160.00 ahead of a fresh down-leg back towards the 2024 low at 139.58. A break below 154.39 will strengthen the outlook.

USDJPY Chart
R2 157.90 - 20 November/2025 high - Strong
R1 157.30 - 5 January /2026 high - Medium
S1 155.55 - 24 December low - Medium
S2 154.39 - 16 December low - Strong
USDJPY: fundamental overview

USDJPY slipped as rising Sino-Japanese geopolitical tensions weighed on sentiment, while slightly weaker-than-expected December PMI data had little market impact. Japanese and U.S. officials remain uneasy about sharp yen weakness beyond 160, with a move above 158 likely to raise the risk of intervention, creating asymmetric risks where upside spikes face policy resistance. Although upcoming wage data are expected to show a temporary slowdown in nominal and real earnings, underlying wage momentum remains solid due to labor shortages and minimum wage hikes, supporting the BOJ’s inflation outlook. Meanwhile, China’s new export restrictions on dual-use items to Japan, though limited for now, add meaningful tail risks of further economic escalation.

 
AUDUSD: technical overview

There are signs of the potential formation of a longer-term base with the market trading down into a meaningful longer-term support zone. Only a monthly close below 0.5500 would give reason for rethink. A monthly close back above 0.7000 will take the big picture pressure off the downside and strengthen case for a bottom.

AUDUSD Chart
R2 0.6800 - Figure - Medium
R1 0.6767 - 7 January/2026 high - Medium
S1 0.6660 - 31 December low - Medium
S2 0.6592 - 18 December low - Strong
AUDUSD: fundamental overview

The Australian dollar rose about 0.3%, hovering near a 15-month high and marking a fourth straight day of gains after November CPI data showed inflation easing more than expected. While annual inflation slipped to 3.4%, yields stayed elevated and markets continue to price in some chance of near-term RBA rate hikes, though expectations have softened slightly since before the data. In contrast, anticipated ongoing Fed easing through 2026 leaves the RBA’s relatively firmer stance broadly supportive for the AUD against the US Dollar.

 
Suggested reading

3 Up Years May Seem “Frothy,” But It’s Perfectly Normal, S. McBride, RiskHedge (January 5, 2026)

I Don’t Know What Will Happen. No One Does, J. Calhoun, Alhambra (January 4, 2026)


Any opinions, news, research, analyses, prices or other information ("information") contained on this Blog, constitutes marketing communication and it has not been prepared in accordance with legal requirements designed to promote the independence of investment research. Further, the information contained within this Blog does not contain (and should not be construed as containing) investment advice or an investment recommendation, or an offer of, or solicitation for, a transaction in any financial instrument. LMAX Group has not verified the accuracy or basis-in-fact of any claim or statement made by any third parties as comments for every Blog entry.

LMAX Group will not accept liability for any loss or damage, including without limitation to, any loss of profit, which may arise directly or indirectly from use of or reliance on such information. No representation or warranty is given as to the accuracy or completeness of the above information. While the produced information was obtained from sources deemed to be reliable, LMAX Group does not provide any guarantees about the reliability of such sources. Consequently any person acting on it does so entirely at his or her own risk. It is not a place to slander, use unacceptable language or to promote LMAX Group or any other FX and CFD provider and any such postings, excessive or unjust comments and attacks will not be allowed and will be removed from the site immediately.

Day Image
6th January 2026 | view in browser
Manufacturing soft, markets resilient, risks elevated

Global markets head into the new day with mixed macro signals and elevated geopolitical risk. In the US, manufacturing activity contracted more sharply in December, reflecting weaker production and inventories, while the Fed appears close to a policy pause as markets price a high probability of rates staying on hold amid slowing labor momentum and easing growth concerns.


Performance chart 30day v. USD (%)
Performance Chart
 
 
Technical & fundamental highlights
EURUSD: technical overview

The Euro outlook remains constructive with higher lows sought out on dips in favor of the next major upside extension targeting the 2021 high at 1.2350. Setbacks should be exceptionally well supported ahead of 1.1400.

EURUSD Chart
R2 1.1919 - 17 September/2025 high -Strong
R1 1.1765 - 2 Janaury/2026 high - Medium
S1 1.1659 - 5 January /2026 low - Medium
S2 1.1615 - 9 December low - Strong
EURUSD: fundamental overview

The euro is stabilizing after recent lows as the dollar’s rebound faded, with technical signals suggesting the broader bullish trend in EURUSD remains intact despite short-term pressure from safe-haven dollar demand. While geopolitical developments, including Venezuela, have added a brief bearish bias, they could ultimately support the euro longer term by contributing to lower oil prices and a softer, more diversified global reliance on the dollar. Near term, dollar moves should dominate amid heavy US data, with weaker manufacturing data increasing expectations of Fed rate cuts. Looking ahead to 2026, a more dovish Fed, improving eurozone growth, and a still-hawkish ECB—unconcerned about inflation undershooting—continue to underpin a constructive outlook for the euro.

 
USDJPY: technical overview

There are signs of a meaningful top in place after the market put in a multi-year high in 2024. At this point, rallies should be well capped ahead of 160.00 ahead of a fresh down-leg back towards the 2024 low at 139.58. A break below 154.39 will strengthen the outlook.

USDJPY Chart
R2 157.90 - 20 November/2025 high - Strong
R1 157.30 - 5 January /2026 high - Medium
S1 155.55 - 24 December low - Medium
S2 154.39 - 16 December low - Strong
USDJPY: fundamental overview

The yen was broadly steady as high 10-year JGB yields near multi-decade peaks keep attention on fiscal risks and expectations of further BOJ tightening, with markets pricing up to two more 25bp hikes. We expect a mildly yen-supportive tone over the next one to two weeks, favoring consolidation or modest appreciation rather than a clear USDJPY breakout, unless U.S. yields rise sharply or BOJ hawkishness fades. Authorities in both Japan and the U.S. remain uneasy with yen weakness beyond 160, and moves above 158 would raise intervention risks, creating asymmetric pressure against sharp dollar gains. While upcoming wage data may show softer headline growth and weaker real earnings, underlying wage momentum remains firm due to labor shortages and minimum-wage hikes, supporting the BOJ’s view that inflation pressures persist. Recent declines in Japan’s monetary base also reflect the BOJ’s shift away from ultra-easy policy as rates rise and bond purchases are tapered.

 
AUDUSD: technical overview

There are signs of the potential formation of a longer-term base with the market trading down into a meaningful longer-term support zone. Only a monthly close below 0.5500 would give reason for rethink. A monthly close back above 0.7000 will take the big picture pressure off the downside and strengthen case for a bottom.

AUDUSD Chart
R2 0.6800 - Figure - Medium
R1 0.6732 - 6 January/2026 high - Medium
S1 0.6660 - 31 December low - Medium
S2 0.6592 - 18 December low - Strong
AUDUSD: fundamental overview

The Australian dollar has edged up to multi-month highs and is on course for a third straight daily gain, supported by rising gold prices and generally calm global markets. We continue to see scope for further AUD strength as the Venezuela shock is being treated as a contained, short-term event, China’s latest PMI data point to modest but steady growth rather than a hard landing, and the RBA’s relatively firm policy stance contrasts with expectations of prolonged Fed easing. With speculative positioning still net short AUD and November inflation likely to remain above the RBA’s target, further short covering could support the currency in the weeks ahead.

 
Suggested reading

Slower Progress Since ’71? Floating Dollar Begs for Attention, J. Tamny, Forbes (January 4, 2026)

Important Things That Investors Re-Learned In ’25, Fisher Investments (December 31, 2025)


Any opinions, news, research, analyses, prices or other information ("information") contained on this Blog, constitutes marketing communication and it has not been prepared in accordance with legal requirements designed to promote the independence of investment research. Further, the information contained within this Blog does not contain (and should not be construed as containing) investment advice or an investment recommendation, or an offer of, or solicitation for, a transaction in any financial instrument. LMAX Group has not verified the accuracy or basis-in-fact of any claim or statement made by any third parties as comments for every Blog entry.

LMAX Group will not accept liability for any loss or damage, including without limitation to, any loss of profit, which may arise directly or indirectly from use of or reliance on such information. No representation or warranty is given as to the accuracy or completeness of the above information. While the produced information was obtained from sources deemed to be reliable, LMAX Group does not provide any guarantees about the reliability of such sources. Consequently any person acting on it does so entirely at his or her own risk. It is not a place to slander, use unacceptable language or to promote LMAX Group or any other FX and CFD provider and any such postings, excessive or unjust comments and attacks will not be allowed and will be removed from the site immediately.