Day Image
16th March 2026 | view in browser
Markets look through conflict—for now

Markets open with a modest risk-on bias, though war-driven oil gains and geopolitical uncertainty are keeping investors on edge.


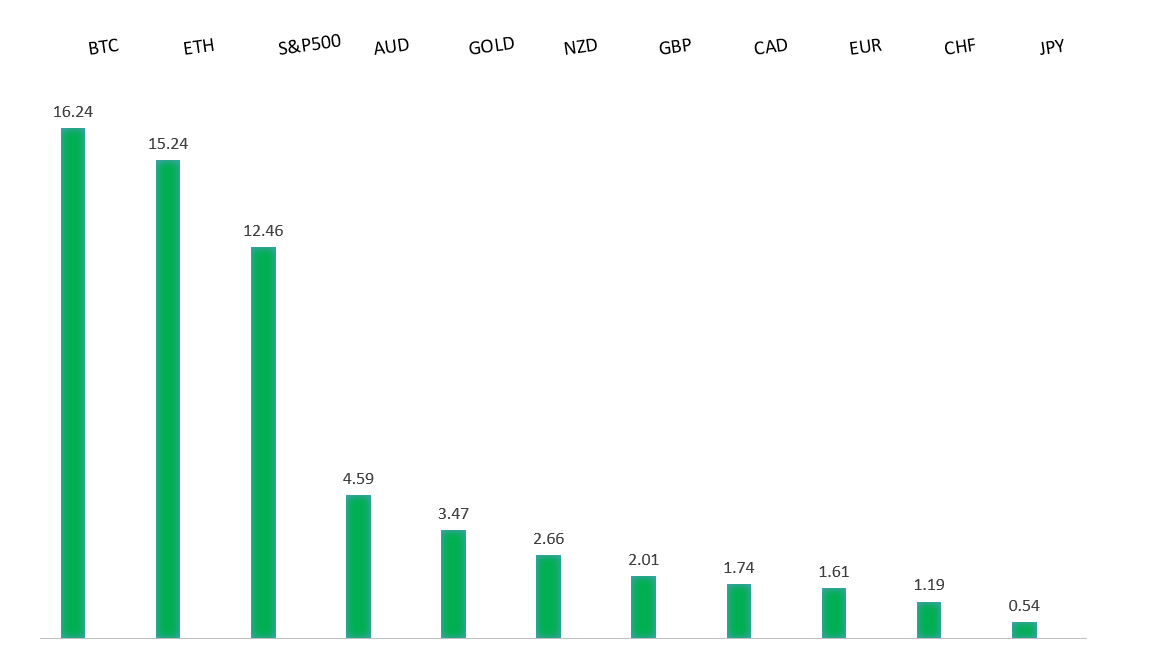
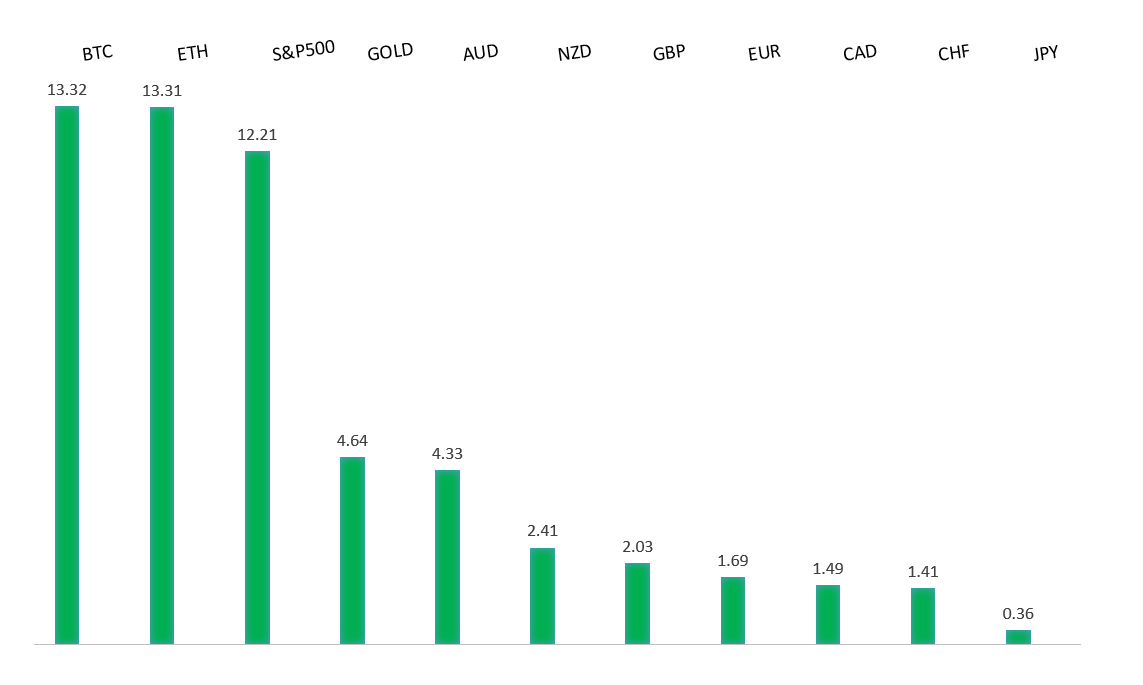
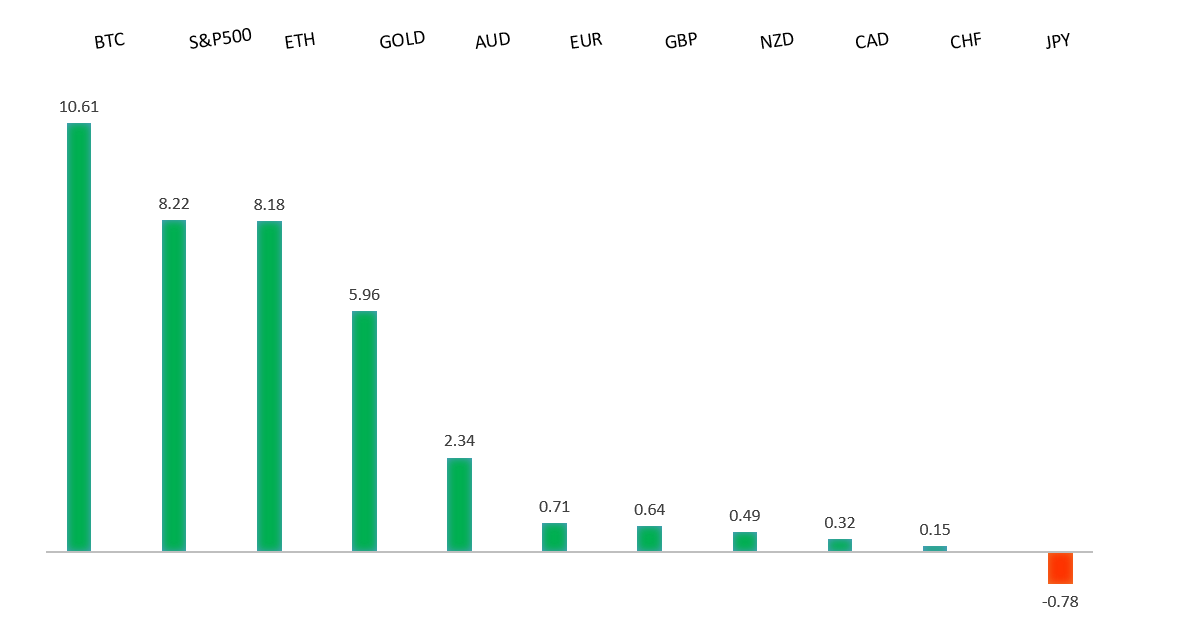
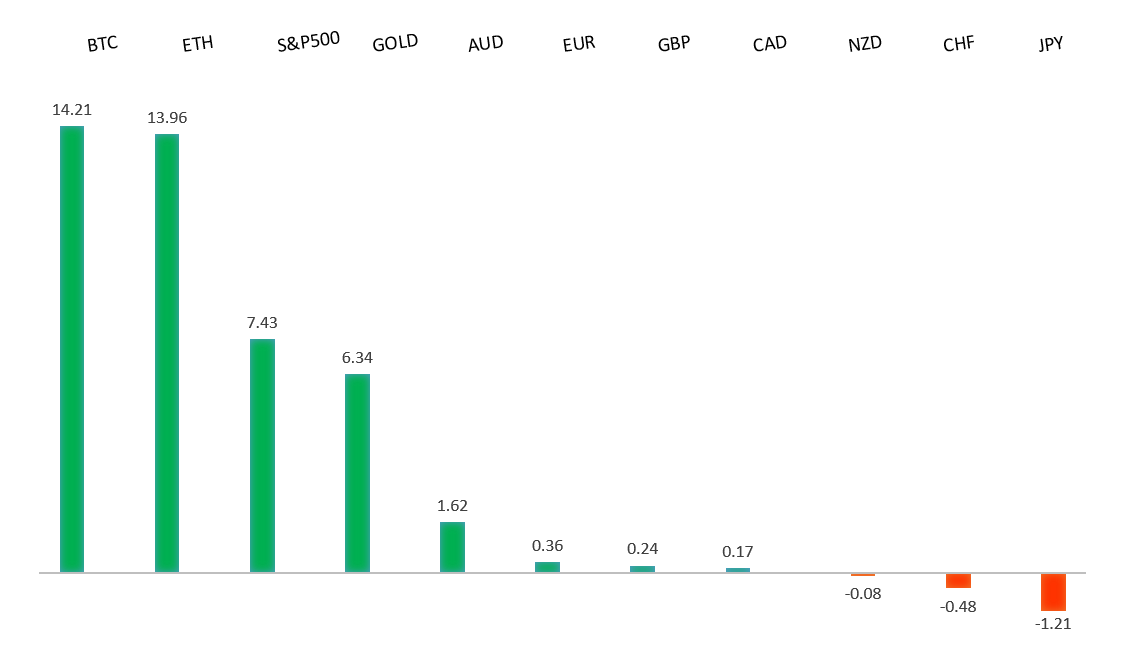
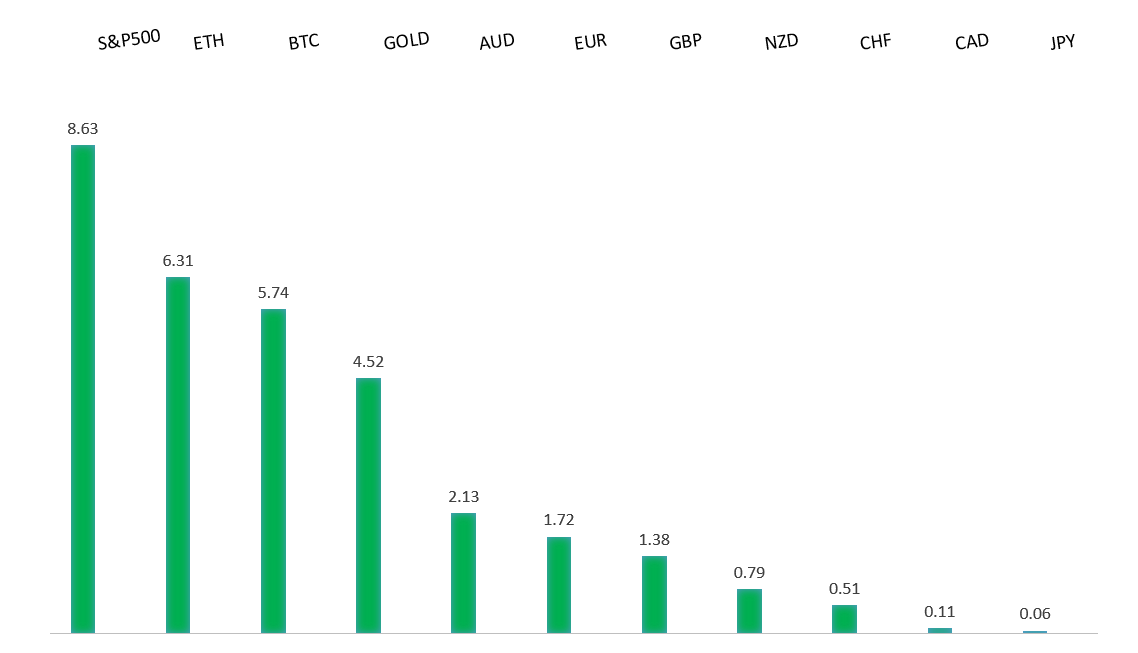
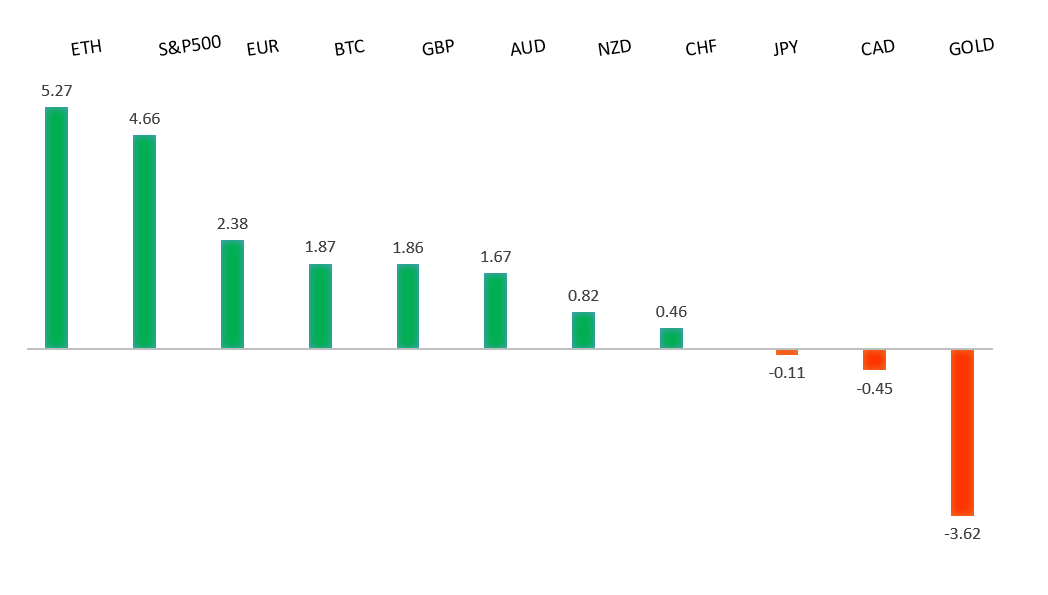
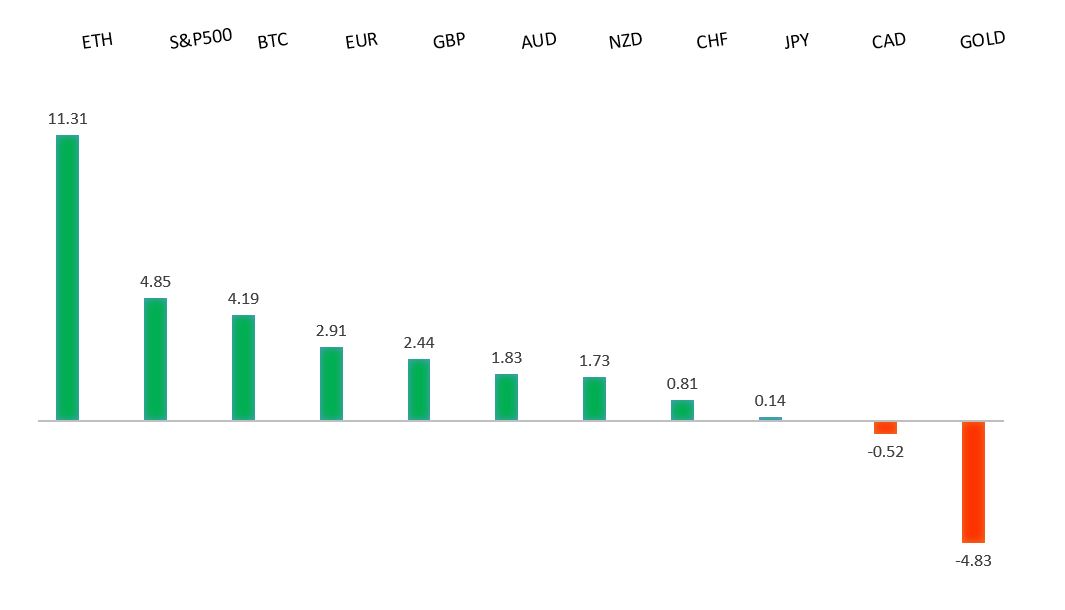
Performance chart 30day v. USD (%)
Performance Chart
 
 
Technical & fundamental highlights
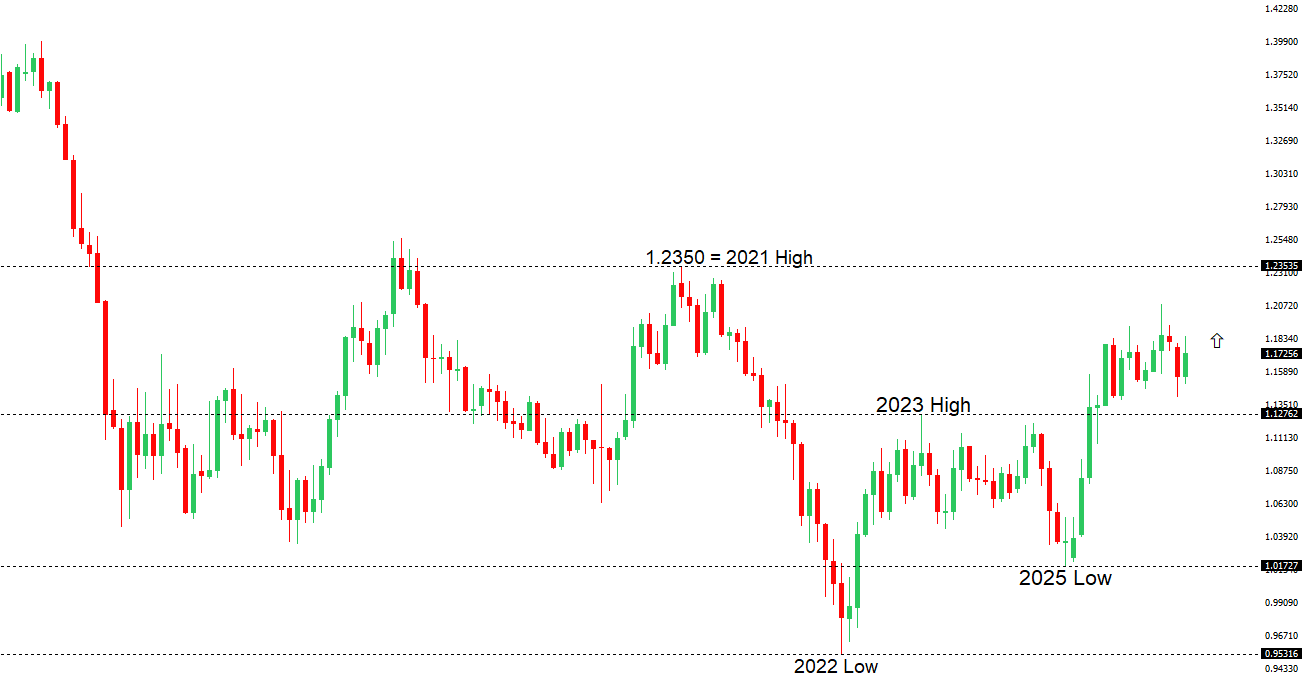
EURUSD: technical overview

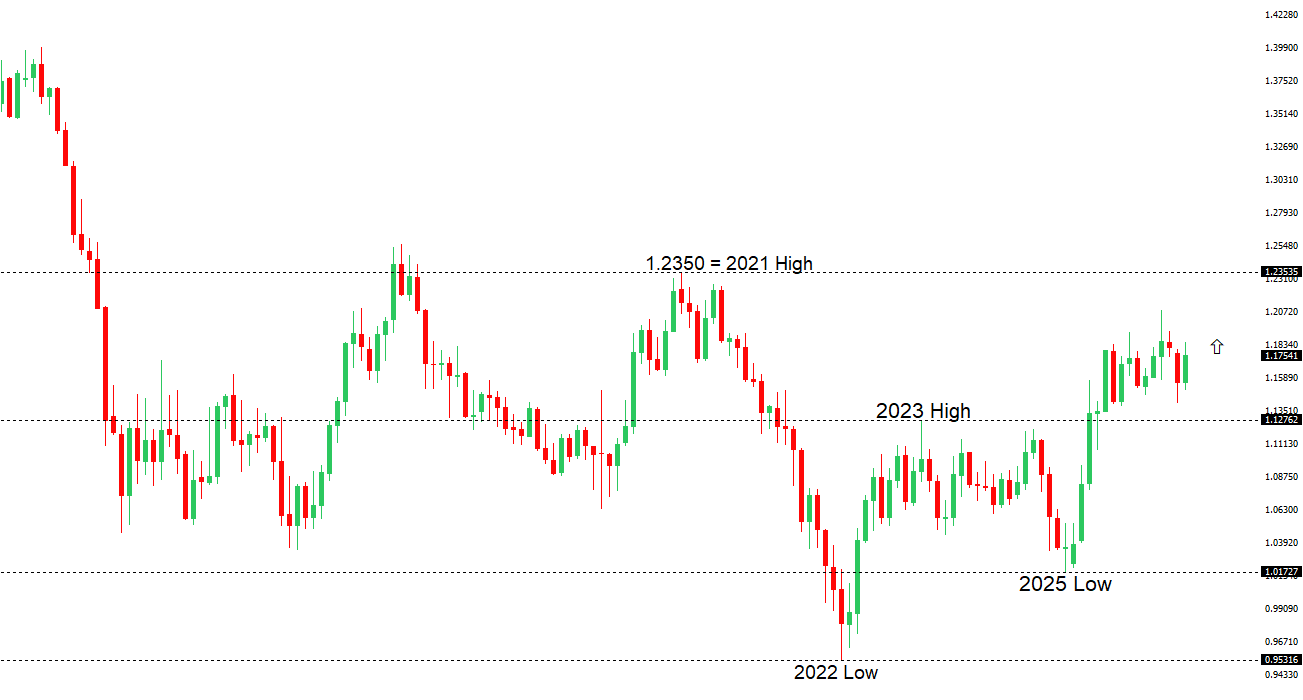
The Euro outlook remains constructive with higher lows sought out on dips in favor of the next major upside extension targeting the 2021 high at 1.2350. Setbacks should be exceptionally well supported ahead of 1.1300.

EURUSD Chart
R2 1.1668 - 10 March high - Strong
R1 1.1530 - 13 March high - Medium
S1 1.1411 - 13 March/2026 low - Medium
S2 1.1400 - Figure - Strong
EURUSD: fundamental overview

The euro has rebounded slightly from Friday’s 7.5-month low of 1.1411, potentially ending a four-day losing streak. The euro remains caught between rising oil prices—which hurt the eurozone’s growth outlook while lifting inflation due to its reliance on imported energy—and markets rapidly pricing in possible ECB tightening. Traders now see a strong chance of a 25 bp rate hike by mid-year, especially if oil stays elevated, while ECB officials have adopted a more hawkish tone in their messaging. However, many economists still expect the deposit rate to remain around 2% for years, arguing the oil shock may be temporary and insufficient to justify tighter policy. As a result, EURUSD’s direction will likely hinge on whether the ECB ultimately validates market expectations with a rate hike or instead prioritizes growth risks and holds policy steady.

 
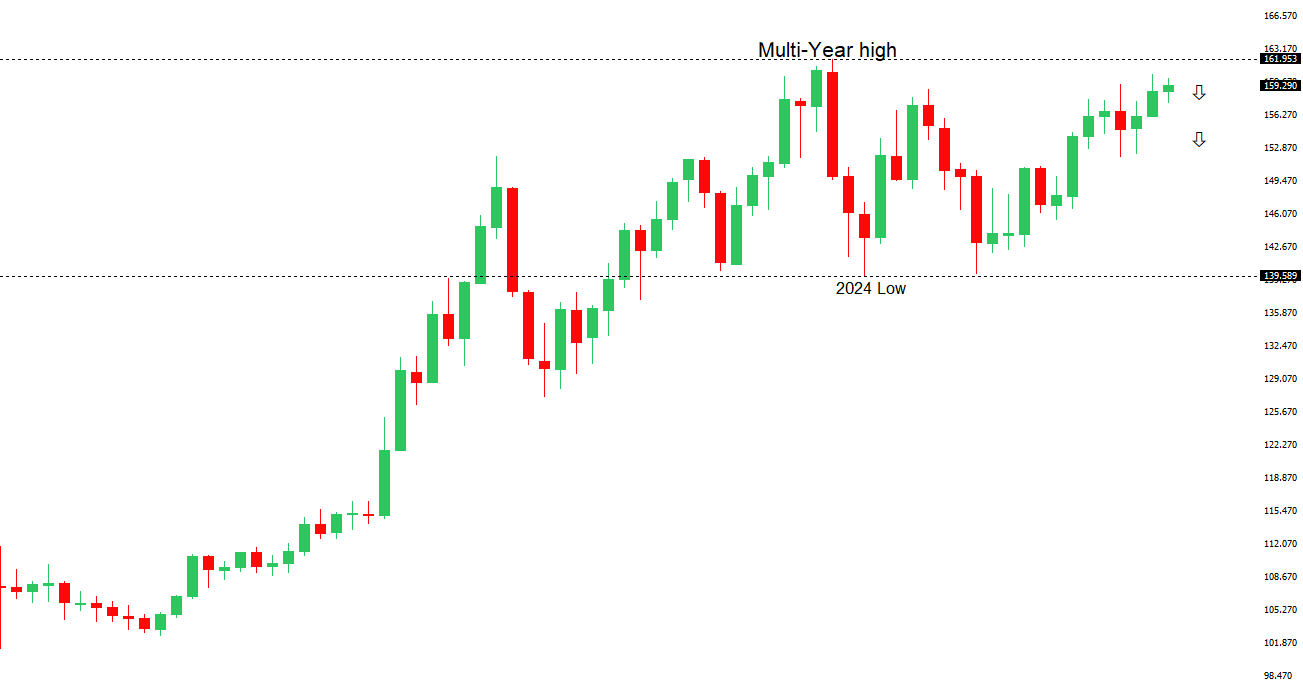
USDJPY: technical overview

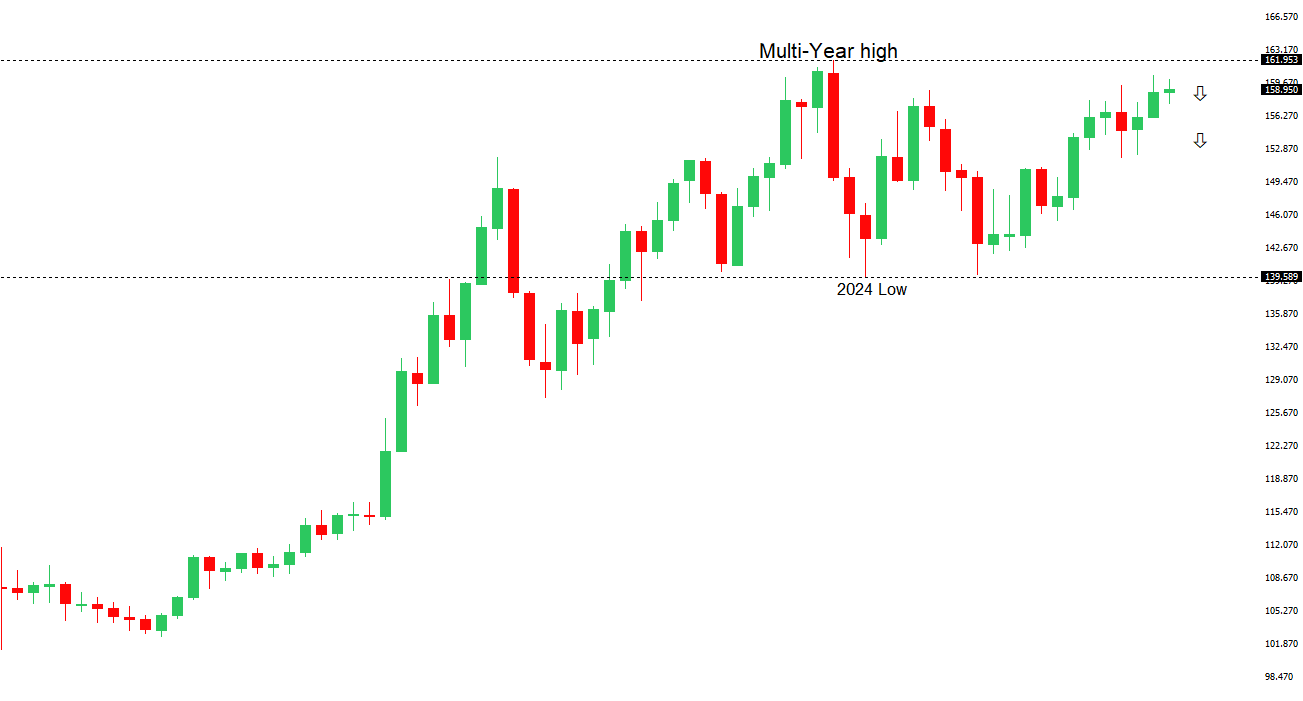
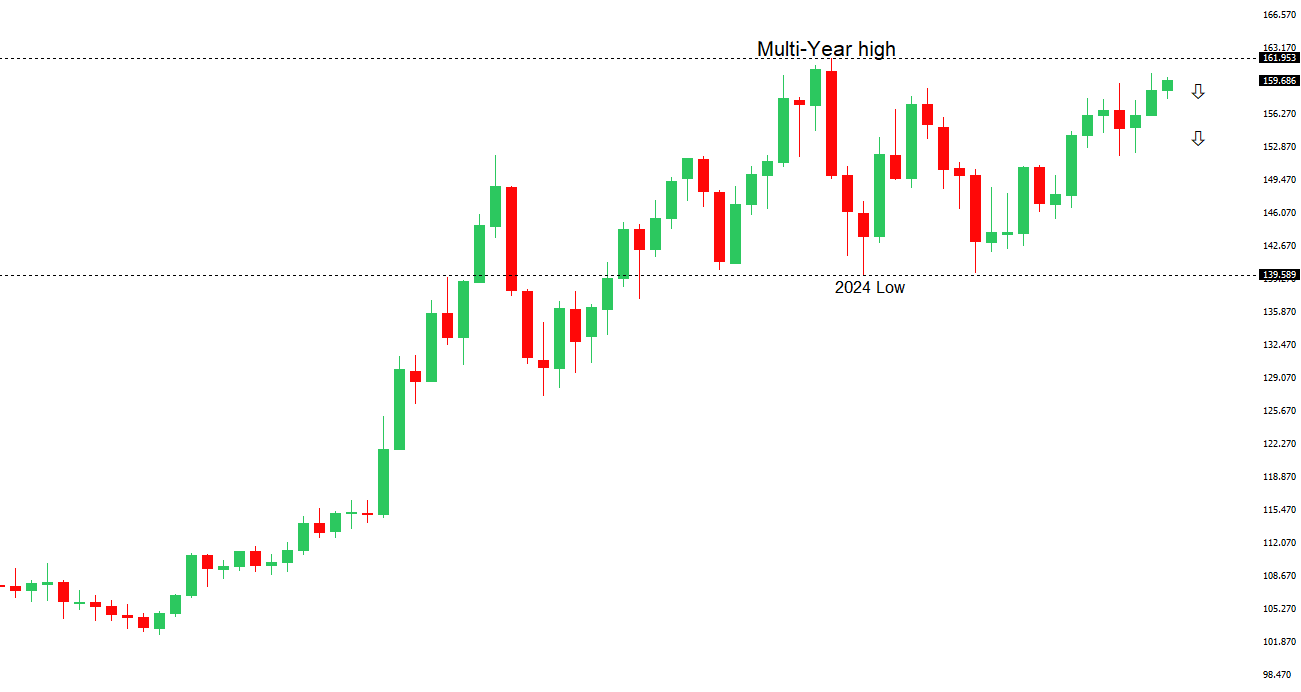
There are signs of the formation of a meaningful top after the market put in a multi-year high in 2024. At this point, rallies should be well capped above 160.00 in favor of a fresh down-leg back towards the 2024 low at 139.58. Only a monthly close above 160.00 negates.

USDJPY Chart
R2 160.00 - Psychological - Strong
R1 159.75 - 13 March/2026 high - Medium
S1 157.27 - 10 March low - Medium
S2 156.45 - 5 March low - Strong
USDJPY: fundamental overview

The yen is holding near a 1.5-year low against the dollar despite warnings from Japan’s finance minister that authorities are closely monitoring the currency and may intervene if needed. The dollar has strengthened on safe-haven demand amid rising Middle East tensions and higher oil prices, while stronger U.S. inflation data has reduced expectations for near-term Fed rate cuts. USDJPY is hovering around the mid-159s, close to its highest levels since 2024, as Japan’s dependence on energy imports makes it particularly sensitive to the oil surge. With the Bank of Japan meeting this week, policymakers face a difficult balance: staying dovish risks further yen weakness, while turning hawkish could push already rising government bond yields higher.

 
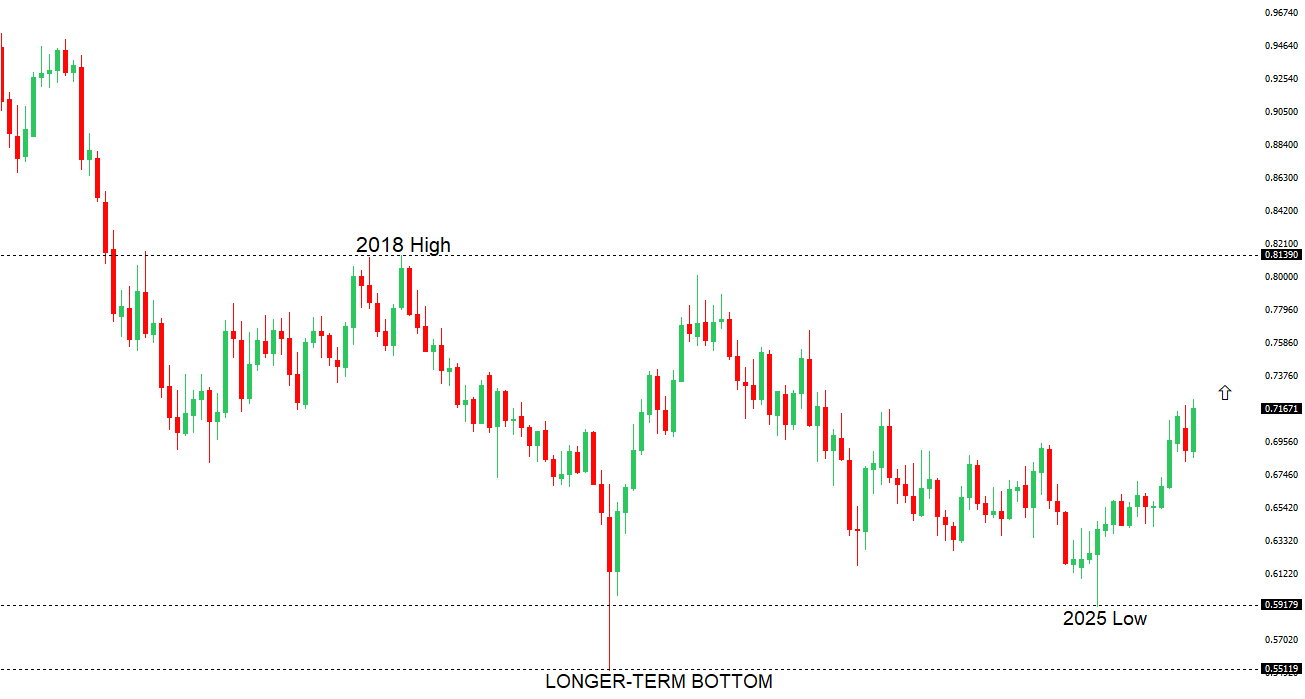
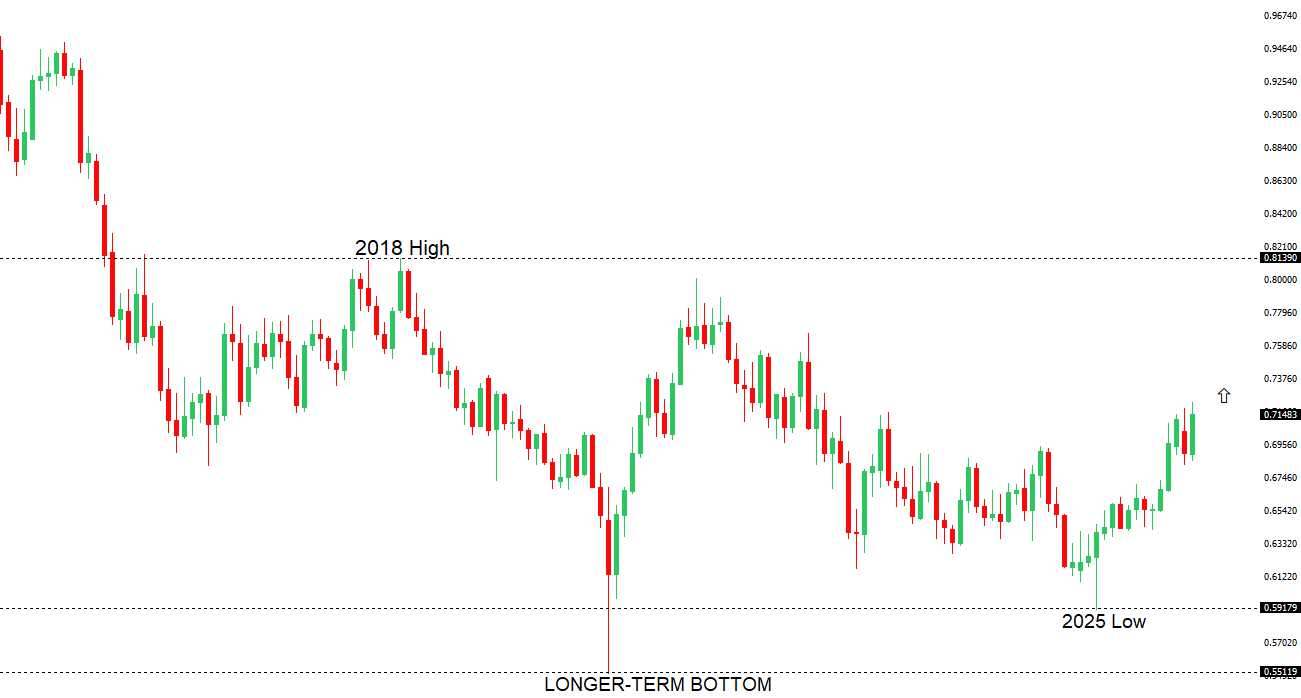
AUDUSD: technical overview

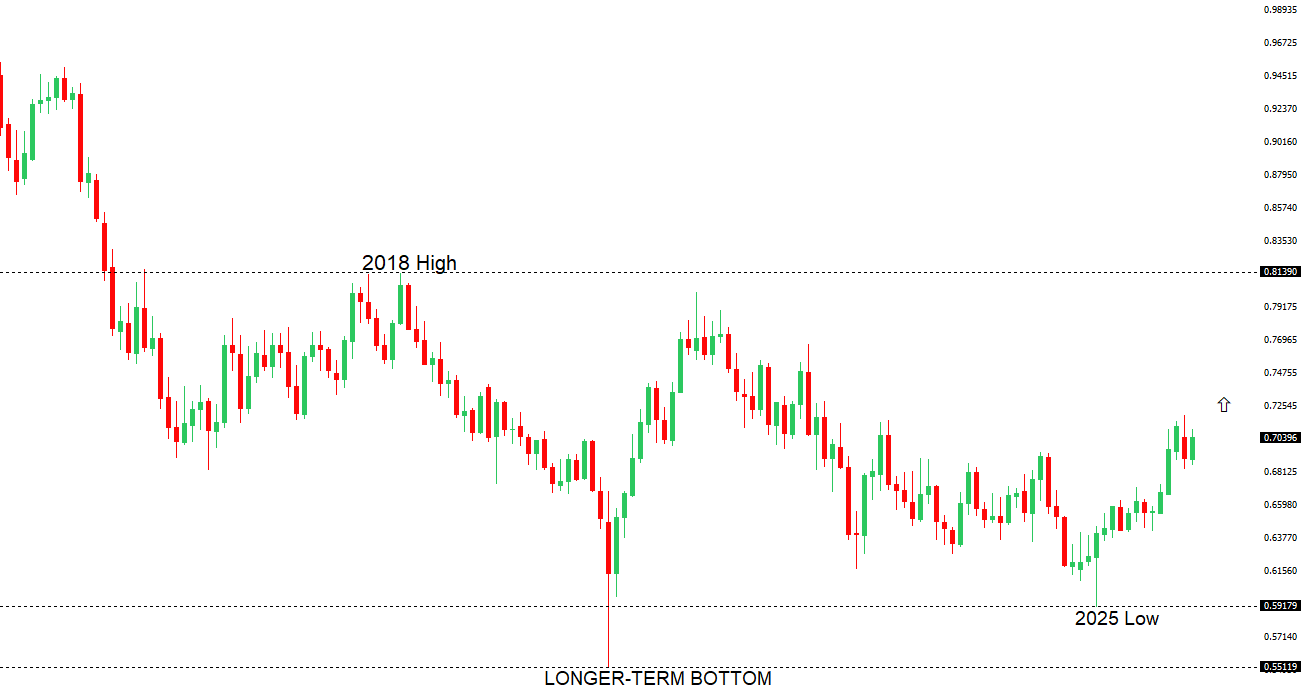
There are signs of the formation of a longer-term base with the market recovering out from a meaningful longer-term support zone. The latest monthly close back above 0.7000 takes the big picture pressure off the downside and strengthens the case for a bottom, with the focus now on a push towards 0.8000. Setbacks should now be well supported ahead of 0.6700.

AUDUSD Chart
R2 0.7200 - Figure - Medium
R1 0.7188 - 11 March/2026 high - Medium
S1 0.6944 - 3 March low - Medium
S2 0.6897 - 6 February low - Strong
AUDUSD: fundamental overview

The Australian dollar is regaining momentum as markets widely expect the RBA to deliver a second consecutive rate hike to 4.10%. Rising energy prices linked to Iran tensions are likely to push Australian inflation back above 4% in Q2, increasing pressure on the RBA to maintain a tightening bias and making its forward guidance on inflation risks and policy outlook especially important. For the AUD, the mix of a more hawkish RBA and a global risk-off environment creates conflicting forces—rate expectations and a tight labor market offer support, while geopolitical tensions boost the USD and weigh on risk-sensitive currencies.

 
Suggested reading

Buffet’s Sage Advice About Fear And Greed Is A Trap, M. Hulbert, Marketwatch (March 14, 2026)

The Billion-Dollar AI Startup Founded by Teenagers, S. Vranica, Wall Street Journal (March 11, 2026)


Any opinions, news, research, analyses, prices or other information ("information") contained on this Blog, constitutes marketing communication and it has not been prepared in accordance with legal requirements designed to promote the independence of investment research. Further, the information contained within this Blog does not contain (and should not be construed as containing) investment advice or an investment recommendation, or an offer of, or solicitation for, a transaction in any financial instrument. LMAX Group has not verified the accuracy or basis-in-fact of any claim or statement made by any third parties as comments for every Blog entry.

LMAX Group will not accept liability for any loss or damage, including without limitation to, any loss of profit, which may arise directly or indirectly from use of or reliance on such information. No representation or warranty is given as to the accuracy or completeness of the above information. While the produced information was obtained from sources deemed to be reliable, LMAX Group does not provide any guarantees about the reliability of such sources. Consequently any person acting on it does so entirely at his or her own risk. It is not a place to slander, use unacceptable language or to promote LMAX Group or any other FX and CFD provider and any such postings, excessive or unjust comments and attacks will not be allowed and will be removed from the site immediately.

Day Image
13th March 2026 | view in browser
Dollar firms as geopolitics and yields dominate

The Dollar Index is pushing to fresh 2026 highs as rising geopolitical tensions around Iran, firm US yields, and oil nearing $100 support the dollar, all while markets brace for a heavy slate of data led by US core PCE and key UK and Canadian releases.


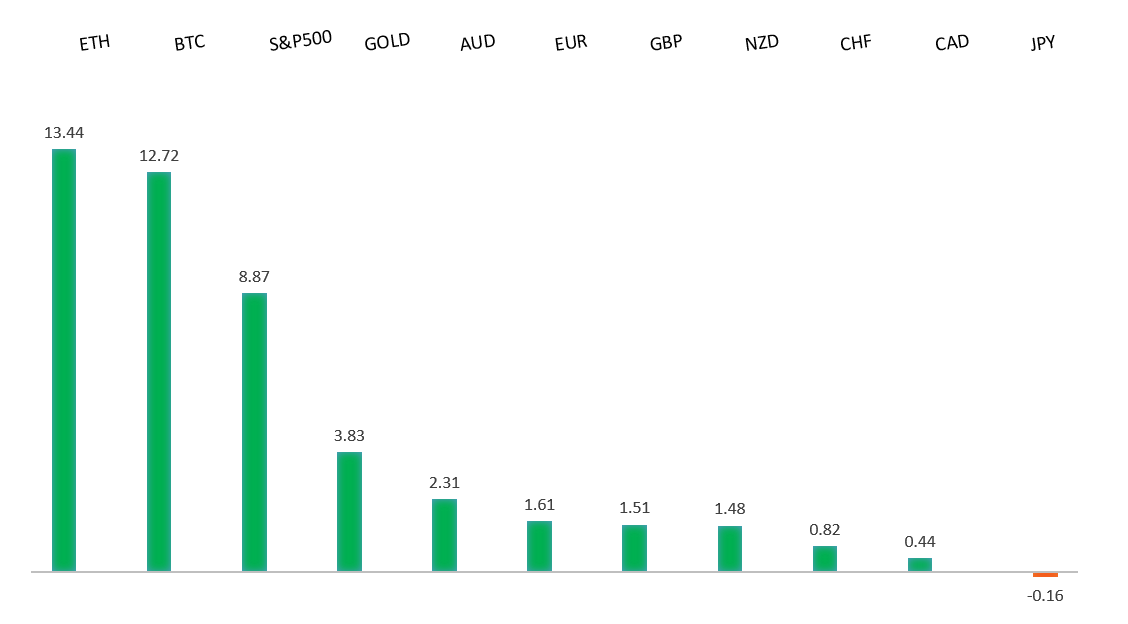
Performance chart 30day v. USD (%)
Performance Chart
 
 
Technical & fundamental highlights
EURUSD: technical overview

The Euro outlook remains constructive with higher lows sought out on dips in favor of the next major upside extension targeting the 2021 high at 1.2350. Setbacks should be exceptionally well supported ahead of 1.1400.

EURUSD Chart
R2 1.1707 - 3 March high - Strong
R1 1.1668 - 10 March high - Medium
S1 1.1469 - 5 November low - Strong
S2 1.1400 - Figure - Strong
EURUSD: fundamental overview

The euro is on track for a fourth straight day of losses, remaining below its 200-day moving average since breaking down on 3 March. The war has pushed oil prices up nearly 30% and European gas more than 50%, leading markets to price in roughly 20–25 bps of ECB tightening by July and about 40 bps by year-end, even though the central bank is widely expected to keep rates unchanged at next week’s meeting. While some policymakers warn that higher energy costs could lift inflation and bring rate hikes sooner than expected, the ECB—led by Christine Lagarde—is likely to maintain a cautious, data-dependent tone amid elevated uncertainty and softer growth risks. In the near term, this backdrop points to the euro staying range-bound with a downside bias, with rallies likely capped near the 200-day moving average unless US data or geopolitical developments materially shift the outlook.

 
USDJPY: technical overview

There are signs of the formation of a meaningful top after the market put in a multi-year high in 2024. At this point, rallies should be well capped above 160.00 in favor of a fresh down-leg back towards the 2024 low at 139.58. Only a monthly close above 160.00 negates.

USDJPY Chart
R2 160.00 - Psychological - Strong
R1 159.69 - 13 March/2026 high - Medium
S1 157.27 - 10 March low - Medium
S2 156.45 - 5 March low - Strong
USDJPY: fundamental overview

The yen is hovering near its weakest levels since July 2024, with USDJPY approaching the 160 area after recently hitting a fresh YTD high, raising renewed concerns about potential intervention. BOJ Governor Kazuo Ueda warned that a weaker yen could intensify imported inflation, especially as oil prices rise, while stressing that policymakers will monitor how FX moves impact the inflation outlook. The latest gains in USDJPY are being driven by a stronger dollar and surging energy costs, which are worsening Japan’s terms of trade and reinforcing a stagflation-like backdrop that pressures real incomes. With Brent crude back above $100 and Japan heavily reliant on imported energy, the environment continues to weigh on the yen, while markets increasingly believe the previous intervention “line in the sand” near 158–159 has shifted closer to 160–162. For now, policymakers appear more focused on preventing disorderly volatility than defending specific levels, and with oil elevated and US data firm, risks remain tilted toward a near-term push into the 160s.

 
AUDUSD: technical overview

There are signs of the formation of a longer-term base with the market recovering out from a meaningful longer-term support zone. The latest monthly close back above 0.7000 takes the big picture pressure off the downside and strengthens the case for a bottom, with the focus now on a push towards 0.8000. Setbacks should now be well supported ahead of 0.6700.

AUDUSD Chart
R2 0.7200 - Figure - Medium
R1 0.7188 - 11 March/2026 high - Medium
S1 0.6944 - 3 March low - Medium
S2 0.6897 - 6 February low - Strong
AUDUSD: fundamental overview

The Australian dollar is extending Thursday’s roughly 1.1% drop but still looks set to finish the week higher. Expectations for tighter policy are supporting the currency, with major banks now forecasting a 25bp RBA hike to 4.1% on March 17 and markets pricing about a two-thirds chance of the move, with some even anticipating another hike in May if energy-driven inflation persists. Strong demand from investors seeking higher Australian yields has also boosted AUD positioning.

 
Suggested reading

Why The Fed Needs To Ease Now, S. Grannis, Calafia Beach Pundit (March 10, 2026)

Money Is Not The Destination. It’s Only A Tool, D. Hagen, Meaningful Money (March 10, 2026)


Any opinions, news, research, analyses, prices or other information ("information") contained on this Blog, constitutes marketing communication and it has not been prepared in accordance with legal requirements designed to promote the independence of investment research. Further, the information contained within this Blog does not contain (and should not be construed as containing) investment advice or an investment recommendation, or an offer of, or solicitation for, a transaction in any financial instrument. LMAX Group has not verified the accuracy or basis-in-fact of any claim or statement made by any third parties as comments for every Blog entry.

LMAX Group will not accept liability for any loss or damage, including without limitation to, any loss of profit, which may arise directly or indirectly from use of or reliance on such information. No representation or warranty is given as to the accuracy or completeness of the above information. While the produced information was obtained from sources deemed to be reliable, LMAX Group does not provide any guarantees about the reliability of such sources. Consequently any person acting on it does so entirely at his or her own risk. It is not a place to slander, use unacceptable language or to promote LMAX Group or any other FX and CFD provider and any such postings, excessive or unjust comments and attacks will not be allowed and will be removed from the site immediately.

Day Image
12th March 2026 | view in browser
Oil risk premium returns, dollar firms

Oil is back on the bid amid escalating Middle East tensions and tanker attacks, boosting the U.S. dollar and putting USDJPY near intervention-watch levels, while markets turn to U.S. jobless claims and key global data for the next macro signal.


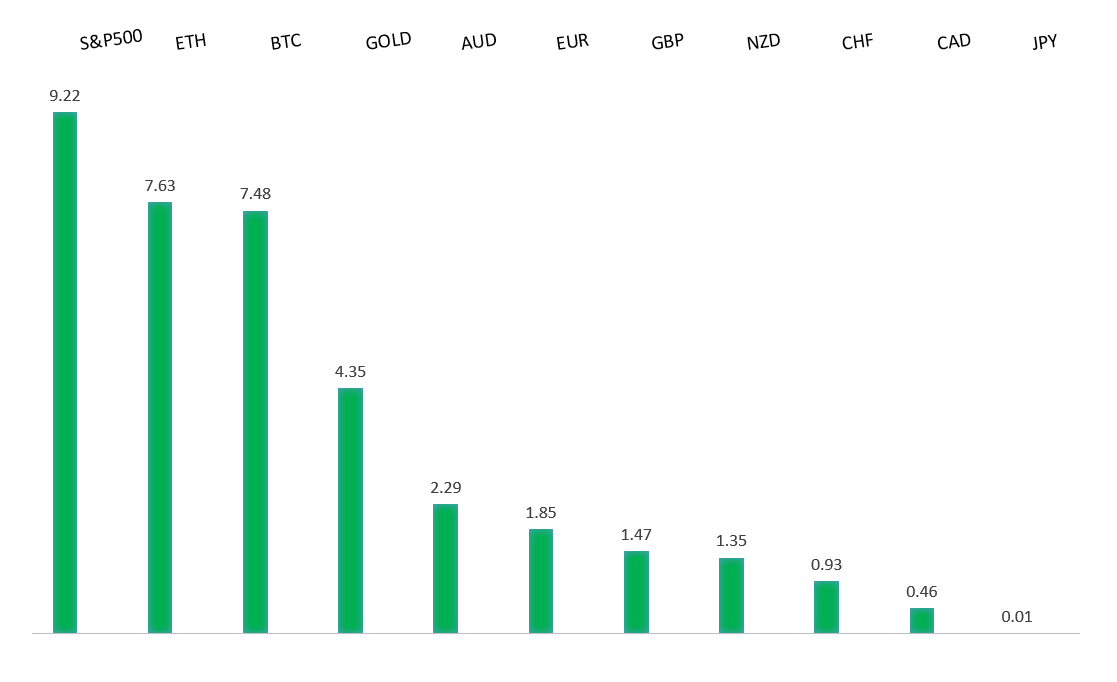
Performance chart 30day v. USD (%)
Performance Chart
 
 
Technical & fundamental highlights
EURUSD: technical overview

The Euro outlook remains constructive with higher lows sought out on dips in favor of the next major upside extension targeting the 2021 high at 1.2350. Setbacks should be exceptionally well supported ahead of 1.1400.

EURUSD Chart
R2 1.1707 - 3 March high - Strong
R1 1.1668 - 10 March high - Medium
S1 1.1507 - 9 March/2026 low - Medium
S2 1.1469 - 5 November low - Strong
EURUSD: fundamental overview

The euro is back under pressure into Thursday, though price action remains largely range-bound. The macro backdrop has turned slightly more supportive for the euro as the Iran war revives inflation concerns just as the ECB believed conditions were stabilizing. Comments from Peter Kazimir warning that upside inflation risks now “clearly dominate” have prompted markets to price in the possibility of an ECB rate hike by mid-year, with talk of further easing fading. Meanwhile, Isabel Schnabel reiterated that policy is currently in a “good place” but flagged the conflict as an upside inflation risk through energy prices, suggesting policymakers will likely stay on hold for now. Even with potential oil supply relief from coordinated reserve releases, persistent energy volatility and rising inflation expectations point to a higher euro inflation risk premium and a comparatively less dovish ECB than the Fed in the quarters ahead.

 
USDJPY: technical overview

There are signs of the formation of a meaningful top after the market put in a multi-year high in 2024. At this point, rallies should be well capped ahead of 160.00 in favor of a fresh down-leg back towards the 2024 low at 139.58.

USDJPY Chart
R2 159.46 - 14 January/2026 high - Strong
R1 159.24 - 12 March high - Medium
S1 157.27 - 10 March low - Medium
S2 156.45 - 5 March low - Strong
USDJPY: fundamental overview

The major pair is holding just below the January 14 YTD high of 159.45 as the yen continues to struggle. Japan’s decision to release 80 million barrels from its strategic reserves as part of a coordinated IEA effort highlights policymakers’ focus on containing energy-driven inflation amid Middle East tensions, though the yen remains weighed down by Japan’s heavy reliance on imported energy. Business sentiment has softened slightly but remains expansionary, while higher oil prices and stagflation pressures are reinforcing expectations for more fiscal support. At the same time, strong demand at the latest 5-year JGB auction and softer rate-hike expectations have capped yields, keeping policy divergence and carry dynamics tilted against the yen, with markets still comfortable holding USDJPY despite intervention warnings.

 
AUDUSD: technical overview

There are signs of the formation of a longer-term base with the market recovering out from a meaningful longer-term support zone. The latest monthly close back above 0.7000 takes the big picture pressure off the downside and strengthens the case for a bottom, with the focus now on a push towards 0.8000. Setbacks should now be well supported ahead of 0.6700.

AUDUSD Chart
R2 0.7200 - Figure - Medium
R1 0.7188 - 11 March/2026 high - Medium
S1 0.6944 - 3 March low - Medium
S2 0.6897 - 6 February low - Strong
AUDUSD: fundamental overview

The Australian dollar is cooling off today, giving back Wednesday’s gain that had taken the currency to its highest level against the Buck since June 2022. Still, expectations for a near-term RBA rate hike continue to provide support into dips. Consumer inflation expectations rose to 5.2% in March, the highest since July 2023, while CPI remains above the RBA’s target and risks remain skewed higher amid the recent oil supply shock. With inflation projected to stay elevated for longer and major banks now anticipating a 25bp hike next week, markets are pricing roughly a 70% chance of tightening, helping underpin AUD strength alongside strong commodity prices and a widening Australia–U.S. yield spread.

 
Suggested reading

Why Is It So Hard to Predict Financial Markets?, J. Wiggins, Behavioural Investment (March 10, 2026)

Five Scenarios For How The War With Iran Might End, H. Scribner, Axios (March 10, 2026)


Any opinions, news, research, analyses, prices or other information ("information") contained on this Blog, constitutes marketing communication and it has not been prepared in accordance with legal requirements designed to promote the independence of investment research. Further, the information contained within this Blog does not contain (and should not be construed as containing) investment advice or an investment recommendation, or an offer of, or solicitation for, a transaction in any financial instrument. LMAX Group has not verified the accuracy or basis-in-fact of any claim or statement made by any third parties as comments for every Blog entry.

LMAX Group will not accept liability for any loss or damage, including without limitation to, any loss of profit, which may arise directly or indirectly from use of or reliance on such information. No representation or warranty is given as to the accuracy or completeness of the above information. While the produced information was obtained from sources deemed to be reliable, LMAX Group does not provide any guarantees about the reliability of such sources. Consequently any person acting on it does so entirely at his or her own risk. It is not a place to slander, use unacceptable language or to promote LMAX Group or any other FX and CFD provider and any such postings, excessive or unjust comments and attacks will not be allowed and will be removed from the site immediately.

Day Image
11th March 2026 | view in browser
Macro focus shifts to US inflation

Markets begin the day cautiously as investors assess rising geopolitical tensions, developments in oil markets, and the upcoming US CPI inflation report.


Performance chart 30day v. USD (%)
Performance Chart
 
 
Technical & fundamental highlights
EURUSD: technical overview

The Euro outlook remains constructive with higher lows sought out on dips in favor of the next major upside extension targeting the 2021 high at 1.2350. Setbacks should be exceptionally well supported ahead of 1.1400.

EURUSD Chart
R2 1.1707 - 3 March high - Strong
R1 1.1668 - 10 March high - Medium
S1 1.1507 - 9 March/2026 low - Medium
S2 1.1469 - 5 November low - Strong
EURUSD: fundamental overview

The euro has recovered most of Tuesday’s losses. ECB President Christine Lagarde signaled that the euro area is better positioned than in 2022–23 to handle an Iran-related energy shock, while emphasizing the ECB will act if rising energy costs threaten to push inflation meaningfully above its 2% target. Markets briefly priced in nearly two rate hikes for 2026 after the oil spike, but expectations have since eased to less than one hike as de-escalation headlines emerged and policymakers reinforced a cautious “wait-and-see” stance. Overall, ECB officials suggest they will tolerate near-term volatility but remain ready to respond if higher energy prices begin feeding into wages and services inflation, leaving policy risks slightly tilted toward tighter settings if the shock proves persistent.

 
USDJPY: technical overview

There are signs of the formation of a meaningful top after the market put in a multi-year high in 2024. At this point, rallies should be well capped ahead of 160.00 in favor of a fresh down-leg back towards the 2024 low at 139.58.

USDJPY Chart
R2 159.46 - 14 January/2026 high - Strong
R1 158.91 - 9 March high - Medium
S1 156.45 - 5 March low - Medium
S2 155.34 - 25 February low - Medium
USDJPY: fundamental overview

The yen remains under pressure against the dollar, with USDJPY approaching Monday’s 6.5-week high near 158.9. Softer February PPI data — up 2.0% YoY and down 0.1% MoM — suggests some easing in upstream price pressures, though producer inflation remains relatively elevated overall. While the BOJ has only recently lifted rates to 0.75% and continues to signal the possibility of further hikes, Japan’s expansionary fiscal stance, improving growth, and efforts to sustain inflation through wage gains point to ongoing medium-term yen weakness. Near-term direction will largely hinge on oil prices and the Iran conflict, with volatility in energy markets influencing BOJ expectations; however, even if tensions ease and markets price an April hike, structural factors are expected to limit USDJPY downside.

 
AUDUSD: technical overview

There are signs of the formation of a longer-term base with the market recovering out from a meaningful longer-term support zone. The latest monthly close back above 0.7000 takes the big picture pressure off the downside and strengthens the case for a bottom, with the focus now on a push towards 0.8000. Setbacks should now be well supported ahead of 0.6700.

AUDUSD Chart
R2 0.7200 - Figure - Medium
R1 0.7186 - 11 March/2026 high - Medium
S1 0.6944 - 3 March low - Medium
S2 0.6897 - 6 February low - Strong
AUDUSD: fundamental overview

The Australian dollar is the top performer today, reaching a new year-to-date high. The move follows hawkish comments from RBA Deputy Governor Andrew Hauser, who warned that the economy has limited spare capacity and that rising oil prices linked to the Iran conflict could add to inflation pressures. Markets have sharply increased expectations for further tightening, now pricing about a 65% chance of a 25bp rate hike at the March 17 RBA meeting and roughly 58bp of hikes over the rest of the year.

 
Suggested reading

As Sentiment Declines, Stock Market Upside Rises, Fisher Investments (March 6, 2026)

The Fed Has A Big Problem On Their Hands, S. Varghese, Carson Group (March 6, 2026)


Any opinions, news, research, analyses, prices or other information ("information") contained on this Blog, constitutes marketing communication and it has not been prepared in accordance with legal requirements designed to promote the independence of investment research. Further, the information contained within this Blog does not contain (and should not be construed as containing) investment advice or an investment recommendation, or an offer of, or solicitation for, a transaction in any financial instrument. LMAX Group has not verified the accuracy or basis-in-fact of any claim or statement made by any third parties as comments for every Blog entry.

LMAX Group will not accept liability for any loss or damage, including without limitation to, any loss of profit, which may arise directly or indirectly from use of or reliance on such information. No representation or warranty is given as to the accuracy or completeness of the above information. While the produced information was obtained from sources deemed to be reliable, LMAX Group does not provide any guarantees about the reliability of such sources. Consequently any person acting on it does so entirely at his or her own risk. It is not a place to slander, use unacceptable language or to promote LMAX Group or any other FX and CFD provider and any such postings, excessive or unjust comments and attacks will not be allowed and will be removed from the site immediately.

Day Image
10th March 2026 | view in browser
Markets steady as oil pulls back from war spike

Markets are starting the day cautiously as oil prices retreat from a sharp geopolitical-driven spike, the dollar softens slightly, and investors await fresh developments on the Iran conflict alongside key global data and US macro releases.


Performance chart 30day v. USD (%)
Performance Chart
 
 
Technical & fundamental highlights
EURUSD: technical overview

The Euro outlook remains constructive with higher lows sought out on dips in favor of the next major upside extension targeting the 2021 high at 1.2350. Setbacks should be exceptionally well supported ahead of 1.1400.

EURUSD Chart
R2 1.1707 - 3 March high - Strong
R1 1.1655 - 4 March high - Medium
S1 1.1507 - 9 March/2026 low - Medium
S2 1.1469 - 5 November low - Strong
EURUSD: fundamental overview

The euro is consolidating Monday’s modest gains following a round of intense setbacks, as markets rapidly reprice the ECB outlook following another energy shock. With oil surging and European gas prices up significantly, traders are now pricing around 1–2 ECB rate hikes this year, pushing German yields higher but reviving concerns about Europe’s energy vulnerability and stagflation risks. While higher yields offer some limited support for the euro, the backdrop of fragile growth, weaker sentiment data, and tightening financial conditions suggests any rallies may be short-lived and heavily dependent on policy expectations and energy price dynamics rather than a strong economic recovery.

 
USDJPY: technical overview

There are signs of the formation of a meaningful top after the market put in a multi-year high in 2024. At this point, rallies should be well capped ahead of 160.00 in favor of a fresh down-leg back towards the 2024 low at 139.58.

USDJPY Chart
R2 159.46 - 14 January/2026 high - Strong
R1 158.91 - 9 March high - Medium
S1 156.45 - 5 March low - Medium
S2 155.34 - 25 February low - Medium
USDJPY: fundamental overview

The yen remains close to Monday’s roughly six-week low (USDJPY high) as Iran-related supply risks keep oil elevated, highlighting Japan’s worsening terms of trade. Because Japan imports most of its energy from the Middle East, higher oil prices threaten a stagflationary hit—squeezing growth while lifting inflation and eroding already weak real incomes. The yen is therefore caught between opposing forces: rising imported inflation and the possibility of earlier BOJ tightening on one side, and weaker growth, fiscal worries, and safe-haven USD demand on the other. Markets currently see only about a 50% chance of a BOJ hike by April, though some analysts warn USDJPY could drift toward the 160 intervention zone if expectations for tightening fade, while others argue the BOJ may instead bring forward rate hikes as higher oil pushes inflation further above target.

 
AUDUSD: technical overview

There are signs of the formation of a longer-term base with the market recovering out from a meaningful longer-term support zone. A monthly close back above 0.7000 will take the big picture pressure off the downside and strengthen case for a bottom. Setbacks should now be well supported ahead of 0.6700.

AUDUSD Chart
R2 0.7158 - 2023 high - Strong
R1 0.7147 - 12 February/2026 high - Strong
S1 0.6944 - 3 March low - Medium
S2 0.6897 - 6 February low - Strong
AUDUSD: fundamental overview

The Australian dollar has held up well into the latest dip. Australia is seeing mixed effects from the latest surge in global energy prices: higher LNG and coal prices are boosting export revenues and supporting the country’s terms of trade, which should provide some near-term support for the AUD. However, rising fuel import costs are pushing up inflation and weighing on household spending, likely slowing domestic growth. As a result, while stronger commodity exports may offer short-term resilience for the currency, softer economic momentum and cautious risk sentiment could limit sustained upside.

 
Suggested reading

The Fed Isn’t Independent, It Never Was, and It Doesn’t Matter, J. Tamny, Forbes (March 8, 2026)

Crypto Coin Is Gobbling Up U.S. Treasuries, T. Smith, NY Times (March 8, 2026)


Any opinions, news, research, analyses, prices or other information ("information") contained on this Blog, constitutes marketing communication and it has not been prepared in accordance with legal requirements designed to promote the independence of investment research. Further, the information contained within this Blog does not contain (and should not be construed as containing) investment advice or an investment recommendation, or an offer of, or solicitation for, a transaction in any financial instrument. LMAX Group has not verified the accuracy or basis-in-fact of any claim or statement made by any third parties as comments for every Blog entry.

LMAX Group will not accept liability for any loss or damage, including without limitation to, any loss of profit, which may arise directly or indirectly from use of or reliance on such information. No representation or warranty is given as to the accuracy or completeness of the above information. While the produced information was obtained from sources deemed to be reliable, LMAX Group does not provide any guarantees about the reliability of such sources. Consequently any person acting on it does so entirely at his or her own risk. It is not a place to slander, use unacceptable language or to promote LMAX Group or any other FX and CFD provider and any such postings, excessive or unjust comments and attacks will not be allowed and will be removed from the site immediately.

Day Image
9th March 2026 | view in browser
Oil panic grips markets

Oil has surged to its highest level since mid-2022 amid escalating Middle East conflict and disruptions around the Strait of Hormuz, driving sharp risk-off sentiment as investors shift focus away from recent weak U.S. payrolls data toward intensifying geopolitical risks.


Performance chart 30day v. USD (%)
Performance Chart
 
 
Technical & fundamental highlights
EURUSD: technical overview

The Euro outlook remains constructive with higher lows sought out on dips in favor of the next major upside extension targeting the 2021 high at 1.2350. Setbacks should be exceptionally well supported ahead of 1.1400.

EURUSD Chart
R2 1.1707 - 3 March high - Strong
R1 1.1655 - 4 March high - Medium
S1 1.1507 - 9 March/2026 low - Medium
S2 1.1469 - 5 November low - Strong
EURUSD: fundamental overview

The euro extended declines to another yearly low as investors rotated into the dollar amid rising geopolitical tensions. While the pair has since seen dip-buying interest, markets remain sensitive to headlines and event risk, with traders now fully pricing at least one ECB rate hike in 2026 even as policymakers signal policy is already in a “good place.” Recent Eurozone data showed slightly softer Q4 growth but still supported by solid domestic demand, and Europe’s resilience—helped by stronger intra-EU trade and a firmer stance on US tariffs—has made aggressive euro selling harder to justify. Looking ahead, risks remain two-sided: energy price spikes and stagflation fears could cap EUR gains, while expectations for eventual ECB tightening may help limit downside.

 
USDJPY: technical overview

There are signs of the formation of a meaningful top after the market put in a multi-year high in 2024. At this point, rallies should be well capped ahead of 160.00 in favor of a fresh down-leg back towards the 2024 low at 139.58.

USDJPY Chart
R2 159.46 - 14 January/2026 high - Strong
R1 158.91 - 9 March high - Medium
S1 156.45 - 5 March low - Medium
S2 155.34 - 25 February low - Medium
USDJPY: fundamental overview

The yen weakened further against the dollar in Monday’s Asian session, with USDJPY pushing towards 159. The currency is being pulled by competing forces: strong broad dollar demand and energy-import pressures weighing on the yen, while expectations for narrowing Fed–BOJ policy divergence and rising Japanese yields offer potential support. Japanese officials are increasingly acknowledging that yen weakness is feeding into inflation, and while markets doubt verbal intervention alone will have much impact, the move toward 160 keeps the risk of action alive. At the same time, stronger wage growth and persistent inflation pressures are reinforcing the case for continued BOJ policy normalization, with markets assigning meaningful odds to a possible rate hike as soon as April.

 
AUDUSD: technical overview

There are signs of the formation of a longer-term base with the market recovering out from a meaningful longer-term support zone. A monthly close back above 0.7000 will take the big picture pressure off the downside and strengthen case for a bottom. Setbacks should now be well supported ahead of 0.6700.

AUDUSD Chart
R2 0.7158 - 2023 high - Strong
R1 0.7147 - 12 February/2026 high - Strong
S1 0.6944 - 3 March low - Medium
S2 0.6897 - 6 February low - Strong
AUDUSD: fundamental overview

The Australian dollar fell earlier today, as global risk sentiment weakened amid escalating geopolitical tensions and a sharp rise in oil prices. Markets have responded by sharply repricing the RBA outlook, with roughly a 30% chance of a 25bp hike at the 17 March meeting and about 65bp of tightening priced for the rest of the year, reflecting growing inflation risks from higher energy costs. Australian bond yields have surged while policymakers warn that rising fuel prices could push inflation expectations higher. At the same time, softer domestic data and cautious household spending highlight a fragile economic backdrop, though some analysts still see scope for a more hawkish RBA path supporting the AUD over the medium term.

 
Suggested reading

What If the Iran War Is Not Short-Lived?, S. Hansen, Morningstar (March 3, 2026)

How Markets Perform Amid Geopolitical Uncertainty, G. Smith, LPL Financial (March 5, 2026)


Any opinions, news, research, analyses, prices or other information ("information") contained on this Blog, constitutes marketing communication and it has not been prepared in accordance with legal requirements designed to promote the independence of investment research. Further, the information contained within this Blog does not contain (and should not be construed as containing) investment advice or an investment recommendation, or an offer of, or solicitation for, a transaction in any financial instrument. LMAX Group has not verified the accuracy or basis-in-fact of any claim or statement made by any third parties as comments for every Blog entry.

LMAX Group will not accept liability for any loss or damage, including without limitation to, any loss of profit, which may arise directly or indirectly from use of or reliance on such information. No representation or warranty is given as to the accuracy or completeness of the above information. While the produced information was obtained from sources deemed to be reliable, LMAX Group does not provide any guarantees about the reliability of such sources. Consequently any person acting on it does so entirely at his or her own risk. It is not a place to slander, use unacceptable language or to promote LMAX Group or any other FX and CFD provider and any such postings, excessive or unjust comments and attacks will not be allowed and will be removed from the site immediately.

Day Image
6th March 2026 | view in browser
Payrolls, policy shifts and energy risks

Global markets enter the day focused on rising geopolitical and energy tensions around the Strait of Hormuz, new U.S. policy moves on AI chips and Iran, Trump’s nomination of Kevin Warsh as Fed Chair, and key data ahead including Eurozone GDP and a softer U.S. jobs report that could shape expectations for the Fed’s policy path.


Performance chart 30day v. USD (%)
Performance Chart
 
 
Technical & fundamental highlights
EURUSD: technical overview

The Euro outlook remains constructive with higher lows sought out on dips in favor of the next major upside extension targeting the 2021 high at 1.2350. Setbacks should be exceptionally well supported ahead of 1.1500.

EURUSD Chart
R2 1.1835 - 23 February high - Strong
R1 1.1707 - 3 March high - Medium
S1 1.1575 - 4 March low - Medium
S2 1.1530 - 3 March /2026 low - Strong
EURUSD: fundamental overview

The euro has fully reversed the January rally and has fallen about 1.7% this week. At the same time, the ECB increasingly sees the escalating US-Iran conflict as an upside risk to euro-area inflation through higher energy prices, though officials still view markets as orderly and are not signaling an immediate policy shift. Policymakers broadly suggest they will tolerate temporary energy spikes but could act if inflation expectations begin to drift, leaving near-term euro pricing more sensitive to energy and inflation-expectations data than to growth surprises. Meanwhile, the February ECB minutes confirmed a unanimous decision to hold rates near the 2% inflation target with “full optionality,” an outlook now being tested by rising geopolitical risks.

 
USDJPY: technical overview

There are signs of a meaningful top in place after the market put in a multi-year high in 2024. At this point, rallies should be well capped ahead of 160.00 in favor of a fresh down-leg back towards the 2024 low at 139.58. The recent break below 154.39 strengthens the outlook.

USDJPY Chart
R2 159.46 - 14 January/2026 high - Strong
R1 157.97 - 3 March high - Medium
S1 155.34 - 25 February low - Medium
S2 154.00 - 23 February low - Medium
USDJPY: fundamental overview

The yen traded mostly steady in Asia and is only modestly weaker against the dollar year-to-date, though renewed energy security concerns are emerging after Japan was warned of limited support to offset disruptions around the Strait of Hormuz. Given Japan’s heavy reliance on imported energy, higher fuel costs could complicate fiscal expansion plans and add to inflation pressures, with at least one refiner already cancelling March exports amid expectations of higher prices. USDJPY remains pulled between Japan’s energy vulnerability and the Fed-BOJ policy gap, versus safe-haven demand and the risk of official intervention if the yen weakens too quickly. Still, scope exists for yen strength if carry trades unwind and domestic yields rise, while ongoing wage growth and expectations of gradual BOJ tightening continue to support the medium-term outlook for the currency.

 
AUDUSD: technical overview

There are signs of the formation of a longer-term base with the market recovering out from a meaningful longer-term support zone. A monthly close back above 0.7000 will take the big picture pressure off the downside and strengthen case for a bottom. Setbacks should now be well supported ahead of 0.6700.

AUDUSD Chart
R2 0.7158 - 2023 high - Strong
R1 0.7147 - 12 February/2026 high - Strong
S1 0.6944 - 3 March low - Medium
S2 0.6897 - 6 February low - Strong
AUDUSD: fundamental overview

The Australian dollar is modestly bid today, recovering roughly half of Thursday’s near 1% drop, though it remains capped below 0.7100. Recent data point to a softer backdrop, with Australia’s January trade surplus narrowing to A$2.6b as exports fell and imports rebounded, while trade with China rose sharply, highlighting Australia’s heavy reliance on China even as the surplus with its largest partner shrinks. Domestically, a modest 0.3% rebound in January consumption—driven mostly by services and essentials—signals cautious households, suggesting demand momentum is cooling and raising the bar for further RBA tightening despite February’s rate hike.

 
Suggested reading

Why Japan’s Bond Market Matters To The US Economy, D. Lachman, AEIdeas (March 3, 2026)

On AI Eating The World, V. Katsenelson, The Intellectual Investor (March 5, 2026)


Any opinions, news, research, analyses, prices or other information ("information") contained on this Blog, constitutes marketing communication and it has not been prepared in accordance with legal requirements designed to promote the independence of investment research. Further, the information contained within this Blog does not contain (and should not be construed as containing) investment advice or an investment recommendation, or an offer of, or solicitation for, a transaction in any financial instrument. LMAX Group has not verified the accuracy or basis-in-fact of any claim or statement made by any third parties as comments for every Blog entry.

LMAX Group will not accept liability for any loss or damage, including without limitation to, any loss of profit, which may arise directly or indirectly from use of or reliance on such information. No representation or warranty is given as to the accuracy or completeness of the above information. While the produced information was obtained from sources deemed to be reliable, LMAX Group does not provide any guarantees about the reliability of such sources. Consequently any person acting on it does so entirely at his or her own risk. It is not a place to slander, use unacceptable language or to promote LMAX Group or any other FX and CFD provider and any such postings, excessive or unjust comments and attacks will not be allowed and will be removed from the site immediately.

Day Image
5th March 2026 | view in browser
Geopolitics keep USD supported, oil firm

The US dollar remains supported amid ongoing Middle East tensions as the Iran conflict enters day six, with oil firm, yields elevated on inflation concerns, equities slightly softer, central bank commentary in focus, and a busy global data calendar ahead while China signals a slower but more sustainable growth target.


Performance chart 30day v. USD (%)
Performance Chart
 
 
Technical & fundamental highlights
EURUSD: technical overview

The Euro outlook remains constructive with higher lows sought out on dips in favor of the next major upside extension targeting the 2021 high at 1.2350. Setbacks should be exceptionally well supported ahead of 1.1500.

EURUSD Chart
R2 1.1835 - 23 February high - Strong
R1 1.1707 - 3 March high - Medium
S1 1.1575 - 4 March low - Medium
S2 1.1530 - 3 March /2026 low - Strong
EURUSD: fundamental overview

The euro remains under pressure after a sharp two-day drop erased the January rally, despite a modest bounce. The decline reflects a stagflation-style energy shock tied to the Iran conflict, which has driven oil and European gas prices sharply higher while euro-area inflation has already surprised to the upside. Because Europe is highly dependent on imported energy priced in dollars, rising fuel costs act as a direct economic “tax,” weakening the euro even as they complicate ECB policy by keeping inflation elevated and growth uncertain. As long as energy prices stay high and central banks remain cautious, the balance of risks still favors further downside.

 
USDJPY: technical overview

There are signs of a meaningful top in place after the market put in a multi-year high in 2024. At this point, rallies should be well capped ahead of 160.00 in favor of a fresh down-leg back towards the 2024 low at 139.58. The recent break below 154.39 strengthens the outlook.

USDJPY Chart
R2 159.46 - 14 January/2026 high - Strong
R1 157.97 - 3 March high - Medium
S1 155.34 - 25 February low - Medium
S2 154.00 - 23 February low - Medium
USDJPY: fundamental overview

The yen is trying to hold onto recent gains on the back of  concerns about potential intervention. Japan’s Finance Minister Katayama reiterated that both Japan and the US could take “decisive action” under the G7 stable currency framework, with recent rate-check activity reminding markets that coordinated signalling can quickly trigger a yen squeeze. Short-dated options show rising demand for yen protection, suggesting traders are hedging near-term event and intervention risk rather than positioning for a broader yen bull trend. While risk aversion and falling US Treasury yields could support the yen, the Bank of Japan is still cautious about tightening policy given global uncertainties, meaning a sustained JPY rally may require either deeper risk-off conditions or a disorderly move in USDJPY toward the 160 “danger zone.”

 
AUDUSD: technical overview

There are signs of the formation of a longer-term base with the market recovering out from a meaningful longer-term support zone. A monthly close back above 0.7000 will take the big picture pressure off the downside and strengthen case for a bottom. Setbacks should now be well supported ahead of 0.6700.

AUDUSD Chart
R2 0.7158 - 2023 high - Strong
R1 0.7147 - 12 February/2026 high - Strong
S1 0.6944 - 3 March low - Medium
S2 0.6897 - 6 February low - Strong
AUDUSD: fundamental overview

The Australian dollar is under a little pressure, putting it on track to snap a six-week run of gains. January data was mixed, with the trade surplus narrowing to A$2.6b from A$3.4b as exports slipped 0.9%, while imports rose 0.8%, suggesting firmer domestic demand. Household spending rose 0.3% on the month but the annual pace of 4.6% came in below expectations. With Q4 GDP confirming solid economic momentum and steady private investment, dips toward the 0.69–0.70 area—particularly if driven by geopolitical headlines or yield swings—may offer opportunities to selectively accumulate AUD ahead of the mid-March RBA meeting, though escalating global growth concerns could still pressure the currency in the near term.

 
Suggested reading

A Sentiment Reaction, Not Catastrophe Prediction, Fisher Investments (March 3, 2026)

U.S. Treasuries Failing Their Biggest Test In Decades, M. Hulbert, Marketwatch (March 2, 2026)


Any opinions, news, research, analyses, prices or other information ("information") contained on this Blog, constitutes marketing communication and it has not been prepared in accordance with legal requirements designed to promote the independence of investment research. Further, the information contained within this Blog does not contain (and should not be construed as containing) investment advice or an investment recommendation, or an offer of, or solicitation for, a transaction in any financial instrument. LMAX Group has not verified the accuracy or basis-in-fact of any claim or statement made by any third parties as comments for every Blog entry.

LMAX Group will not accept liability for any loss or damage, including without limitation to, any loss of profit, which may arise directly or indirectly from use of or reliance on such information. No representation or warranty is given as to the accuracy or completeness of the above information. While the produced information was obtained from sources deemed to be reliable, LMAX Group does not provide any guarantees about the reliability of such sources. Consequently any person acting on it does so entirely at his or her own risk. It is not a place to slander, use unacceptable language or to promote LMAX Group or any other FX and CFD provider and any such postings, excessive or unjust comments and attacks will not be allowed and will be removed from the site immediately.

Day Image
4th March 2026 | view in browser
Geopolitics spike oil, stocks slide

Global markets are grappling with intense risk-off sentiment driven by escalating U.S.-Israel-Iran conflict, which has disrupted the Strait of Hormuz, spiked oil prices sharply, boosted safe-havens like gold and the dollar, pressured equities lower, and heightened inflation concerns, all while mixed economic signals from China, Japan, and upcoming US and Eurozone data add layers of uncertainty.


Performance chart 30day v. USD (%)
Performance Chart
 
 
Technical & fundamental highlights
EURUSD: technical overview

The Euro outlook remains constructive with higher lows sought out on dips in favor of the next major upside extension targeting the 2021 high at 1.2350. Setbacks should be exceptionally well supported ahead of 1.1500.

EURUSD Chart
R2 1.1835 - 23 February high - Strong
R1 1.1707 - 3 March high - Medium
S1 1.1577 - 19 January low - Medium
S2 1.1530 - 3 March /2026 low - Strong
EURUSD: fundamental overview

The euro has extended a sharp two-day decline, as the US-Israel conflict with Iran enters its fifth day. The move reflects a stagflation-style energy shock for Europe, with gas and oil prices surging amid Qatar LNG disruptions and Iran-related supply risks, pushing inflation higher while darkening the growth outlook. Although markets have shifted from expecting ECB easing to pricing a possible 2026 hike, the inflation surge is viewed as temporary and energy-driven, limiting support for the euro while risk-off sentiment and delayed Fed cuts favor the dollar. With European bonds under pressure and energy prices elevated, EURUSD remains biased to the downside unless geopolitical tensions and energy risks ease quickly.

 
USDJPY: technical overview

There are signs of a meaningful top in place after the market put in a multi-year high in 2024. At this point, rallies should be well capped ahead of 160.00 in favor of a fresh down-leg back towards the 2024 low at 139.58. The recent break below 154.39 strengthens the outlook.

USDJPY Chart
R2 159.46 - 14 January/2026 high - Strong
R1 157.97 - 3 March high - Medium
S1 155.34 - 25 February low - Medium
S2 154.00 - 23 February low - Medium
USDJPY: fundamental overview

The yen has held relatively steady on the day thus far. Japan’s February PMIs pointed to the fastest private-sector growth since May 2023, driven by solid services activity, stronger manufacturing output, and the biggest rise in new orders in about three years. Still, the currency remains under pressure due to Japan’s reliance on energy imports and the wide policy gap between the Fed and BOJ. While officials are watching markets closely and keeping the option of intervention on the table—especially if USDJPY moves toward 160.

 
AUDUSD: technical overview

There are signs of the formation of a longer-term base with the market recovering out from a meaningful longer-term support zone. A monthly close back above 0.7000 will take the big picture pressure off the downside and strengthen case for a bottom. Setbacks should now be well supported ahead of 0.6700.

AUDUSD Chart
R2 0.7158 - 2023 high - Strong
R1 0.7147 - 12 February/2026 high - Strong
S1 0.6944 - 3 March low - Medium
S2 0.6897 - 6 February low - Strong
AUDUSD: fundamental overview

The Australian Dollar has pulled back toward Tuesday’s 3.5-week low as rising global yields and caution around the Iran conflict weigh on higher-beta currencies. Australia’s Q4 2025 GDP rose 0.8% QoQ and 2.6% YoY, beating expectations and highlighting resilient domestic demand heading into the March RBA meeting. While policymakers are also watching inflation risks from higher oil prices, the RBA’s hawkish stance—emphasizing that every meeting is “live” and leaving the door open to a March hike—continues to provide underlying support for the Aussie. As a result, dips toward the 0.69–0.70 area may offer opportunities to accumulate AUD, particularly on crosses, even if broader risk sentiment and USD strength cap near-term upside.

 
Suggested reading

Stocks, Oil & Gas Can, Do Handle Regional Conflict, Fisher Investments (March 2, 2026)

What Does the War In Iran Mean For Your Investments?, S. McBride, RiskHedge (March 2, 2026)


Any opinions, news, research, analyses, prices or other information ("information") contained on this Blog, constitutes marketing communication and it has not been prepared in accordance with legal requirements designed to promote the independence of investment research. Further, the information contained within this Blog does not contain (and should not be construed as containing) investment advice or an investment recommendation, or an offer of, or solicitation for, a transaction in any financial instrument. LMAX Group has not verified the accuracy or basis-in-fact of any claim or statement made by any third parties as comments for every Blog entry.

LMAX Group will not accept liability for any loss or damage, including without limitation to, any loss of profit, which may arise directly or indirectly from use of or reliance on such information. No representation or warranty is given as to the accuracy or completeness of the above information. While the produced information was obtained from sources deemed to be reliable, LMAX Group does not provide any guarantees about the reliability of such sources. Consequently any person acting on it does so entirely at his or her own risk. It is not a place to slander, use unacceptable language or to promote LMAX Group or any other FX and CFD provider and any such postings, excessive or unjust comments and attacks will not be allowed and will be removed from the site immediately.

Day Image
3rd March 2026 | view in browser
War risk keeps markets on edge

Markets are starting the day in a cautious, risk-off tone as the escalating US-Israel conflict with Iran drives oil higher, supports the dollar and commodity currencies, pressures equities, and rekindles inflation concerns that are pushing yields up and keeping central bank policy firmly in focus.


Performance chart 30day v. USD (%)
Performance Chart
 
 
Technical & fundamental highlights
EURUSD: technical overview

The Euro outlook remains constructive with higher lows sought out on dips in favor of the next major upside extension targeting the 2021 high at 1.2350. Setbacks should be exceptionally well supported ahead of 1.1500.

EURUSD Chart
R2 1.1835 - 23 February high - Strong
R1 1.1742 - 19 February low - Medium
S1 1.1633 - 20 January low - Medium
S2 1.1577 - 19 January /2026 low - Strong
EURUSD: fundamental overview

The euro is extending its recent decline as renewed Middle East tensions have revived the dollar’s safe-haven appeal and pressured energy-importing currencies like the euro. The euro has slipped back under 1.17, giving up much of its early-year rally, with Europe seen as more vulnerable to higher oil and gas prices than the more energy-independent United States. Recent ECB comments signal no urgency to shift policy, reinforcing a near-term rate differential that favors the dollar. Unless Gulf tensions ease quickly, risks remain tilted toward further downside in EURUSD, though any de-escalation could trigger a rebound.

 
USDJPY: technical overview

There are signs of a meaningful top in place after the market put in a multi-year high in 2024. At this point, rallies should be well capped ahead of 160.00 in favor of a fresh down-leg back towards the 2024 low at 139.58. The recent break below 154.39 strengthens the outlook.

USDJPY Chart
R2 159.46 - 14 January/2026 high - Strong
R1 157.76 - 2 March high - Medium
S1 155.34 - 25 February low - Medium
S2 154.00 - 23 February low - Medium
USDJPY: fundamental overview

The yen is edging higher but USDJPY is still hovering in the 157s, as rising oil prices and a firm dollar offset typical safe-haven demand. BoJ Deputy Governor Himino struck a cautious tone, stressing that policy will depend heavily on Middle East developments and offering no signal of a near-term hike, while softer labor data reinforce a gradual approach. With Japan’s reliance on imported energy making the currency sensitive to higher oil prices, any yen gains are likely to be limited, keeping risks tilted toward renewed USDJPY upside toward 158 if US data stay firm. Although markets still expect modest tightening later this year, the near-term rate differential remains yen-negative, and further weakness could heighten rhetoric or intervention risks ahead of the upcoming US-Japan meeting.

 
AUDUSD: technical overview

There are signs of the formation of a longer-term base with the market recovering out from a meaningful longer-term support zone. A monthly close back above 0.7000 will take the big picture pressure off the downside and strengthen case for a bottom. Setbacks should now be well supported ahead of 0.6700.

AUDUSD Chart
R2 0.7158 - 2023 high - Strong
R1 0.7147 - 12 February/2026 high - Strong
S1 0.7007 - 9 February low - Medium
S2 0.6897 - 6 February low - Strong
AUDUSD: fundamental overview

The Australian dollar is relatively flat despite softer regional equities, supported by stronger-than-expected Q4 company profits, which climbed 5.8% versus a 1.9% forecast and showed broad-based strength across mining and services. While RBA Governor Michele Bullock warned that higher oil prices could lift inflation expectations, she stressed it’s too early to assess the net impact, noting that a sustained energy shock could also slow global growth. Overall, the data point to resilient domestic demand and firmer nominal income, reinforcing a hawkish RBA tilt and favoring AUD strength on crosses—particularly against low-yielders—even if broader USD strength caps AUDUSD upside.

 
Suggested reading

It’s Bullish When Mania Fears Collide with Dystopia, E. Dellinger, Fisher Investments (February 26, 2026)

Will Stablecoins Strenghthen Dollar, and Stall Rise of Gold?, M. Pompeo, RCM (March 2, 2026)


Any opinions, news, research, analyses, prices or other information ("information") contained on this Blog, constitutes marketing communication and it has not been prepared in accordance with legal requirements designed to promote the independence of investment research. Further, the information contained within this Blog does not contain (and should not be construed as containing) investment advice or an investment recommendation, or an offer of, or solicitation for, a transaction in any financial instrument. LMAX Group has not verified the accuracy or basis-in-fact of any claim or statement made by any third parties as comments for every Blog entry.

LMAX Group will not accept liability for any loss or damage, including without limitation to, any loss of profit, which may arise directly or indirectly from use of or reliance on such information. No representation or warranty is given as to the accuracy or completeness of the above information. While the produced information was obtained from sources deemed to be reliable, LMAX Group does not provide any guarantees about the reliability of such sources. Consequently any person acting on it does so entirely at his or her own risk. It is not a place to slander, use unacceptable language or to promote LMAX Group or any other FX and CFD provider and any such postings, excessive or unjust comments and attacks will not be allowed and will be removed from the site immediately.