Day Image
15th May 2026 | view in browser
Oil surge and yields climb as markets turn defensive

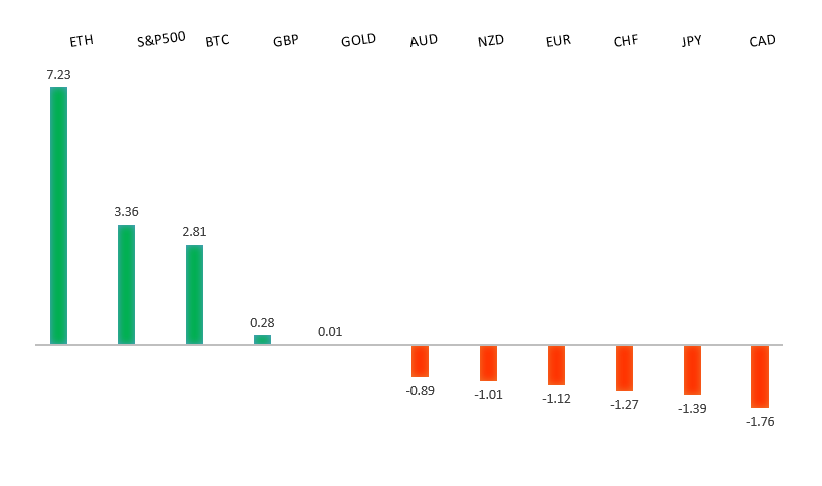
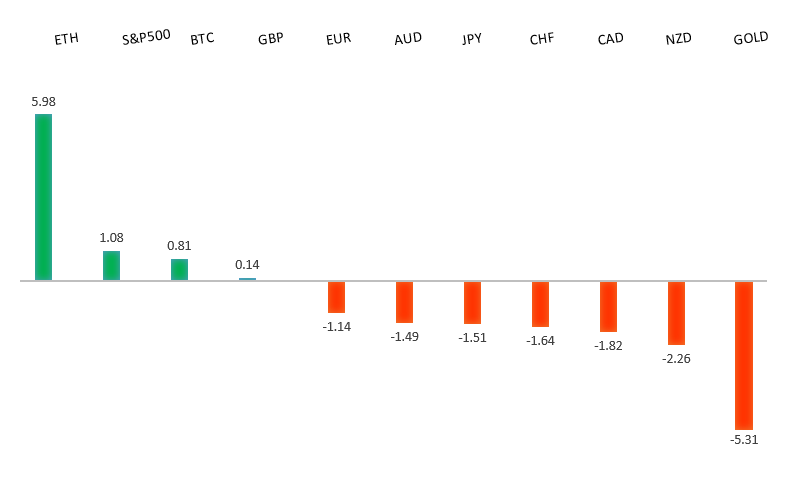
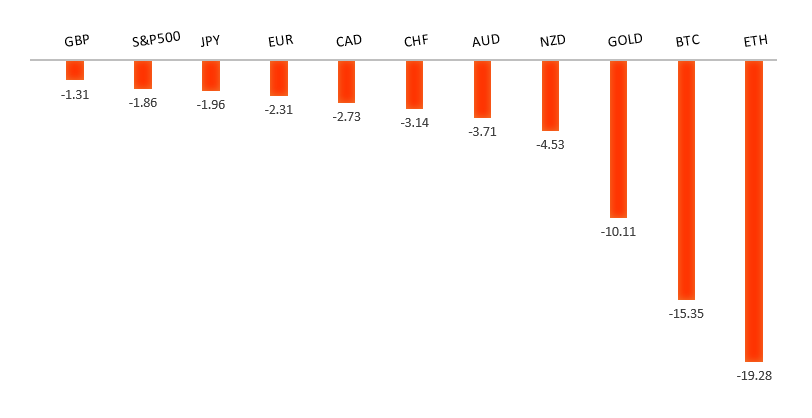
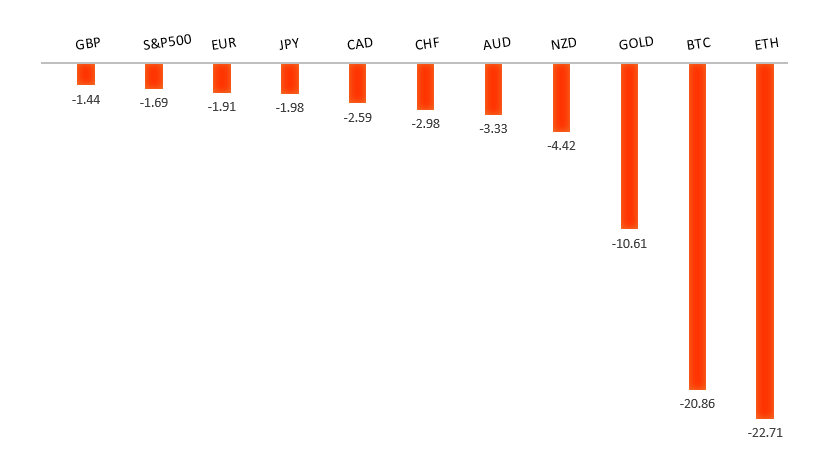
Rising geopolitical tensions around Iran are driving a risk-off shift across markets, with higher oil prices and bond yields supporting the dollar while weighing on equities, FX risk proxies, and precious metals.


Performance chart 30day v. USD (%)
Performance Chart
 
 
Technical & fundamental highlights
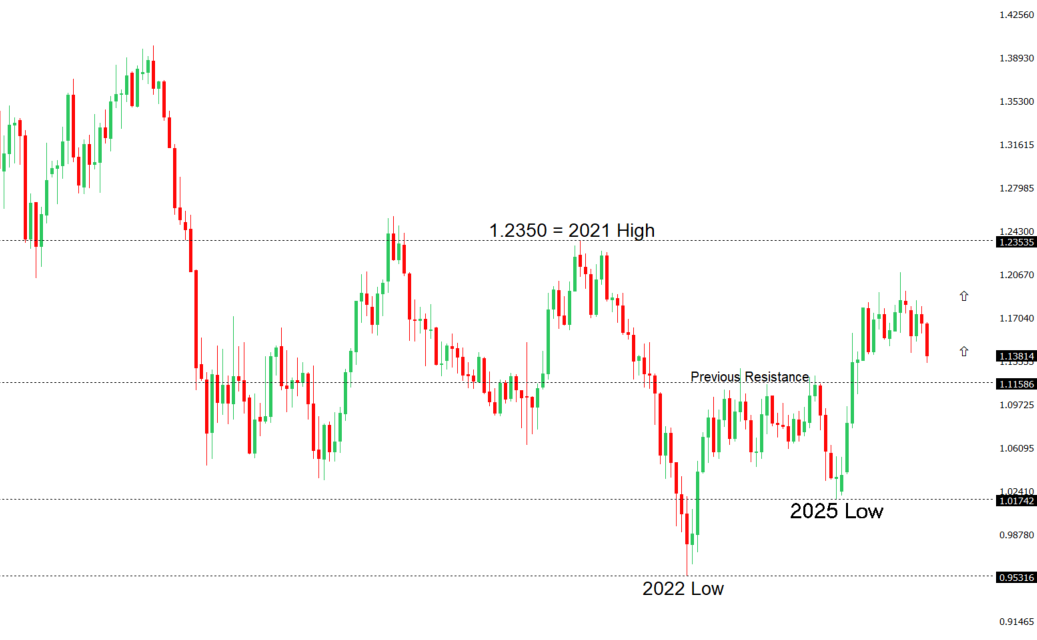
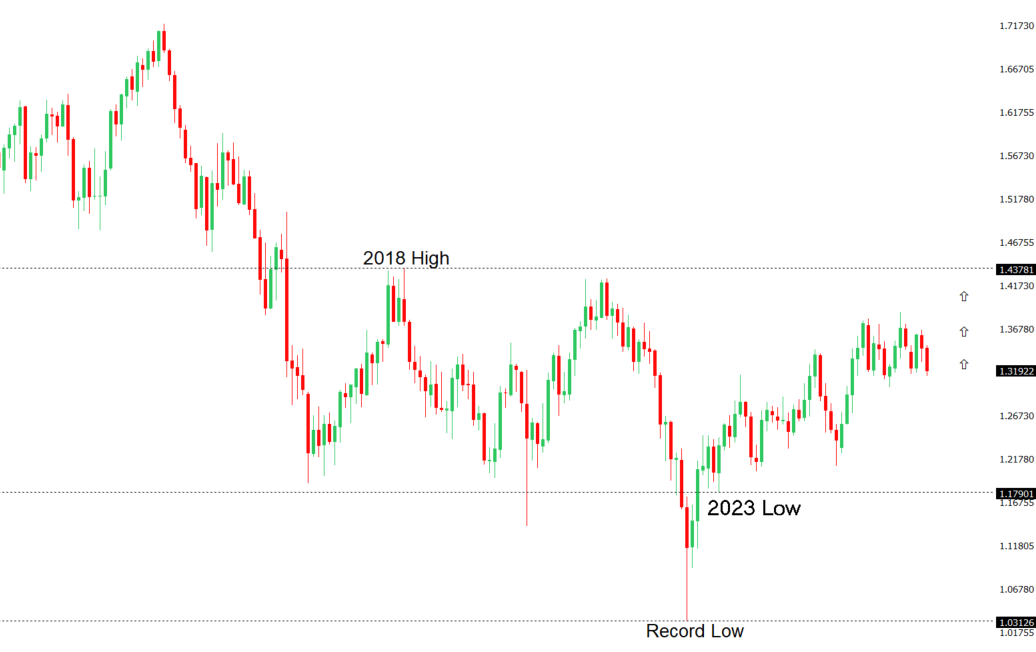
EURUSD: technical overview

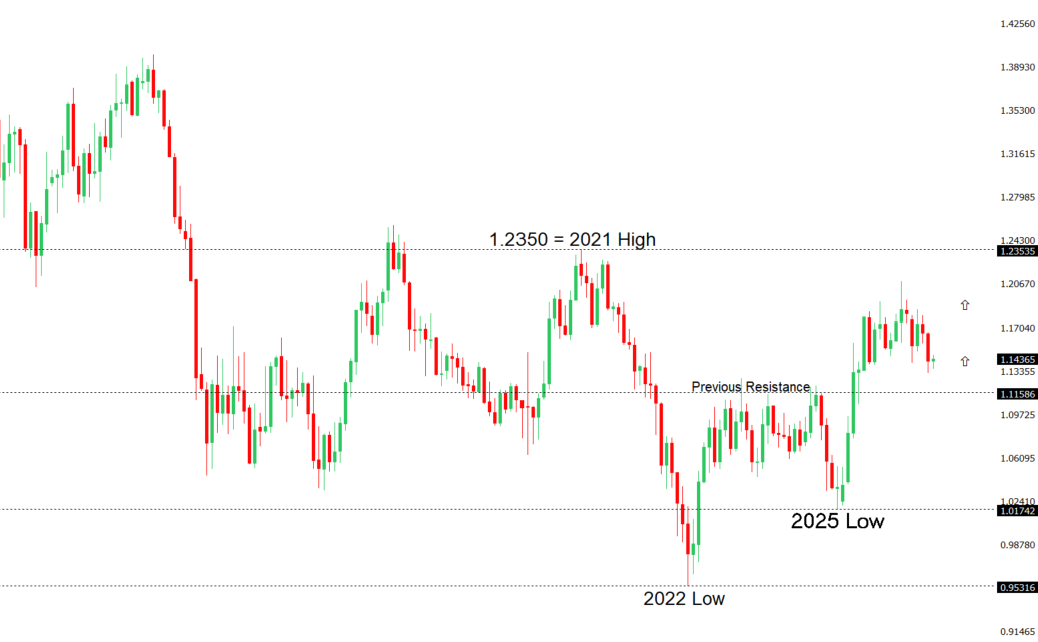
The Euro outlook remains constructive with higher lows sought out on dips in favor of the next major upside extension targeting the 2021 high at 1.2350. Setbacks should be exceptionally well supported ahead of 1.1300.

EURUSD Chart
R2 1.1850 - 17 April high - Strong
R1 1.1797 - 6 May high - Medium
S1 1.1643 - 15 May low - Medium
S2 1.1589 - 8 April low - Strong
EURUSD: fundamental overview

The euro has come under renewed fundamental pressure, driven primarily by a powerful shift in relative monetary policy expectations and stronger US macro data. A run of firm US releases—particularly resilient retail sales and hotter-than-expected CPI and PPI—has reinforced the “higher-for-longer” narrative around the Federal Reserve, with markets now largely pricing out rate cuts and even assigning some probability to further tightening. This has been compounded by hawkish Fed rhetoric emphasizing persistent inflation risks and economic resilience. At the same time, improving US-China relations and easing geopolitical tail risks (including commitments around the Strait of Hormuz) have supported broader risk sentiment but, more importantly, boosted the US Dollar via growth and stability channels. On the euro side, while expectations for a potential rate hike from the European Central Bank offer some offset, they have taken a back seat to the dominant USD story, with Eurozone data and inflation prints largely seen as secondary. The resulting widening in rate differentials and relative growth dynamics has tilted the near-term bias against the euro.

 
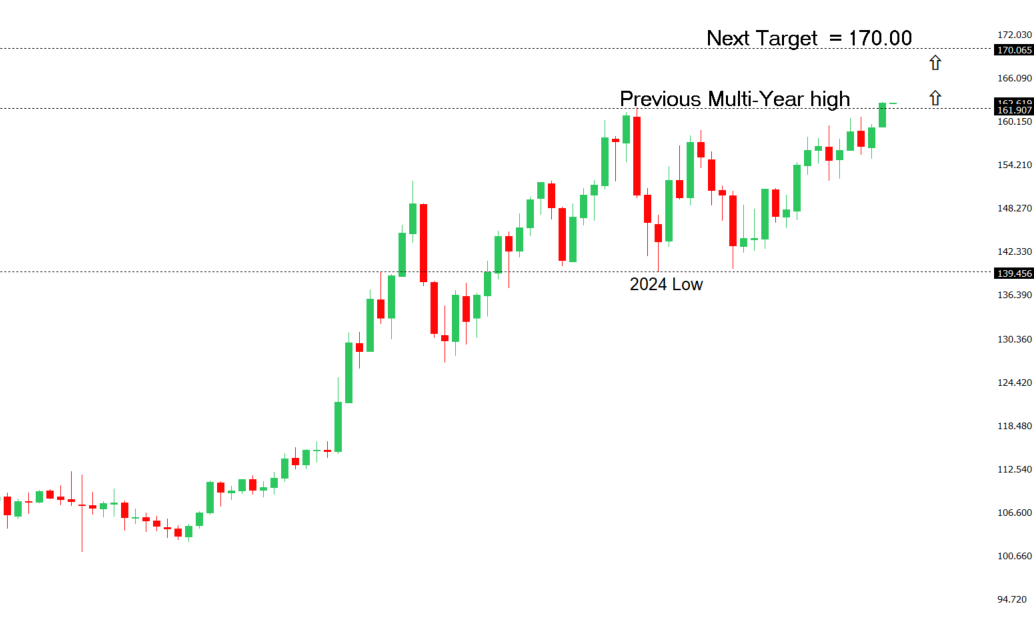
USDJPY: technical overview

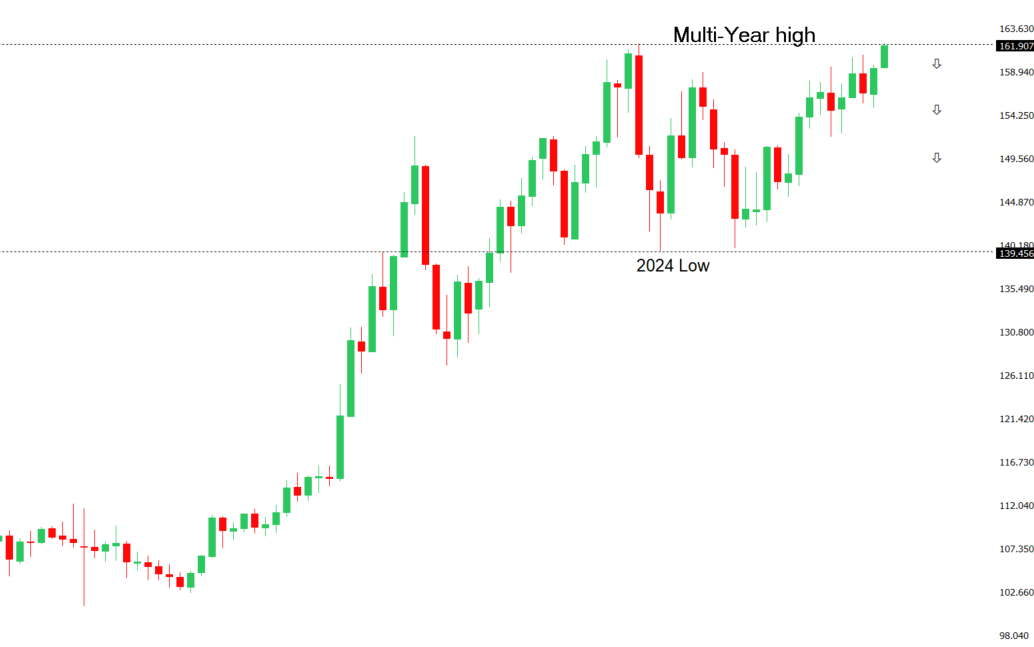
There are signs of the formation of a meaningful top after the market put in a multi-year high in 2024. At this point, rallies should be well capped above 160.00 in favor of a fresh down-leg back towards the 2024 low at 139.58. Only a monthly close above 160.00 negates.

USDJPY Chart
R2 159.53 - 17 April low - Medium
R1 159.00 - Figure - Medium
S1 157.29 - 14 May low - Medium
S2 155.02 - 6 May low - Strong
USDJPY: fundamental overview

The yen remains under sustained fundamental pressure, driven primarily by the wide and persistent yield differential with the U.S., alongside growing skepticism that Japan’s policy tools can meaningfully reverse the trend. A recent Reuters poll highlights that nearly three-quarters of economists see FX intervention as ineffective in curbing weakness, especially with USDJPY already reclaiming levels around 158.50 and erasing prior intervention impact. While expectations remain for gradual Bank of Japan tightening—with many looking for a move toward 1.00% as soon as June and 1.25% by Q4—there is clear hesitation amid external risks, particularly the ongoing Middle East conflict, which is exacerbating Japan’s terms-of-trade shock via higher energy import costs. This dynamic is reinforcing downside pressure on the yen by worsening Japan’s trade balance and household purchasing power, as acknowledged by Finance Minister Katayama. At the same time, rising global yields and resilient U.S. economic data continue to anchor dollar strength, leaving the BOJ caught between supporting the currency and avoiding policy tightening that could undermine a still-fragile domestic recovery.

 
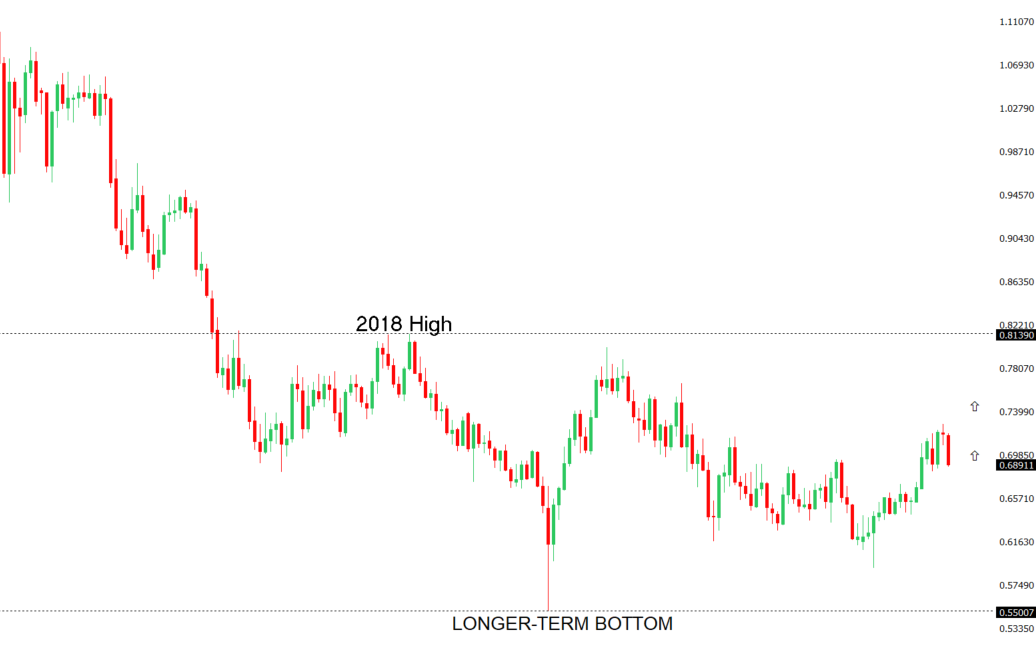
AUDUSD: technical overview

There are signs of the formation of a longer-term base with the market recovering out from a meaningful longer-term support zone. The latest monthly close back above 0.7000 takes the big picture pressure off the downside and strengthens the case for a bottom, with the focus now on a push towards 0.8000. Setbacks should now be well supported ahead of 0.6700.

AUDUSD Chart
R2 0.7300 - Figure - Medium
R1 0.7278 - 6 May/2026 high - Medium
S1 0.7101 - 30 April low - Medium
S2 0.6963 - 8 April low - Strong
AUDUSD: fundamental overview

The Australian Dollar has been trading with a softer tone, caught between external geopolitical uncertainty and shifting rate expectations. On the external front, markets are closely tracking developments around US-China relations following comments from Donald Trump highlighting “fantastic trade deals” with Xi Jinping, though underlying tensions—particularly around Taiwan—continue to inject caution. This matters for the Aussie given its strong correlation to China as Australia’s largest trading partner, leaving it sensitive to any deterioration in the relationship. At the same time, broader geopolitical risks tied to Iran and the Strait of Hormuz are adding another layer of uncertainty to global trade and commodity flows. On the macro side, firmer-than-expected US inflation has pushed markets to scale back expectations for Fed easing and even price some probability of additional tightening, supporting the USD and weighing on AUDUSD. This comes as the Aussie lacks a strong domestic catalyst, leaving it largely driven by external factors—namely China sentiment, global risk appetite, and widening rate differentials in favor of the US.

 
Suggested reading

The War on Billionaires Is Dangerous Nonsense, M. Strain, Project Syndicate (May 13, 2026)

Is The US/China Decoupling Real?, N. Smith, Noahpinion (May 13, 2026)


Any opinions, news, research, analyses, prices or other information ("information") contained on this Blog, constitutes marketing communication and it has not been prepared in accordance with legal requirements designed to promote the independence of investment research. Further, the information contained within this Blog does not contain (and should not be construed as containing) investment advice or an investment recommendation, or an offer of, or solicitation for, a transaction in any financial instrument. LMAX Group has not verified the accuracy or basis-in-fact of any claim or statement made by any third parties as comments for every Blog entry.

LMAX Group will not accept liability for any loss or damage, including without limitation to, any loss of profit, which may arise directly or indirectly from use of or reliance on such information. No representation or warranty is given as to the accuracy or completeness of the above information. While the produced information was obtained from sources deemed to be reliable, LMAX Group does not provide any guarantees about the reliability of such sources. Consequently any person acting on it does so entirely at his or her own risk. It is not a place to slander, use unacceptable language or to promote LMAX Group or any other FX and CFD provider and any such postings, excessive or unjust comments and attacks will not be allowed and will be removed from the site immediately.

Day Image
14th May 2026 | view in browser
Dollar supported, Yuan strengthens as markets eye Trump–Xi talks

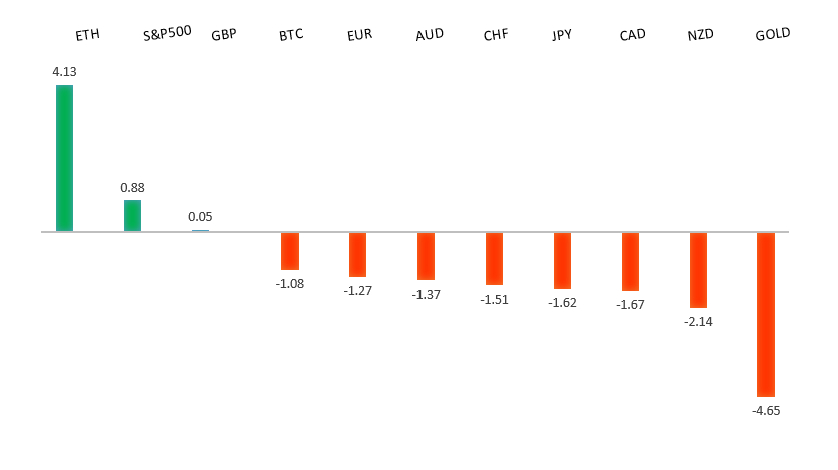
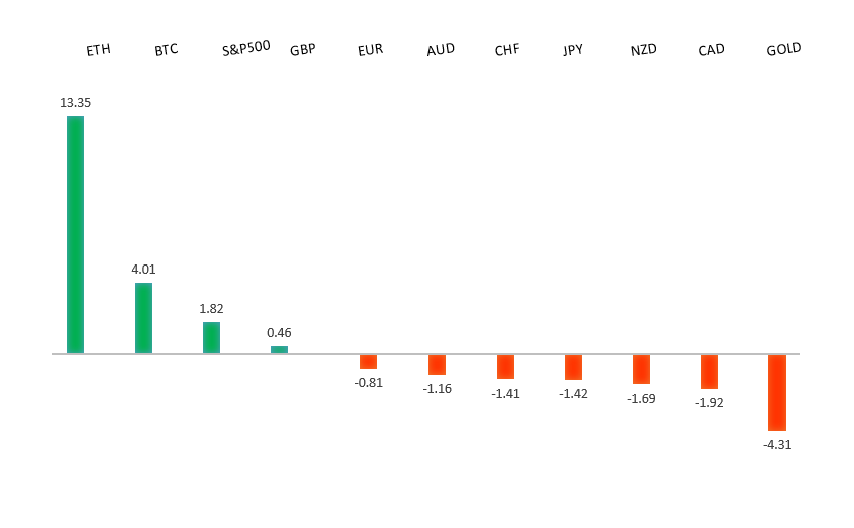
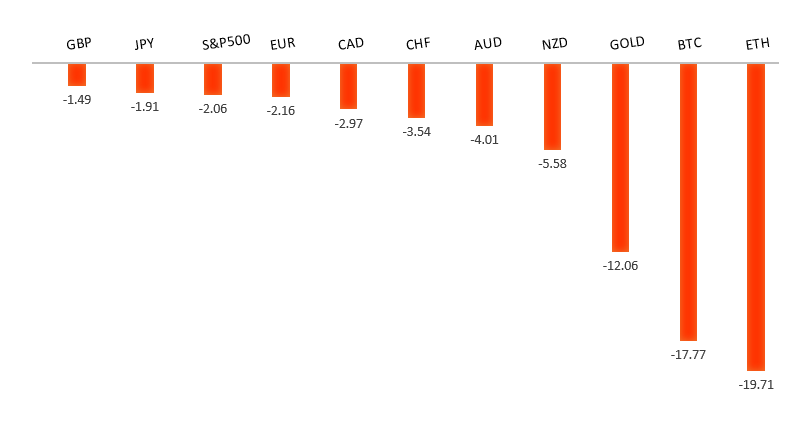
Markets are holding a cautiously risk-on tone, with equities supported by AI-driven earnings optimism, the dollar underpinned by firm U.S. inflation, and FX and commodities increasingly shaped by China policy signals and evolving geopolitical risks around the Trump–Xi summit and Middle East tensions.


Performance chart 30day v. USD (%)
Performance Chart
 
 
Technical & fundamental highlights
EURUSD: technical overview

The Euro outlook remains constructive with higher lows sought out on dips in favor of the next major upside extension targeting the 2021 high at 1.2350. Setbacks should be exceptionally well supported ahead of 1.1300.

EURUSD Chart
R2 1.1850 - 17 April high - Strong
R1 1.1797 - 6 May high - Medium
S1 1.1650 - 9 April low - Medium
S2 1.1589 - 8 April low - Strong
EURUSD: fundamental overview

The euro has managed to reclaim ground above 1.17, with the fundamental driver increasingly shifting toward a more hawkish repricing of European Central Bank policy expectations. Markets are now leaning firmly toward a June rate hike, with a strong majority of economists anticipating a 25bps move to 2.25%, as policymakers including Joachim Nagel warn that geopolitical risks—such as the Iran conflict—could add to inflation pressures. While Philip Lane has maintained a more cautious stance, the overall shift has been supportive for the euro, especially as it narrows perceived policy divergence with the Federal Reserve. On the US side, hotter-than-expected producer price data has helped underpin the dollar and limit EURUSD upside, reinforcing the idea that US disinflation remains uneven. From a near-term flow perspective, thinner liquidity conditions—owing to the Ascension Day holiday across parts of Europe—may also be amplifying price action, even as core markets remain open. Overall, the balance of drivers suggests the euro is being supported more by shifting ECB expectations than weakened US fundamentals, with incoming US data and ECB signaling key for direction from here.

 
USDJPY: technical overview

There are signs of the formation of a meaningful top after the market put in a multi-year high in 2024. At this point, rallies should be well capped above 160.00 in favor of a fresh down-leg back towards the 2024 low at 139.58. Only a monthly close above 160.00 negates.

USDJPY Chart
R2 159.53 - 17 April low - Medium
R1 158.00 - 14 May high - Medium
S1 156.00 - Figure - Medium
S2 155.02 - 6 May low - Strong
USDJPY: fundamental overview

The Yen continues to trade with a heavy but range-bound tone, driven primarily by persistent external yield pressures and tempered by rising domestic and policy-related considerations. Stronger-than-expected US inflation, particularly the upside surprise in PPI, has reinforced the “higher-for-longer” Fed narrative, keeping US-Japan rate differentials wide and maintaining downside pressure on the Yen. This dynamic is further amplified by relatively hawkish signals from the ECB, sustaining broader cross-Yen demand. At the same time, markets remain cautious ahead of key geopolitical developments, including the Trump–Xi summit and ongoing Iran-related risks, which are contributing to global uncertainty and energy price volatility, an especially negative backdrop for Japan’s import-heavy economy. On the domestic side, recent rhetoric from Kazuyuki Masu has added a nuanced layer, acknowledging that sustained Yen weakness could lift inflation expectations and push underlying inflation above target, while also signaling that Japan has effectively exited its deflationary phase. Although this introduces a more hawkish undertone and keeps the door open to further rate hikes, the Bank of Japan remains cautious and data-dependent, stopping short of any firm policy commitment. Meanwhile, ongoing concerns around FX intervention—backed by close coordination between Japanese and US authorities—are helping to anchor the currency and limit more aggressive depreciation, leaving the Yen caught between structurally bearish rate dynamics and intermittent support from policy risk and geopolitical uncertainty.

 
AUDUSD: technical overview

There are signs of the formation of a longer-term base with the market recovering out from a meaningful longer-term support zone. The latest monthly close back above 0.7000 takes the big picture pressure off the downside and strengthens the case for a bottom, with the focus now on a push towards 0.8000. Setbacks should now be well supported ahead of 0.6700.

AUDUSD Chart
R2 0.7300 - Figure - Medium
R1 0.7278 - 6 May/2026 high - Medium
S1 0.7101 - 30 April low - Medium
S2 0.6963 - 8 April low - Strong
AUDUSD: fundamental overview

The Australian Dollar has come under renewed pressure, slipping back toward the mid-0.72s, primarily on the back of a stronger US Dollar following upside surprises in US inflation—most notably a sharp jump in producer prices, which has reinforced expectations that US rates will remain elevated for longer. This widening rate differential continues to weigh on the AUD, particularly in an environment where the Reserve Bank of Australia remains relatively cautious and data-dependent. At the same time, external drivers remain critical, with markets closely watching high-level US-China engagement, including talks between Donald Trump and Xi Jinping, given the Aussie’s sensitivity as a China proxy. Any signs of stabilization or improvement in China’s outlook—Australia’s largest trading partner—could offer support, but for now, softer global risk sentiment, resilient US data, and uncertainty around China’s growth trajectory are combining to keep the AUD on the defensive.

 
Suggested reading

Why Big Oil is opening new frontiers?, J. Smyth, Financial Times (May 14, 2026)

Gold Is Sending On Ominous Message, B. Eichengreen, Project Syndicate (May 11, 2026)


Any opinions, news, research, analyses, prices or other information ("information") contained on this Blog, constitutes marketing communication and it has not been prepared in accordance with legal requirements designed to promote the independence of investment research. Further, the information contained within this Blog does not contain (and should not be construed as containing) investment advice or an investment recommendation, or an offer of, or solicitation for, a transaction in any financial instrument. LMAX Group has not verified the accuracy or basis-in-fact of any claim or statement made by any third parties as comments for every Blog entry.

LMAX Group will not accept liability for any loss or damage, including without limitation to, any loss of profit, which may arise directly or indirectly from use of or reliance on such information. No representation or warranty is given as to the accuracy or completeness of the above information. While the produced information was obtained from sources deemed to be reliable, LMAX Group does not provide any guarantees about the reliability of such sources. Consequently any person acting on it does so entirely at his or her own risk. It is not a place to slander, use unacceptable language or to promote LMAX Group or any other FX and CFD provider and any such postings, excessive or unjust comments and attacks will not be allowed and will be removed from the site immediately.

Day Image
13th May 2026 | view in browser
Higher yields and geopolitical tension keep risk appetite in check

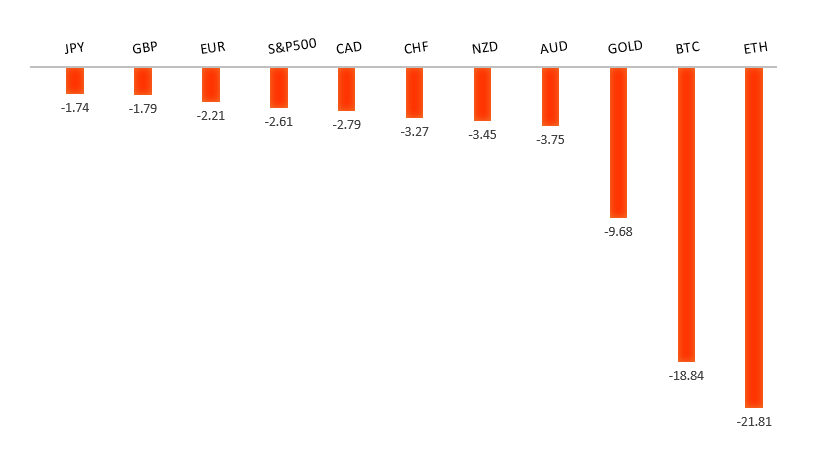
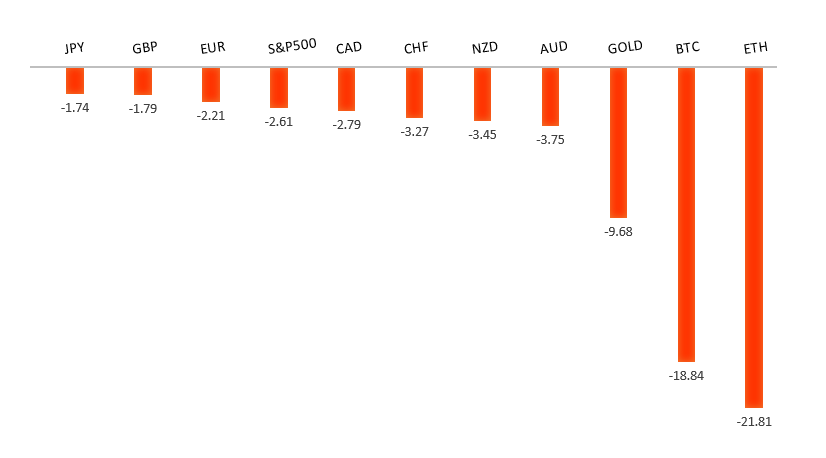
Markets are being driven by a reinforcing loop of sticky inflation and elevated yields supporting the dollar, while geopolitical tensions around energy supply and cautious US-China dynamics are keeping risk assets fragile and commodities volatile.


Performance chart 30day v. USD (%)
Performance Chart
 
 
Technical & fundamental highlights
EURUSD: technical overview

The Euro outlook remains constructive with higher lows sought out on dips in favor of the next major upside extension targeting the 2021 high at 1.2350. Setbacks should be exceptionally well supported ahead of 1.1300.

EURUSD Chart
R2 1.1850 - 17 April high - Strong
R1 1.1797 - 6 May high - Medium
S1 1.1650 - 9 April low - Medium
S2 1.1589 - 8 April low - Strong
EURUSD: fundamental overview

The euro has come under renewed pressure, slipping back below the 1.1750 level, primarily as stronger-than-expected US inflation data has reinforced the divergence in policy expectations between the Federal Reserve and the ECB. A hotter April US CPI print (3.8% YoY, the highest since May 2023) has revived bets that the Fed may need to keep rates higher for longer or even tighten further, boosting the dollar and weighing on EURUSD. On the European side, while ECB rhetoric has turned more hawkish—with policymakers like Joachim Nagel and Martin Kocher flagging rising risks from energy prices and geopolitical tensions—the market still sees a more gradual tightening path relative to the US. Even with pricing for a near-term ECB hike firming, the euro is struggling to gain traction as relative yield dynamics, ongoing geopolitical uncertainty tied to energy markets, and softer growth momentum in the Eurozone continue to act as headwinds against a backdrop of resilient US data.

 
USDJPY: technical overview

There are signs of the formation of a meaningful top after the market put in a multi-year high in 2024. At this point, rallies should be well capped above 160.00 in favor of a fresh down-leg back towards the 2024 low at 139.58. Only a monthly close above 160.00 negates.

USDJPY Chart
R2 159.53 - 17 April low - Medium
R1 157.93 - 6 May high - Medium
S1 156.00 - Figure - Medium
S2 155.02 - 6 May low - Strong
USDJPY: fundamental overview

The Yen has remained under pressure, even as the policy backdrop in Japan turns incrementally more hawkish, with markets still focused on the persistent yield differential versus the US. While the latest current account data showed a record surplus—highlighting strong external balances—this has failed to translate into Yen strength, suggesting capital outflows and rate differentials continue to dominate. The Bank of Japan’s April Summary of Opinions reinforced expectations for further rate hikes, with some policymakers open to near-term tightening amid inflation risks tied to higher energy prices, and external projections such as from the OECD pointing to a gradual normalization path toward 2% policy rates by 2027. However, this tightening trajectory remains slow and cautious relative to the still-restrictive stance of the Federal Reserve, where hotter US CPI data has pushed back expectations for rate cuts and reinforced “higher-for-longer” pricing. As a result, USDJPY continues to be driven primarily by US yields and global risk dynamics, with geopolitical tensions and safe-haven flows offering only limited and inconsistent support to the Yen.

 
AUDUSD: technical overview

There are signs of the formation of a longer-term base with the market recovering out from a meaningful longer-term support zone. The latest monthly close back above 0.7000 takes the big picture pressure off the downside and strengthens the case for a bottom, with the focus now on a push towards 0.8000. Setbacks should now be well supported ahead of 0.6700.

AUDUSD Chart
R2 0.7300 - Figure - Medium
R1 0.7278 - 6 May/2026 high - Medium
S1 0.7101 - 30 April low - Medium
S2 0.6963 - 8 April low - Strong
AUDUSD: fundamental overview

The Australian Dollar has been drawing support from a more hawkish shift at the Reserve Bank of Australia, with the central bank’s recent move to lift rates to 4.35% reinforcing a still-active tightening bias and underpinning yield support for the currency. At the same time, the Aussie continues to trade as a China proxy, leaving it sensitive to developments around US–China trade relations, with markets closely focused on the Trump–Xi summit and ongoing negotiations, where any constructive tone could further lift AUD sentiment. On the external side, stronger-than-expected US inflation has revived some Fed tightening expectations, lending the US Dollar intermittent support and tempering AUD upside, while near-term direction is also being shaped by incoming US data—particularly PPI—as well as broader risk appetite dynamics tied to global growth and trade headlines.

 
Suggested reading

When Money Isn’t Abundant, People Aren’t Stupid, J. Calhoun, Alhambra (May 10, 2026)

It’s Not Over: Why the S&P 500 Is On the Way to 8,000, J. Sonenshine, Barron’s (May 8, 2026)


Any opinions, news, research, analyses, prices or other information ("information") contained on this Blog, constitutes marketing communication and it has not been prepared in accordance with legal requirements designed to promote the independence of investment research. Further, the information contained within this Blog does not contain (and should not be construed as containing) investment advice or an investment recommendation, or an offer of, or solicitation for, a transaction in any financial instrument. LMAX Group has not verified the accuracy or basis-in-fact of any claim or statement made by any third parties as comments for every Blog entry.

LMAX Group will not accept liability for any loss or damage, including without limitation to, any loss of profit, which may arise directly or indirectly from use of or reliance on such information. No representation or warranty is given as to the accuracy or completeness of the above information. While the produced information was obtained from sources deemed to be reliable, LMAX Group does not provide any guarantees about the reliability of such sources. Consequently any person acting on it does so entirely at his or her own risk. It is not a place to slander, use unacceptable language or to promote LMAX Group or any other FX and CFD provider and any such postings, excessive or unjust comments and attacks will not be allowed and will be removed from the site immediately.

Day Image
12th May 2026 | view in browser
Markets on edge ahead of US CPI

Markets are turning more defensive with the Dollar and oil supported as worsening US-Iran tensions lift inflation risks, while focus shifts to today’s key US CPI release for direction.


Performance chart 30day v. USD (%)
Performance Chart
 
 
Technical & fundamental highlights
EURUSD: technical overview

The Euro outlook remains constructive with higher lows sought out on dips in favor of the next major upside extension targeting the 2021 high at 1.2350. Setbacks should be exceptionally well supported ahead of 1.1300.

EURUSD Chart
R2 1.1850 - 17 April high - Strong
R1 1.1797 - 6 May high - Medium
S1 1.1650 - 9 April low - Medium
S2 1.1589 - 8 April low - Strong
EURUSD: fundamental overview

The Euro is trading with a softer near-term bias, primarily driven by external factors, with renewed geopolitical tensions and event risk around US inflation supporting the US Dollar and weighing on EURUSD. Concerns that the fragile US-Iran ceasefire may deteriorate, highlighted by increasingly hawkish rhetoric from both sides, are underpinning safe-haven demand for the greenback, while markets also turn cautious ahead of key US CPI data, reinforcing a more defensive tone. Against this, the European Central Bank continues to offer an important offset, maintaining a clearly hawkish stance as policymakers signal little willingness to delay further tightening in the face of elevated energy-driven inflation. Markets are now pricing a high probability of a June rate hike, with additional tightening expected through 2026, helping to limit downside in the Euro. At the same time, the currency is finding relative support on crosses, particularly against the Yen, where policy divergence with the Bank of Japan remains pronounced. Overall, the Euro is being pulled in opposing directions—supported by a firm policy outlook but pressured by global risk dynamics and Dollar strength—leaving it largely reactive to external drivers rather than domestic momentum.

 
USDJPY: technical overview

There are signs of the formation of a meaningful top after the market put in a multi-year high in 2024. At this point, rallies should be well capped above 160.00 in favor of a fresh down-leg back towards the 2024 low at 139.58. Only a monthly close above 160.00 negates.

USDJPY Chart
R2 159.53 - 17 April low - Medium
R1 157.93 - 6 May high - Medium
S1 156.00 - Figure - Medium
S2 155.02 - 6 May low - Strong
USDJPY: fundamental overview

The Yen remains under pressure, with recent price action driven by a combination of soft domestic data, external risk dynamics, and ongoing policy divergence. The latest downside catalyst has been weaker household spending, which has now declined for a fourth consecutive month, underscoring the strain from persistent inflation on consumer demand and raising concerns about the durability of Japan’s domestic recovery. At the same time, renewed tensions in the Middle East are supporting the US Dollar through safe-haven demand and higher energy prices—both negative for Japan given its reliance on imported fuel—adding further downside pressure on the Yen. While the Bank of Japan is gradually shifting toward a more hawkish stance, with some policymakers signaling openness to additional rate hikes, this is being offset by still-wide yield differentials versus the US, which continue to favor carry trades. Intervention dynamics also remain in play, with Japanese officials maintaining a strong presence and signaling readiness to act, helping to limit excessive weakness but not fundamentally reverse the trend. As a result, the Yen remains caught between intermittent policy support and persistent structural headwinds, leaving it vulnerable overall while prone to bouts of volatility.

 
AUDUSD: technical overview

There are signs of the formation of a longer-term base with the market recovering out from a meaningful longer-term support zone. The latest monthly close back above 0.7000 takes the big picture pressure off the downside and strengthens the case for a bottom, with the focus now on a push towards 0.8000. Setbacks should now be well supported ahead of 0.6700.

AUDUSD Chart
R2 0.7300 - Figure - Medium
R1 0.7278 - 6 May/2026 high - Medium
S1 0.7101 - 30 April low - Medium
S2 0.6963 - 8 April low - Strong
AUDUSD: fundamental overview

The Australian Dollar is coming under pressure as domestic fundamentals deteriorate, even as the broader macro backdrop remains mixed. The latest business survey data points to a clear slowdown in activity, with confidence still deeply negative and forward-looking indicators such as orders and capital expenditure falling sharply, signaling weaker growth ahead. At the same time, elevated energy costs linked to the Middle East conflict are creating a pronounced squeeze on corporate margins, with input costs rising much faster than selling prices, reinforcing a stagflationary dynamic. This leaves the Reserve Bank of Australia in a difficult position: while softer activity argues for patience, rising retail price pressures and the risk of second-round inflation effects mean policy is likely to remain restrictive. As a result, although higher rates continue to provide some support, the Aussie is increasingly weighed down by weakening domestic momentum and remains highly sensitive to external drivers such as global risk sentiment, commodity prices, and US Dollar direction.

 
Suggested reading

“Return of Investment” Different From “Return On,” Fisher Investments (May 7, 2026)

6 Undervalued Stocks That Just Raised Dividends, B. Albrecht, Morningstar (May 7, 2026)


Any opinions, news, research, analyses, prices or other information ("information") contained on this Blog, constitutes marketing communication and it has not been prepared in accordance with legal requirements designed to promote the independence of investment research. Further, the information contained within this Blog does not contain (and should not be construed as containing) investment advice or an investment recommendation, or an offer of, or solicitation for, a transaction in any financial instrument. LMAX Group has not verified the accuracy or basis-in-fact of any claim or statement made by any third parties as comments for every Blog entry.

LMAX Group will not accept liability for any loss or damage, including without limitation to, any loss of profit, which may arise directly or indirectly from use of or reliance on such information. No representation or warranty is given as to the accuracy or completeness of the above information. While the produced information was obtained from sources deemed to be reliable, LMAX Group does not provide any guarantees about the reliability of such sources. Consequently any person acting on it does so entirely at his or her own risk. It is not a place to slander, use unacceptable language or to promote LMAX Group or any other FX and CFD provider and any such postings, excessive or unjust comments and attacks will not be allowed and will be removed from the site immediately.

Day Image
11th May 2026 | view in browser
Geopolitics bite back

Markets have shifted back into a cautious risk-off tone, with the Dollar and oil higher as renewed Middle East tensions reintroduce inflation risks and challenge the recent risk rally.


Performance chart 30day v. USD (%)
Performance Chart
 
 
Technical & fundamental highlights
EURUSD: technical overview

The Euro outlook remains constructive with higher lows sought out on dips in favor of the next major upside extension targeting the 2021 high at 1.2350. Setbacks should be exceptionally well supported ahead of 1.1300.

EURUSD Chart
R2 1.1850 - 17 April high - Strong
R1 1.1797 - 6 May high - Medium
S1 1.1650 - 9 April low - Medium
S2 1.1589 - 8 April low - Strong
EURUSD: fundamental overview

The Euro is trading with a softer bias, primarily weighed down by a firmer US Dollar as geopolitical tensions re-escalate and risk aversion returns to the forefront. Renewed uncertainty around the US-Iran situation—following a breakdown in tone around negotiations and ongoing concerns over the Strait of Hormuz—has revived safe-haven demand for the greenback, putting downside pressure on EURUSD. This Dollar strength has been reinforced by a resilient US labor market backdrop, with the latest payrolls data coming in stronger than expected and helping to anchor expectations for a still-restrictive Federal Reserve policy stance. On the European side, the European Central Bank continues to provide some underlying support, with markets still pricing additional rate hikes amid persistent inflation pressures, which is helping to limit deeper losses in the single currency. However, this support is being offset by a relatively weaker growth outlook in the Eurozone and ongoing external risks, including trade tensions and global uncertainty. As a result, the Euro remains largely driven by external dynamics—particularly USD strength and shifts in risk sentiment—leaving it vulnerable in the near term despite a still-hawkish policy backdrop.

 
USDJPY: technical overview

There are signs of the formation of a meaningful top after the market put in a multi-year high in 2024. At this point, rallies should be well capped above 160.00 in favor of a fresh down-leg back towards the 2024 low at 139.58. Only a monthly close above 160.00 negates.

USDJPY Chart
R2 159.53 - 17 April low - Medium
R1 157.93 - 6 May high - Medium
S1 156.00 - Figure - Medium
S2 155.02 - 6 May low - Strong
USDJPY: fundamental overview

The Yen remains fundamentally pressured, with recent price action reflecting a familiar tug-of-war between structural headwinds and intermittent policy support. In the near term, renewed Middle East tensions—following the rejection of a proposed US-Iran peace deal—have pushed oil prices higher and reinforced safe-haven demand for the US Dollar. This dynamic is particularly negative for Japan given its heavy reliance on energy imports, with elevated oil prices worsening the country’s terms of trade and weighing on the Yen. At the same time, yield differentials remain a key driver, with a still-restrictive Federal Reserve stance contrasting with the relatively accommodative posture of the Bank of Japan, sustaining demand for carry trades. Against this backdrop, Japanese authorities continue to lean against excessive currency weakness, with repeated intervention and strong verbal warnings from officials such as Atsushi Mimura helping to cap upside in USDJPY and inject volatility into the pair. However, intervention is largely seen as a short-term tool to smooth moves rather than reverse the trend, leaving the Yen vulnerable overall as long as external pressures—particularly energy costs and rate differentials—remain in place.

 
AUDUSD: technical overview

There are signs of the formation of a longer-term base with the market recovering out from a meaningful longer-term support zone. The latest monthly close back above 0.7000 takes the big picture pressure off the downside and strengthens the case for a bottom, with the focus now on a push towards 0.8000. Setbacks should now be well supported ahead of 0.6700.

AUDUSD Chart
R2 0.7300 - Figure - Medium
R1 0.7278 - 6 May/2026 high - Medium
S1 0.7101 - 30 April low - Medium
S2 0.6963 - 8 April low - Strong
AUDUSD: fundamental overview

The Australian Dollar is being pulled in two directions, with underlying support from a still-hawkish domestic policy backdrop offset by external headwinds from global risk dynamics and a firmer US Dollar. On the one hand, the Reserve Bank of Australia continues to underpin the currency, having delivered a third consecutive rate hike to 4.35% and maintaining a tightening bias, with markets still pricing further increases toward the mid-4% range over time as inflation remains elevated, in part due to higher energy costs linked to Middle East tensions. This keeps Australian yields relatively attractive and supports crosses such as AUDJPY. However, the broader AUDUSD performance is more mixed, as renewed geopolitical uncertainty—particularly the breakdown in US-Iran negotiations—has lifted safe-haven demand for the US Dollar and weighed on risk-sensitive currencies. At the same time, stronger US data, including a resilient payrolls print, has reinforced expectations for a still-restrictive Federal Reserve, further supporting the USD. From a regional perspective, China data has shown signs of firmer inflation, offering some support to the Aussie given strong trade linkages, though not enough to fully offset global headwinds. As a result, the Australian Dollar remains supported on a relative yield basis but ultimately continues to trade as a proxy for global risk sentiment and USD direction, leaving it vulnerable in periods of heightened uncertainty despite its constructive domestic backdrop.

 
Suggested reading

UBS’s Sergio Ermotti on Swiss plans for stringent capital requirements, R. Khalaf, FT (May 8, 2026)

Why It’s So Hard to Spot a Stock-Market Bubble, J. Zweig, Wall Street Journal  (May 8, 2026)


Any opinions, news, research, analyses, prices or other information ("information") contained on this Blog, constitutes marketing communication and it has not been prepared in accordance with legal requirements designed to promote the independence of investment research. Further, the information contained within this Blog does not contain (and should not be construed as containing) investment advice or an investment recommendation, or an offer of, or solicitation for, a transaction in any financial instrument. LMAX Group has not verified the accuracy or basis-in-fact of any claim or statement made by any third parties as comments for every Blog entry.

LMAX Group will not accept liability for any loss or damage, including without limitation to, any loss of profit, which may arise directly or indirectly from use of or reliance on such information. No representation or warranty is given as to the accuracy or completeness of the above information. While the produced information was obtained from sources deemed to be reliable, LMAX Group does not provide any guarantees about the reliability of such sources. Consequently any person acting on it does so entirely at his or her own risk. It is not a place to slander, use unacceptable language or to promote LMAX Group or any other FX and CFD provider and any such postings, excessive or unjust comments and attacks will not be allowed and will be removed from the site immediately.

Day Image
8th May 2026 | view in browser
Waiting on payrolls, watching the world

Markets are trading cautiously into Friday with the Dollar stabilizing and risk assets pausing as geopolitical uncertainty lingers, while attention turns squarely to today’s US nonfarm payrolls report for the next directional catalyst.


Performance chart 30day v. USD (%)
Performance Chart
 
 
Technical & fundamental highlights
EURUSD: technical overview

The Euro outlook remains constructive with higher lows sought out on dips in favor of the next major upside extension targeting the 2021 high at 1.2350. Setbacks should be exceptionally well supported ahead of 1.1300.

EURUSD Chart
R2 1.1850 - 17 April high - Strong
R1 1.1797 - 6 May high - Medium
S1 1.1650 - 9 April low - Medium
S2 1.1589 - 8 April low - Strong
EURUSD: fundamental overview

The Euro is trading with a modestly constructive but ultimately range-bound bias, with price action being driven largely by external dynamics rather than a strong shift in Eurozone fundamentals. On the one hand, periodic optimism around a potential US-Iran de-escalation has weighed on the US Dollar and allowed EURUSD to hold above the 1.17 handle. However, this upside remains capped by lingering geopolitical uncertainty, with renewed tensions around the Strait of Hormuz sustaining a degree of safe-haven demand for the Dollar. At the same time, markets are reluctant to take strong directional views ahead of key US data, particularly the upcoming non-farm payrolls report, which is seen as critical in shaping expectations for the Federal Reserve policy path. From a European perspective, the European Central Bank continues to maintain a cautiously hawkish stance amid still-elevated inflation, but this is being offset by a fragile growth outlook and ongoing trade-related uncertainty. As a result, the Euro is effectively being pulled between a softer Dollar environment and persistent external risks, leaving it supported at current levels but lacking the conviction for a sustained breakout.

 
USDJPY: technical overview

There are signs of the formation of a meaningful top after the market put in a multi-year high in 2024. At this point, rallies should be well capped above 160.00 in favor of a fresh down-leg back towards the 2024 low at 139.58. Only a monthly close above 160.00 negates.

USDJPY Chart
R2 159.53 - 17 April low - Medium
R1 157.93 - 6 May high - Medium
S1 156.00 - Figure - Medium
S2 155.02 - 6 May low - Strong
USDJPY: fundamental overview

The Yen is being driven by a complex interplay between aggressive policy intervention and shifting external dynamics, with recent price action reflecting both forces in real time. On one hand, authorities have stepped in repeatedly and at significant scale—reportedly deploying tens of billions of dollars in recent sessions—to defend the currency and counter disorderly moves, reinforcing a near-term floor under the Yen and pushing USDJPY sharply lower from its recent highs. Bank of Japan-linked intervention risk remains a key constraint on further Yen weakness, particularly with officials signaling a willingness to act again if needed. On the other hand, the broader macro backdrop is evolving, with easing tensions around the Strait of Hormuz driving oil prices lower, improving Japan’s terms of trade and offering additional support to the currency. However, underlying structural pressures remain in place, including wide yield differentials versus the Federal Reserve and the Yen’s entrenched role as a funding currency, which continue to limit follow-through on rallies. As a result, the Yen is benefiting from a combination of intervention, softer oil, and reduced geopolitical risk, but remains fundamentally fragile, with direction increasingly sensitive to incoming US data—particularly the upcoming non-farm payrolls report—and any renewed shifts in the global macro environment.

 
AUDUSD: technical overview

There are signs of the formation of a longer-term base with the market recovering out from a meaningful longer-term support zone. The latest monthly close back above 0.7000 takes the big picture pressure off the downside and strengthens the case for a bottom, with the focus now on a push towards 0.8000. Setbacks should now be well supported ahead of 0.6700.

AUDUSD Chart
R2 0.7300 - Figure - Medium
R1 0.7278 - 6 May/2026 high - Medium
S1 0.7101 - 30 April low - Medium
S2 0.6963 - 8 April low - Strong
AUDUSD: fundamental overview

The Australian Dollar has pulled back from multi-year highs, with the near-term move driven by a combination of a modest US Dollar rebound and softer domestic fundamentals tempering what had been a strong risk-led rally. While the broader backdrop remains supportive—underpinned by improved global sentiment, easing Middle East tensions, and still-elevated yields following the recent 25bp hike from the Reserve Bank of Australia to 4.35%—the currency is facing some loss of momentum. The RBA’s shift toward a more patient stance, emphasizing that policy is now restrictive and allowing time to assess the inflation impact of the energy shock, has limited further upside from rate expectations. At the same time, weaker domestic data—most notably the surprise shift in Australia’s trade balance into deficit, driven by falling exports—has raised questions about external demand and added a local headwind. Externally, the AUD continues to trade as a proxy for global risk and US Dollar direction, with the recent pullback in oil and some fading of peak optimism around a US-Iran deal prompting a partial unwind of risk positioning. As a result, while the medium-term outlook remains constructive, the Aussie is showing signs of consolidation near highs, with upside increasingly dependent on renewed USD weakness and sustained improvement in global conditions.

 
Suggested reading

Storm Clouds Over The European Economy, D. Lachman, AEI-Ideas (May 4, 2026)

The Inflation Diversification Problem, E. Cole, Man Group (May 1, 2026)


Any opinions, news, research, analyses, prices or other information ("information") contained on this Blog, constitutes marketing communication and it has not been prepared in accordance with legal requirements designed to promote the independence of investment research. Further, the information contained within this Blog does not contain (and should not be construed as containing) investment advice or an investment recommendation, or an offer of, or solicitation for, a transaction in any financial instrument. LMAX Group has not verified the accuracy or basis-in-fact of any claim or statement made by any third parties as comments for every Blog entry.

LMAX Group will not accept liability for any loss or damage, including without limitation to, any loss of profit, which may arise directly or indirectly from use of or reliance on such information. No representation or warranty is given as to the accuracy or completeness of the above information. While the produced information was obtained from sources deemed to be reliable, LMAX Group does not provide any guarantees about the reliability of such sources. Consequently any person acting on it does so entirely at his or her own risk. It is not a place to slander, use unacceptable language or to promote LMAX Group or any other FX and CFD provider and any such postings, excessive or unjust comments and attacks will not be allowed and will be removed from the site immediately.

Day Image
7th May 2026 | view in browser
From tension to traction

Markets are firmly in risk-on mode, with the Dollar weakening and equities near highs as easing Middle East tensions and falling oil prices reduce inflation fears ahead of key US labor data.


Performance chart 30day v. USD (%)
Performance Chart
 
 
Technical & fundamental highlights
EURUSD: technical overview

The Euro outlook remains constructive with higher lows sought out on dips in favor of the next major upside extension targeting the 2021 high at 1.2350. Setbacks should be exceptionally well supported ahead of 1.1300.

EURUSD Chart
R2 1.1850 - 17 April high - Strong
R1 1.1797 - 6 May high - Medium
S1 1.1650 - 9 April low - Medium
S2 1.1589 - 8 April low - Strong
EURUSD: fundamental overview

The Euro is being supported primarily by external dynamics, with EURUSD holding firm as a softer US Dollar remains the dominant driver. The key catalyst has been growing optimism around a potential US-Iran agreement, which is easing geopolitical risk, pushing oil prices lower, and reducing safe-haven demand for the greenback. This has also contributed to a modest repricing of expectations around the Federal Reserve, with fading hawkishness at the margin weighing further on the Dollar. Against this backdrop, the European Central Bank continues to offer a degree of underlying support, maintaining a cautious tightening bias amid still-elevated inflation, though this is not the primary driver of recent price action. Instead, the Euro is largely trading as a function of USD weakness and broader risk sentiment, with lingering uncertainty around the durability of any Iran deal and still-present expectations for higher US rates limiting more aggressive upside. As a result, while the near-term bias remains constructive, the move is externally driven and remains sensitive to shifts in geopolitics and incoming US data, particularly ahead of tomorrow’s key payrolls release.

 
USDJPY: technical overview

There are signs of the formation of a meaningful top after the market put in a multi-year high in 2024. At this point, rallies should be well capped above 160.00 in favor of a fresh down-leg back towards the 2024 low at 139.58. Only a monthly close above 160.00 negates.

USDJPY Chart
R2 159.53 - 17 April low - Medium
R1 157.93 - 6 May high - Medium
S1 156.00 - Figure - Medium
S2 155.02 - 6 May low - Strong
USDJPY: fundamental overview

The Yen is currently trading in a more balanced consolidation phase, supported by a combination of policy and intervention dynamics even as broader structural headwinds remain in place. On the supportive side, the Bank of Japan is maintaining a relatively hawkish tilt, with recent guidance and meeting minutes reinforcing that further rate hikes remain on the table if inflation and wage dynamics evolve as expected, marking a gradual shift away from ultra-accommodative policy. At the same time, persistent intervention risk—underscored by both verbal warnings from officials and evidence of large-scale FX operations—continues to act as a deterrent to aggressive Yen selling, effectively placing a ceiling on USDJPY rallies. This is being complemented by a softer US Dollar backdrop, as easing geopolitical tensions and falling oil prices reduce inflation pressures and dampen expectations for further tightening from the Federal Reserve. However, the broader picture remains nuanced: the Yen is still constrained by lingering yield differentials and its role as a funding currency, meaning gains are more episodic than sustained. As a result, the currency is being pulled between near-term support from intervention and shifting policy expectations, and longer-term pressure from structural carry dynamics, leaving USDJPY range-bound as markets await clearer direction on both central bank policy and the geopolitical outlook.

 
AUDUSD: technical overview

There are signs of the formation of a longer-term base with the market recovering out from a meaningful longer-term support zone. The latest monthly close back above 0.7000 takes the big picture pressure off the downside and strengthens the case for a bottom, with the focus now on a push towards 0.8000. Setbacks should now be well supported ahead of 0.6700.

AUDUSD Chart
R2 0.7300 - Figure - Medium
R1 0.7278 - 6 May/2026 high - Medium
S1 0.7101 - 30 April low - Medium
S2 0.6963 - 8 April low - Strong
AUDUSD: fundamental overview

The Australian Dollar remains supported but is increasingly transitioning into a more nuanced, consolidation phase, with price action driven primarily by external factors rather than a strong domestic impulse. On the one hand, improving global risk sentiment—helped by easing tensions in the Middle East and a sharp pullback in oil prices—is weighing on the US Dollar and underpinning AUDUSD near multi-year highs. At the same time, the Reserve Bank of Australia continues to provide a structural floor, having lifted rates to restrictive levels while maintaining a cautious stance amid still-sticky inflation and the risk of second-round effects. However, this support is being tempered by a clear shift in policy tone toward patience, with policymakers signaling they are now comfortable pausing to assess the outlook. Domestically, the picture is mixed: growth remains relatively resilient and inflation elevated, but there are signs of cooling in the labor market and uneven activity data, including softer trade dynamics. China is acting more as a stabilizer than a tailwind, while the broader rally remains heavily dependent on USD direction and risk appetite. As a result, the Aussie is holding a constructive bias, but conviction is still lacking, leaving it vulnerable to shifts in sentiment despite the underlying yield support.

 
Suggested reading

Gold-Timing Signal That Has Historically Signaled Rally, M. Hulbert, Marketwatch (May 6, 2026)

Will Bending The Rules Break The Market?, J. Zweig, The Intelligent Investor (May 5, 2026)


Any opinions, news, research, analyses, prices or other information ("information") contained on this Blog, constitutes marketing communication and it has not been prepared in accordance with legal requirements designed to promote the independence of investment research. Further, the information contained within this Blog does not contain (and should not be construed as containing) investment advice or an investment recommendation, or an offer of, or solicitation for, a transaction in any financial instrument. LMAX Group has not verified the accuracy or basis-in-fact of any claim or statement made by any third parties as comments for every Blog entry.

LMAX Group will not accept liability for any loss or damage, including without limitation to, any loss of profit, which may arise directly or indirectly from use of or reliance on such information. No representation or warranty is given as to the accuracy or completeness of the above information. While the produced information was obtained from sources deemed to be reliable, LMAX Group does not provide any guarantees about the reliability of such sources. Consequently any person acting on it does so entirely at his or her own risk. It is not a place to slander, use unacceptable language or to promote LMAX Group or any other FX and CFD provider and any such postings, excessive or unjust comments and attacks will not be allowed and will be removed from the site immediately.

Day Image
6th May 2026 | view in browser
Risk rebounds, dollar retreats again

Markets are leaning back into risk-on with the Dollar softer and equities firmer as easing geopolitical tensions and lower oil prices reduce inflation fears, though FX remains nuanced with Yen strength from intervention facing ongoing structural headwinds.


Performance chart 30day v. USD (%)
Performance Chart
 
 
Technical & fundamental highlights
EURUSD: technical overview

The Euro outlook remains constructive with higher lows sought out on dips in favor of the next major upside extension targeting the 2021 high at 1.2350. Setbacks should be exceptionally well supported ahead of 1.1300.

EURUSD Chart
R2 1.1850 - 17 April high - Strong
R1 1.1786 - 1 May high - Medium
S1 1.1650 - 9 April low - Medium
S2 1.1589 - 8 April low - Strong
EURUSD: fundamental overview

The euro is finding renewed support, primarily driven by an improvement in global risk sentiment following signs of de-escalation in the Middle East, with the pause in US-led shipping operations through the Strait of Hormuz helping to ease immediate energy and geopolitical concerns. This has weighed on the US Dollar via reduced safe-haven demand, allowing EURUSD to push back above the 1.17 handle. At the same time, the euro’s upside remains tempered by lingering external risks, particularly around trade tensions, as the European Commission continues to push back against potential US tariff increases and seeks clarity on existing trade agreements. From a monetary policy perspective, the European Central Bank remains cautiously hawkish, with policymakers keeping the door open to further tightening if inflation fails to moderate, providing an underlying floor for the currency. However, this support is counterbalanced by a still-fragile Eurozone growth backdrop, leaving the euro largely driven by external dynamics—namely shifts in global risk appetite and the direction of the US Dollar—rather than a clear domestic catalyst.

 
USDJPY: technical overview

There are signs of the formation of a meaningful top after the market put in a multi-year high in 2024. At this point, rallies should be well capped above 160.00 in favor of a fresh down-leg back towards the 2024 low at 139.58. Only a monthly close above 160.00 negates.

USDJPY Chart
R2 159.53 - 17 April low - Medium
R1 157.93 - 6 May high - Medium
S1 156.00 - Figure - Medium
S2 155.02 - 6 May low - Strong
USDJPY: fundamental overview

The yen remains driven by a clear divergence between short-term policy action and deeply negative underlying fundamentals, with the latest sharp move lower in USDJPY primarily reflecting aggressive intervention from Japan’s Ministry of Finance rather than a shift in macro dynamics. Authorities have stepped in forcefully to defend the currency—particularly after renewed upside pressure toward the 158–160 zone—successfully pushing the pair to multi-week lows and signaling a stronger willingness to lean against speculative positioning. However, the broader backdrop remains firmly Yen-negative. Elevated oil prices, driven by ongoing tensions around the Strait of Hormuz, are worsening Japan’s terms of trade as a major energy importer, while wide rate differentials versus the still-hawkish Federal Reserve continue to favor carry trades. Although the Bank of Japan is gradually moving toward normalization, policy remains comparatively accommodative, limiting support for the currency. As a result, intervention is best seen as a tool to slow and smooth the pace of depreciation rather than reverse it, with the sustainability of any yen strength ultimately hinging on a meaningful easing in geopolitical tensions and energy prices rather than domestic policy shifts alone.

 
AUDUSD: technical overview

There are signs of the formation of a longer-term base with the market recovering out from a meaningful longer-term support zone. The latest monthly close back above 0.7000 takes the big picture pressure off the downside and strengthens the case for a bottom, with the focus now on a push towards 0.8000. Setbacks should now be well supported ahead of 0.6700.

AUDUSD Chart
R2 0.7300 - Figure - Medium
R1 0.7251 - 6 May/2026 high - Medium
S1 0.7101 - 30 April low - Medium
S2 0.6963 - 8 April low - Strong
AUDUSD: fundamental overview

The Australian Dollar is being driven higher by a combination of improved global risk sentiment and a softer US Dollar, as easing tensions around the Middle East and growing optimism around a potential US-Iran agreement have reduced safe-haven demand and pushed oil prices off their recent highs. This has helped temper inflation concerns globally, weighing on expectations for further tightening from the Federal Reserve and undermining the USD, which in turn is supporting AUDUSD toward fresh multi-year highs. At the same time, the Reserve Bank of Australia continues to provide an important anchor, having recently raised rates to 4.35% and maintained a cautious bias amid still-sticky inflation, even as it signals policy is now restrictive and likely shifting toward a pause. Domestically, the economy remains relatively resilient, though there are clear signs that momentum is softening, while China—Australia’s key trading partner—is acting more as a stabilizer than a growth driver despite pockets of stronger data. Overall, the Aussie is benefiting from the external environment—particularly USD weakness, improving risk appetite, and supportive yield dynamics—but the move remains somewhat fragile and highly dependent on continued stability in global macro and geopolitical conditions.

 
Suggested reading

The Prices for Lots of Things Will Wind Up Looking Silly, J. Calhoun, Alhambra (May 3, 2026)

The Wall Street Trap, A. Grossman, Humble Dollar (May 2, 2026)


Any opinions, news, research, analyses, prices or other information ("information") contained on this Blog, constitutes marketing communication and it has not been prepared in accordance with legal requirements designed to promote the independence of investment research. Further, the information contained within this Blog does not contain (and should not be construed as containing) investment advice or an investment recommendation, or an offer of, or solicitation for, a transaction in any financial instrument. LMAX Group has not verified the accuracy or basis-in-fact of any claim or statement made by any third parties as comments for every Blog entry.

LMAX Group will not accept liability for any loss or damage, including without limitation to, any loss of profit, which may arise directly or indirectly from use of or reliance on such information. No representation or warranty is given as to the accuracy or completeness of the above information. While the produced information was obtained from sources deemed to be reliable, LMAX Group does not provide any guarantees about the reliability of such sources. Consequently any person acting on it does so entirely at his or her own risk. It is not a place to slander, use unacceptable language or to promote LMAX Group or any other FX and CFD provider and any such postings, excessive or unjust comments and attacks will not be allowed and will be removed from the site immediately.

Day Image
5th May 2026 | view in browser
RBA hikes, but macro reality caps Aussie

Markets are trading cautiously with the US Dollar supported and risk sentiment fragile as Middle East tensions and elevated oil prices reinforce inflation risks and a higher-for-longer central bank backdrop.


Performance chart 30day v. USD (%)
Performance Chart
 
 
Technical & fundamental highlights
EURUSD: technical overview

The Euro outlook remains constructive with higher lows sought out on dips in favor of the next major upside extension targeting the 2021 high at 1.2350. Setbacks should be exceptionally well supported ahead of 1.1300.

EURUSD Chart
R2 1.1850 - 17 April high - Strong
R1 1.1786 - 1 May high - Medium
S1 1.1650 - 9 April low - Medium
S2 1.1589 - 8 April low - Strong
EURUSD: fundamental overview

The euro is trading with a softer bias, primarily driven by external dynamics rather than a material shift in the domestic policy outlook, with escalating Middle East tensions—most notably the Iran-UAE escalation—fueling safe-haven demand for the US Dollar and weighing on EURUSD. The geopolitical backdrop is reinforcing a stronger USD via both risk aversion and higher oil-linked inflation expectations, which in turn supports a more hawkish stance from the Federal Reserve. Against this, the European Central Bank is maintaining a cautiously hawkish tone, with policymakers such as ECB Nagel signaling that further tightening as soon as June remains possible if inflation does not improve, helping to put a floor under the Euro. However, this support is being offset by a more fragile macro backdrop in the Eurozone, where growth risks are rising and the ECB itself acknowledges a worsening balance between upside inflation risks and downside activity risks. As a result, the euro is being pulled in two directions—supported by residual hawkish policy expectations but ultimately pressured by global risk dynamics and relative policy divergence—leaving it vulnerable to further downside as long as geopolitical tensions continue to underpin the Dollar.

 
USDJPY: technical overview

There are signs of the formation of a meaningful top after the market put in a multi-year high in 2024. At this point, rallies should be well capped above 160.00 in favor of a fresh down-leg back towards the 2024 low at 139.58. Only a monthly close above 160.00 negates.

USDJPY Chart
R2 159.53 - 17 April low - Medium
R1 157.59 - 17 April low - Medium
S1 156.00 - Figure - Medium
S2 155.49 - 1 May low - Strong
USDJPY: fundamental overview

The yen remains fundamentally pressured in the near term, caught between entrenched carry dynamics and an increasingly complex macro backdrop, even as longer-term constructive narratives persist. The currency continues to underperform as a preferred funding vehicle, with wide yield differentials versus the US—anchored by a still-hawkish Federal Reserve—keeping USDJPY elevated, particularly amid rising energy prices that are worsening Japan’s terms of trade. At the same time, escalating tensions around the Strait of Hormuz are a critical swing factor: higher oil prices are negative for Japan’s import-heavy economy and weigh on the Yen, while any sustained risk-off shock could eventually revive safe-haven demand. On the domestic side, the Bank of Japan is gradually shifting, with a recent rate hold accompanied by a notable split—three dissenters calling for a hike—reinforcing expectations of further normalization and lending some medium-term support. However, recent intervention by Japanese authorities to defend the 160 level has underscored policymakers’ discomfort with excessive weakness, though such actions are seen as more effective in smoothing volatility than reversing trends. As a result, the Yen remains driven by a tug-of-war between structural headwinds—carry, energy dynamics, and policy divergence—and emerging supports from policy normalization expectations and geopolitical uncertainty, leaving it weak in the near term but with scope for recovery should global conditions shift.

 
AUDUSD: technical overview

There are signs of the formation of a longer-term base with the market recovering out from a meaningful longer-term support zone. The latest monthly close back above 0.7000 takes the big picture pressure off the downside and strengthens the case for a bottom, with the focus now on a push towards 0.8000. Setbacks should now be well supported ahead of 0.6700.

AUDUSD Chart
R2 0.7300 - Figure - Medium
R1 0.7228 - 1 May/2026 high - Medium
S1 0.7101 - 30 April low - Medium
S2 0.6963 - 8 April low - Strong
AUDUSD: fundamental overview

The Australian Dollar has come under modest pressure following the latest decision from the Reserve Bank of Australia, despite the Bank delivering the expected 25bp hike to 4.35%, as markets interpreted the overall message as less hawkish at the margin. While the policy move reinforces that inflation remains a concern—particularly with energy and commodity price shocks from the Middle East feeding into the outlook and raising the risk of second-round effects—the accompanying guidance signaled a clear shift toward patience. Governor Bullock emphasized that policy is now “a bit restrictive,” and that the Bank has scope to assess how the inflation shock evolves, effectively validating expectations for a pause after three consecutive hikes. This nuance has limited further upside for the AUD, with much of the tightening already priced in and little incremental hawkishness to drive yields higher. As a result, while the currency continues to draw underlying support from elevated rate levels and persistent inflation risks, the transition toward a wait-and-see stance—alongside lingering concerns around growth and global uncertainty—is tempering bullish momentum and leaving the Aussie more vulnerable in the near term.

 
Suggested reading

BlackRock’s Rick Rieder Believes Econ. Is Recession-Proof, E. Russell, Barron’s (May 1, 2026)

Fed As Inflation Fighter Is Rooted In Phillips Curve Mysticism, J. Tamny, Forbes (May 1, 2026)


Any opinions, news, research, analyses, prices or other information ("information") contained on this Blog, constitutes marketing communication and it has not been prepared in accordance with legal requirements designed to promote the independence of investment research. Further, the information contained within this Blog does not contain (and should not be construed as containing) investment advice or an investment recommendation, or an offer of, or solicitation for, a transaction in any financial instrument. LMAX Group has not verified the accuracy or basis-in-fact of any claim or statement made by any third parties as comments for every Blog entry.

LMAX Group will not accept liability for any loss or damage, including without limitation to, any loss of profit, which may arise directly or indirectly from use of or reliance on such information. No representation or warranty is given as to the accuracy or completeness of the above information. While the produced information was obtained from sources deemed to be reliable, LMAX Group does not provide any guarantees about the reliability of such sources. Consequently any person acting on it does so entirely at his or her own risk. It is not a place to slander, use unacceptable language or to promote LMAX Group or any other FX and CFD provider and any such postings, excessive or unjust comments and attacks will not be allowed and will be removed from the site immediately.

Day Image
4th May 2026 | view in browser
Oil, Iran, and rates: the trifecta steering global markets

Markets are consolidating in a cautious tone as Middle East tensions drive oil-linked inflation risks, keeping the US Dollar supported and central bank expectations tilted hawkish while limiting conviction across risk assets.


Performance chart 30day v. USD (%)
Performance Chart
 
 
Technical & fundamental highlights
EURUSD: technical overview

The Euro outlook remains constructive with higher lows sought out on dips in favor of the next major upside extension targeting the 2021 high at 1.2350. Setbacks should be exceptionally well supported ahead of 1.1300.

EURUSD Chart
R2 1.1850 - 17 April high - Strong
R1 1.1786 - 1 May high - Medium
S1 1.1650 - 9 April low - Medium
S2 1.1589 - 8 April low - Strong
EURUSD: fundamental overview

The Euro is currently trading on the back foot, weighed down by a combination of rising trade tensions and a firmer US Dollar backdrop. Fresh downside pressure has emerged after US President Donald Trump signaled plans to raise tariffs on EU cars and trucks to 25%, a move that risks escalating a transatlantic trade dispute and undermining the export-sensitive Eurozone outlook. The European Commission has pushed back, vowing to defend its position, but the threat of retaliation is adding uncertainty to growth prospects. At the same time, broader geopolitical risks—particularly escalating tensions around Iran and the Strait of Hormuz—are driving safe-haven demand for the US Dollar, further weighing on EURUSD. This comes on top of an already fragile macro backdrop in the Eurozone, where growth remains subdued and the policy stance of the European Central Bank is seen as relatively cautious compared to a still-resilient US economy. Taken together, the Euro is being pulled lower by a mix of external shocks (trade and geopolitics), relative policy divergence, and ongoing concerns about the region’s growth momentum, keeping rallies shallow and sentiment defensive.

 
USDJPY: technical overview

There are signs of the formation of a meaningful top after the market put in a multi-year high in 2024. At this point, rallies should be well capped above 160.00 in favor of a fresh down-leg back towards the 2024 low at 139.58. Only a monthly close above 160.00 negates.

USDJPY Chart
R2 159.53 - 17 April low - Medium
R1 157.33 - 1 May high - Medium
S1 156.00 - Figure - Medium
S2 155.49 - 1 May low - Strong
USDJPY: fundamental overview

The Japanese Yen remains fundamentally pressured by the wide policy divergence between a still-hawkish Federal Reserve and an ultra-accommodative Bank of Japan, though near-term price action is being shaped by a more complex mix of geopolitical risk and policy intervention. On one hand, escalating tensions around Iran and the Strait of Hormuz—alongside rising US rate hike expectations flagged by officials like Neel Kashkari—are supporting the US Dollar via higher yields and safe-haven demand, keeping USDJPY elevated near the mid-150s. On the other hand, the Yen is finding intermittent support from suspected Japanese government intervention, with reports suggesting authorities spent heavily in early May to stabilize the currency, reinforcing a de facto ceiling on USDJPY rallies. This leaves the Yen caught between structurally bearish fundamentals—persistent yield differentials, imported inflation pressures, and cautious BoJ normalization—and episodic support from both safe-haven flows during risk spikes and direct intervention risk, resulting in a choppy consolidation rather than a sustained directional move.

 
AUDUSD: technical overview

There are signs of the formation of a longer-term base with the market recovering out from a meaningful longer-term support zone. The latest monthly close back above 0.7000 takes the big picture pressure off the downside and strengthens the case for a bottom, with the focus now on a push towards 0.8000. Setbacks should now be well supported ahead of 0.6700.

AUDUSD Chart
R2 0.7300 - Figure - Medium
R1 0.7228 - 1 May/2026 high - Medium
S1 0.7101 - 30 April low - Medium
S2 0.6963 - 8 April low - Strong
AUDUSD: fundamental overview

The Australian Dollar has been supported primarily by a still-firm domestic inflation backdrop and building expectations that the Reserve Bank of Australia will deliver another rate hike at its May meeting (tomorrow), with markets pricing a high probability of a move to around 4.35%. Recent data reinforce this narrative, with the Melbourne Institute gauge showing inflation continuing to rise, underscoring persistent price pressures despite some moderation in momentum. At the same time, the policy outlook is increasingly nuanced: while a tight labor market and rising inflation expectations—exacerbated by higher global energy prices linked to escalating US-Iran tensions—argue for further tightening, softer activity indicators (notably a sharp drop in building approvals and ongoing declines in job ads) point to emerging cracks in domestic demand. Indeed, the external backdrop has become a double-edged sword for the currency—elevated commodity and energy prices are inflationary and support the hawkish RBA narrative, but geopolitical risk is simultaneously boosting safe-haven demand for the US Dollar, capping AUD upside. As highlighted by one major Australian bank, the upcoming decision is effectively “line ball,” with the central bank balancing above-target inflation and cost pass-through from the Iran conflict against weakening sentiment, a slowing growth outlook, and early signs of housing market stress, leaving the AUD trading in a supported but cautious bullish consolidation phase.

 
Suggested reading

How robotaxis will reshape the ride-hailing market, R. Rosner-Uddin, Financial Times (May 1, 2026)

When Warsh Takes Over, He Must Turn the Fed Upside Down, S. Forbes, Forbes (April 30, 2026)


Any opinions, news, research, analyses, prices or other information ("information") contained on this Blog, constitutes marketing communication and it has not been prepared in accordance with legal requirements designed to promote the independence of investment research. Further, the information contained within this Blog does not contain (and should not be construed as containing) investment advice or an investment recommendation, or an offer of, or solicitation for, a transaction in any financial instrument. LMAX Group has not verified the accuracy or basis-in-fact of any claim or statement made by any third parties as comments for every Blog entry.

LMAX Group will not accept liability for any loss or damage, including without limitation to, any loss of profit, which may arise directly or indirectly from use of or reliance on such information. No representation or warranty is given as to the accuracy or completeness of the above information. While the produced information was obtained from sources deemed to be reliable, LMAX Group does not provide any guarantees about the reliability of such sources. Consequently any person acting on it does so entirely at his or her own risk. It is not a place to slander, use unacceptable language or to promote LMAX Group or any other FX and CFD provider and any such postings, excessive or unjust comments and attacks will not be allowed and will be removed from the site immediately.