Day Image
10th June 2026 | view in browser
Caught between Hormuz and the Fed

Markets come into Wednesday balancing an escalating US-Iran conflict and its inflationary implications against still-resilient global growth, with all eyes now on US CPI as investors assess whether rising energy costs will reinforce the case for higher-for-longer interest rates.


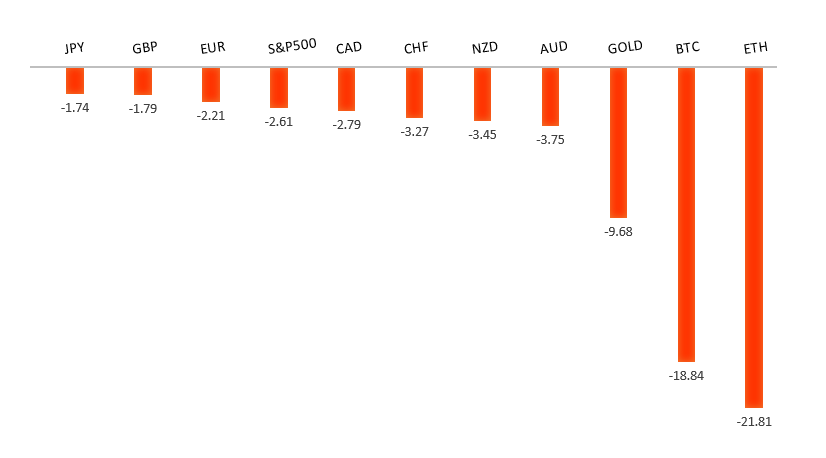
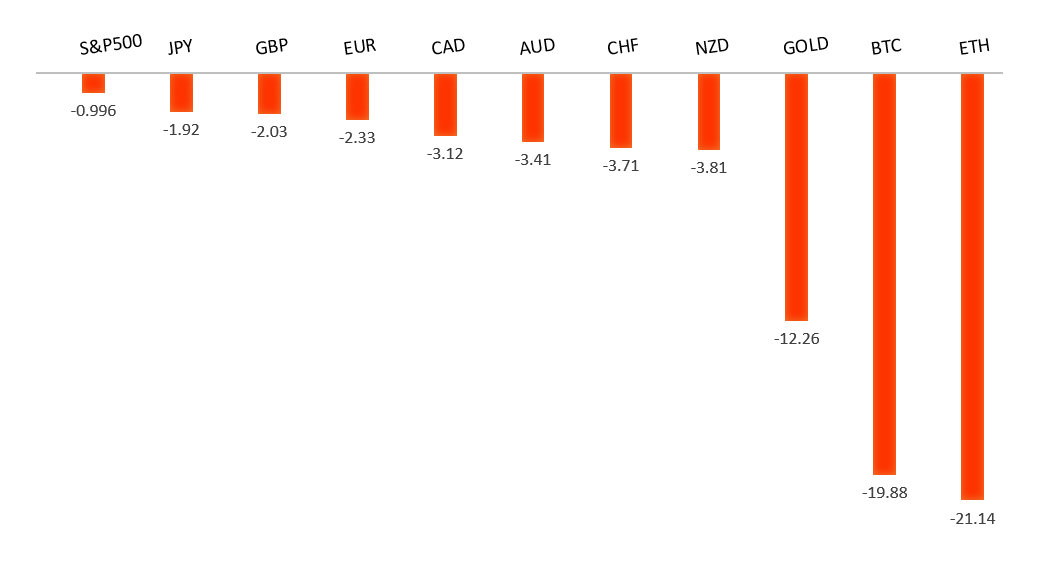
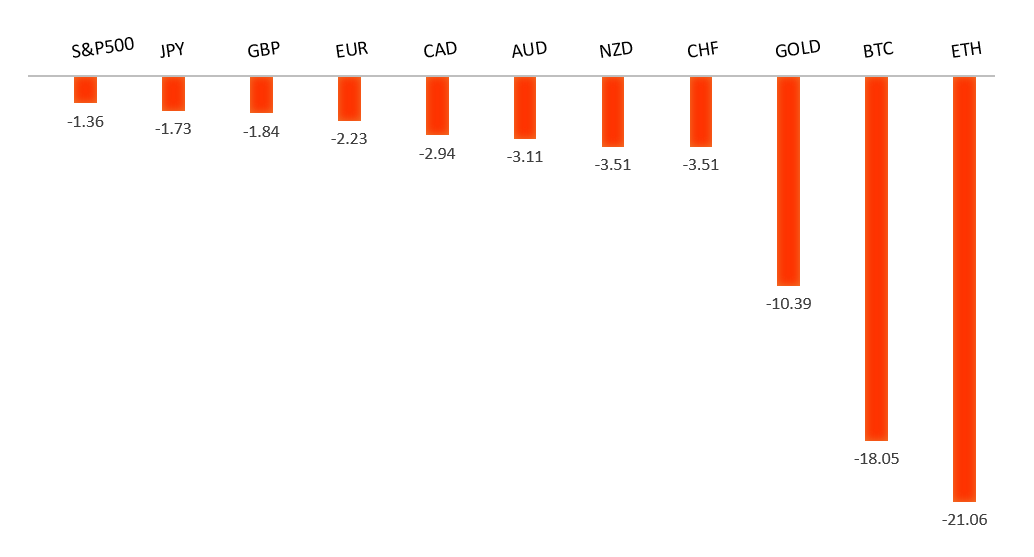
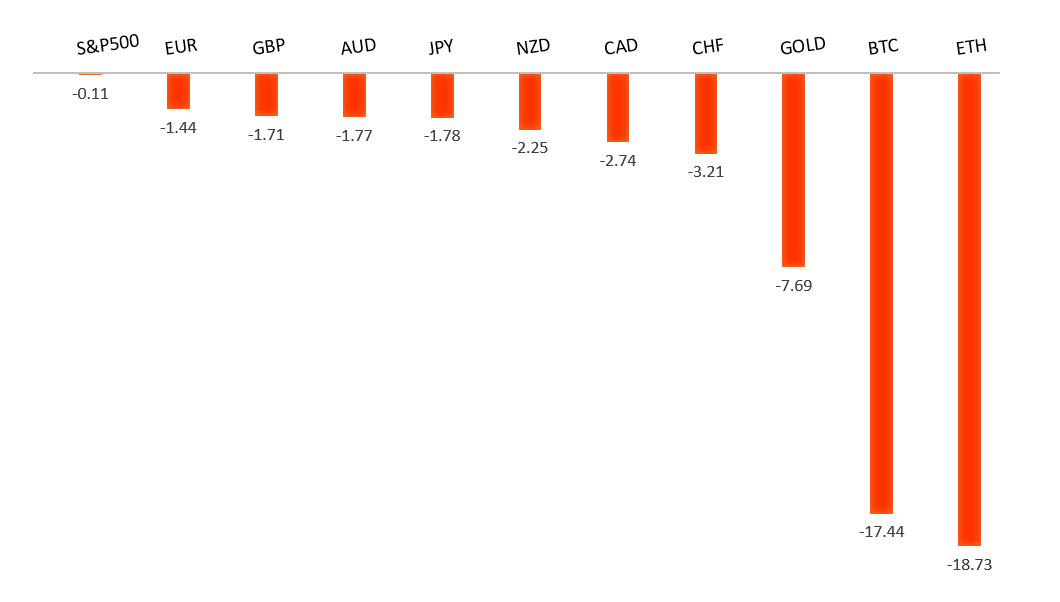
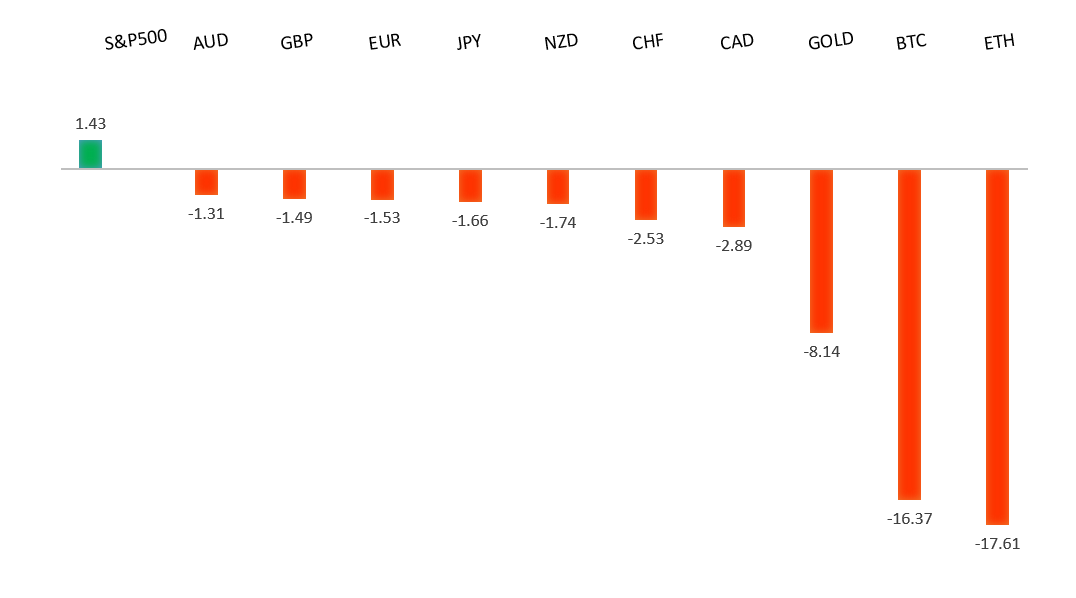
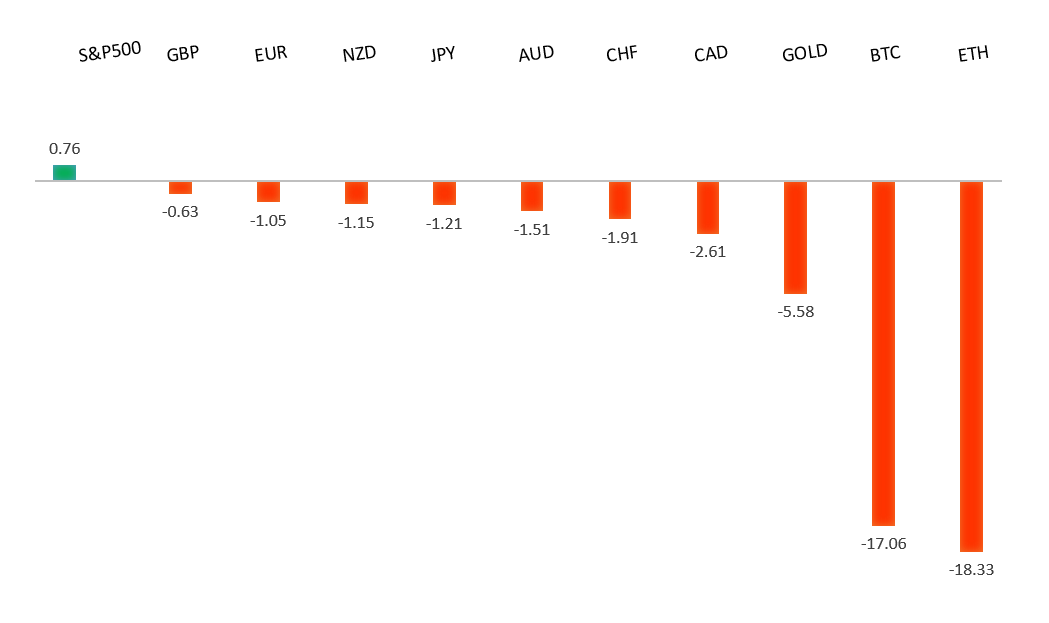
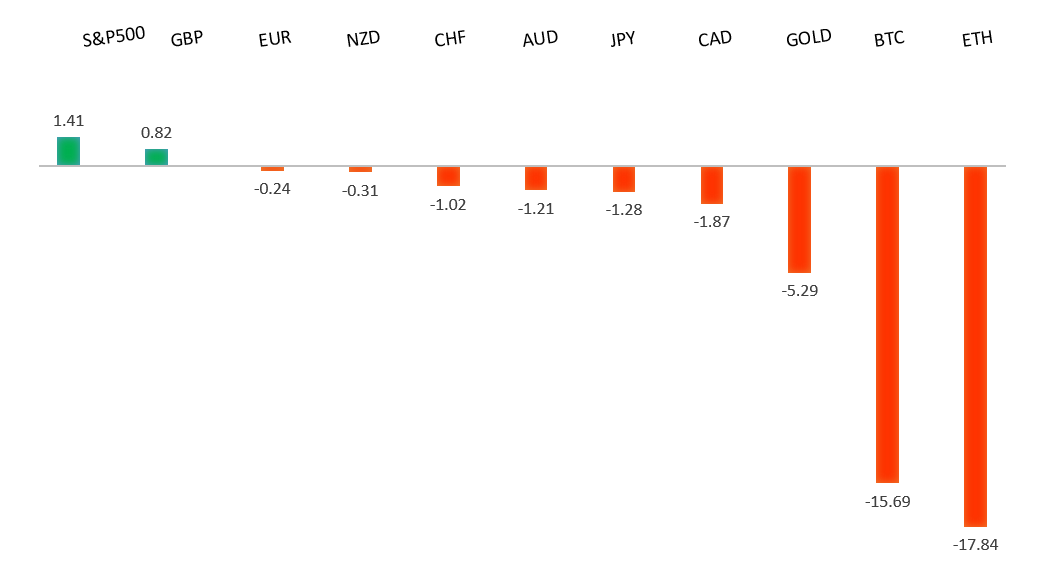
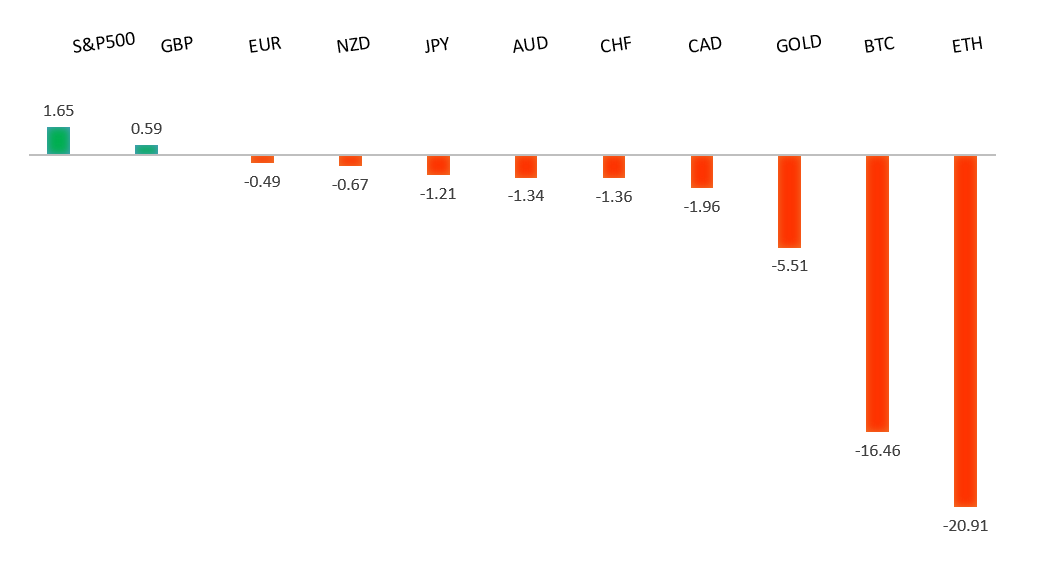
Performance chart 30day v. USD (%)
Performance Chart
 
 
Technical & fundamental highlights
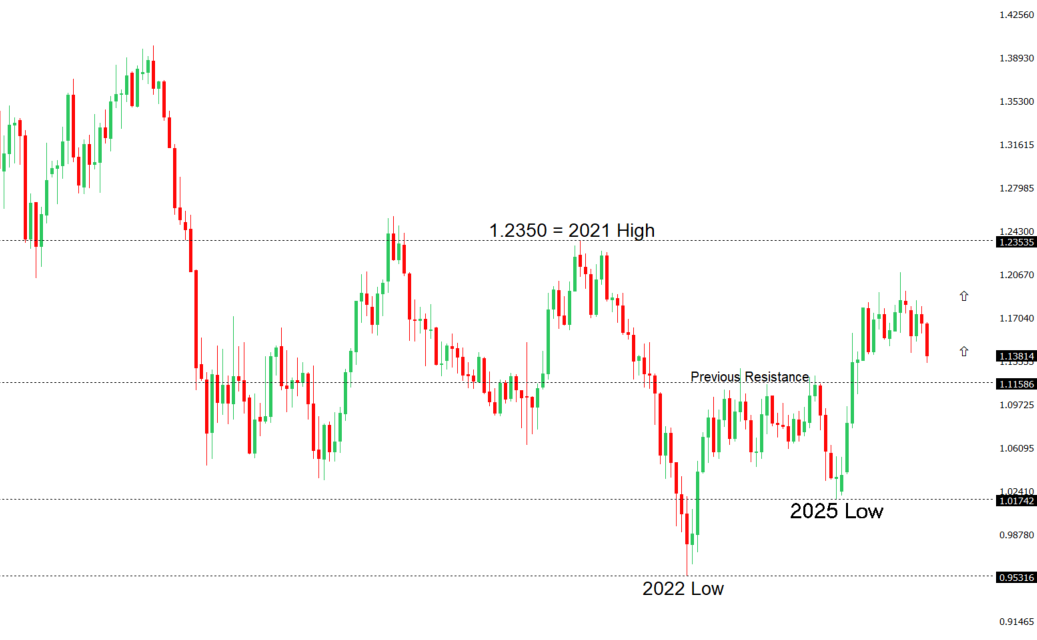
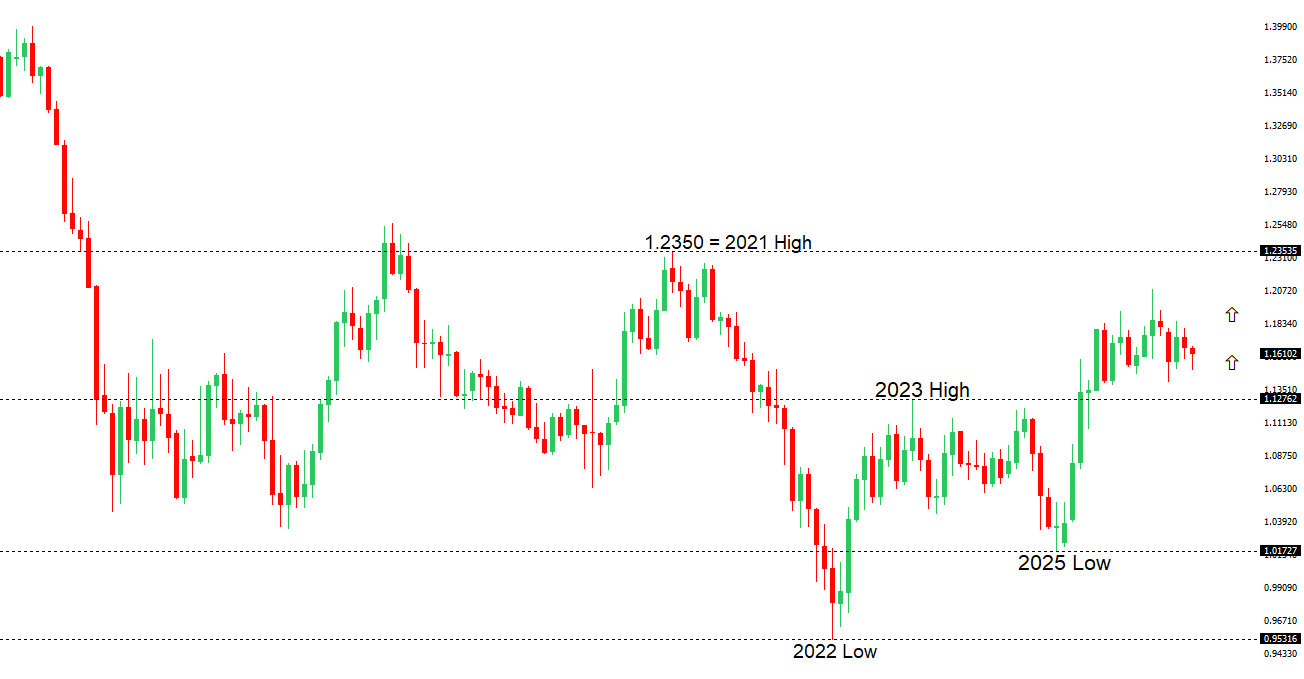
EURUSD: technical overview

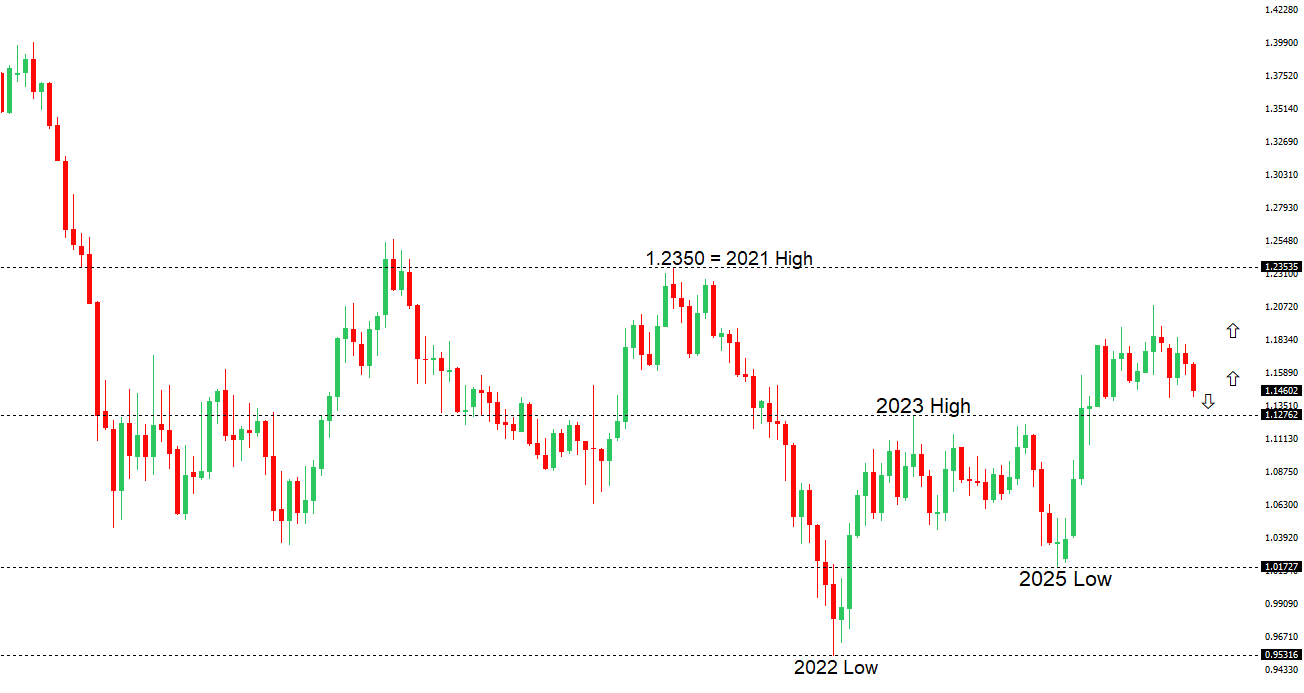
The Euro outlook remains constructive with higher lows sought out on dips in favor of the next major upside extension targeting the 2021 high at 1.2350. Setbacks should be exceptionally well supported ahead of 1.1300.

EURUSD Chart
R2 1.1646 - 4 June high - Medium
R1 1.1576 - 21 May low - Medium
S1 1.1500 - 8 June low - Medium
S2 1.1443 - 30 March low - Medium
EURUSD: fundamental overview

The Euro has traded in a relatively tight range, with EURUSD consolidating around the 1.1550 area as investors await the latest US CPI report for fresh direction. While the single currency continues to draw support from expectations that the European Central Bank will deliver a 25 basis point rate hike at Thursday’s meeting amid persistent inflation concerns, gains have been tempered by a cautious market mood ahead of key event risk from both the ECB and the Federal Reserve outlook. Recent easing in Middle East tensions has helped stabilize risk sentiment and reduce demand for traditional safe havens, although lingering geopolitical uncertainty continues to underpin the US Dollar at times. As a result, the near-term path for the Euro is being driven largely by the balance between a still relatively hawkish ECB, shifting US rate expectations following stronger US economic data, and the outcome of upcoming inflation figures that could reshape the outlook for Fed policy. Markets are widely expecting the ECB to raise rates this week, with attention likely to shift toward President Lagarde’s guidance on whether further tightening remains on the table later this year.

 
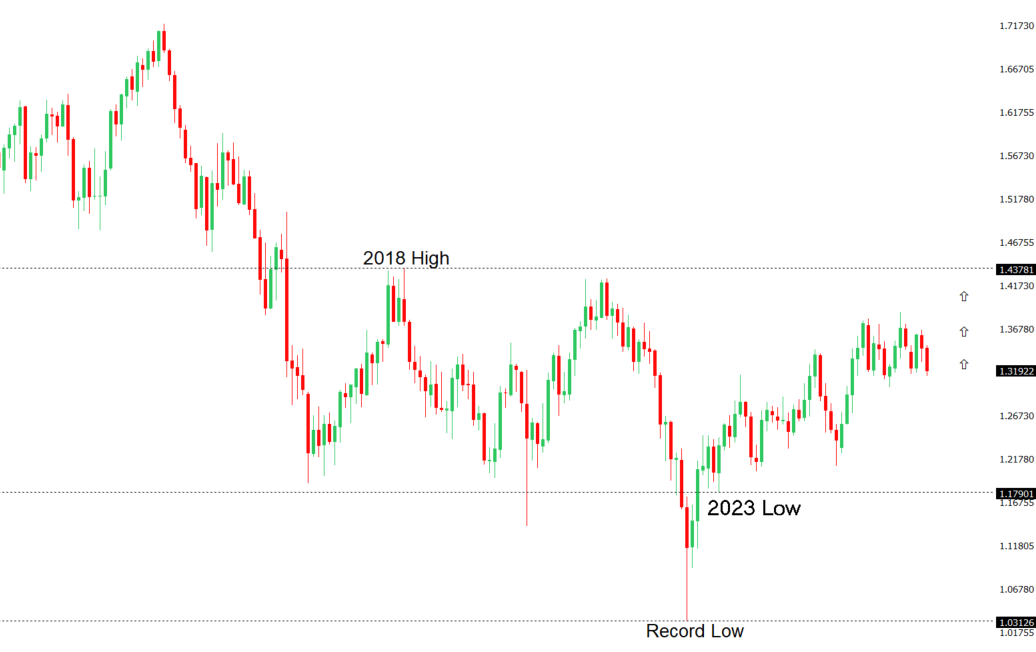
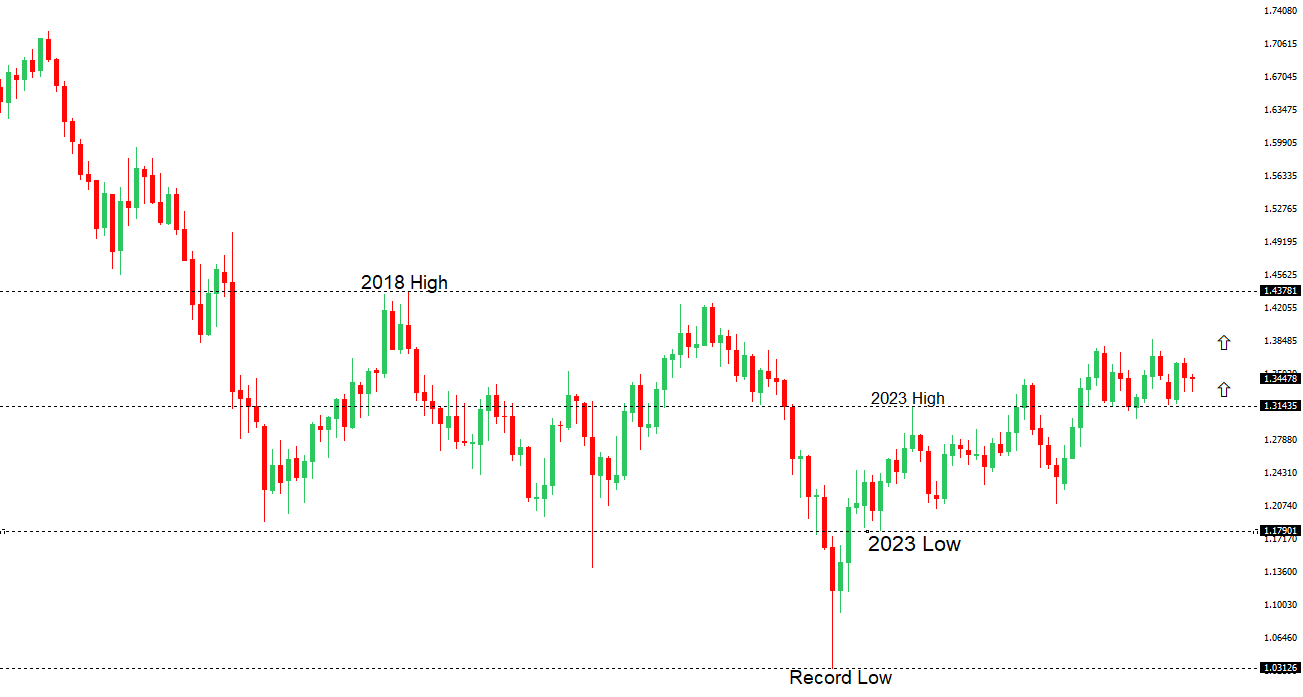
GBPUSD: technical overview

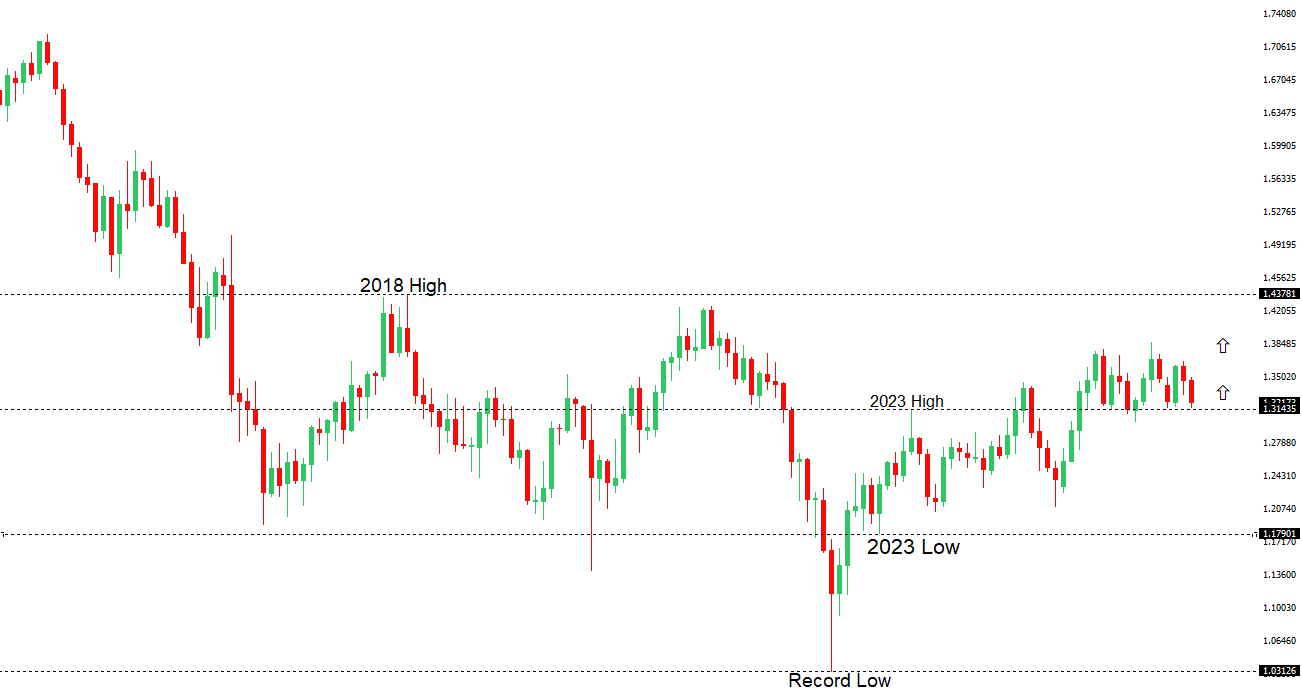
The Pound remains exceptionally well supported on dips into the 1.3000 area, with the price largely consolidating above the psychological barrier and previous resistance turned support in the form of the 2023 high. Look for the market to continue be well supported on dips ahead of the next major upside extension through the yearly high at 1.3870 and towards a retest of the 2018 high at 1.4377 further up. Only a monthly close below 1.3000 negates.

GBPUSD Chart
R2 1.3509 - 25 May high - Strong
R1 1.3400 - Figure - Medium
S1 1.3302 - 18 May low - Strong
S2 1.3219 - 13 March low - Medium
GBPUSD: fundamental overview

The Pound has been trading largely as a function of broader US Dollar dynamics, with investors balancing geopolitical developments, shifting central bank expectations, and a mixed domestic backdrop. An easing in direct hostilities between Israel and Iran has helped temper safe-haven demand for the Dollar, offering Sterling some support, although lingering uncertainty surrounding Iran’s nuclear program and the Strait of Hormuz continues to underpin defensive positioning in FX markets. At the same time, stronger-than-expected US labor market data and expectations for firmer US inflation have reinforced the view that the Federal Reserve could maintain a hawkish bias for longer, limiting GBPUSD upside. On the UK side, a sharp rebound in May BRC retail sales provided a rare positive surprise for the domestic economy, though markets have been reluctant to extrapolate too much from the data given concerns that April GDP likely contracted and growth momentum remains fragile. The Bank of England also finds itself in a difficult position, with policymakers increasingly acknowledging that higher energy costs could keep inflation elevated even as economic activity softens. While some officials have signaled concern about broadening price pressures, the market expects the BoE to remain on hold at its upcoming meeting, leaving Sterling without a strong domestic policy catalyst. As a result, attention remains firmly fixed on incoming US CPI data and Friday’s UK GDP release, both of which have the potential to reshape expectations for the Fed and the BoE and drive the next meaningful move in the Pound.

 
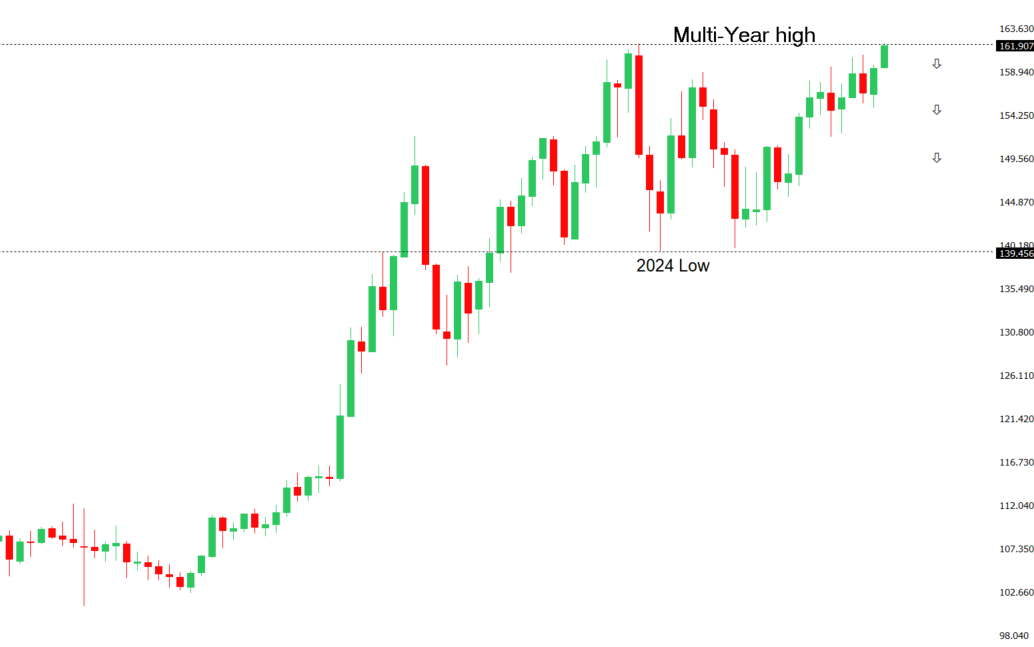
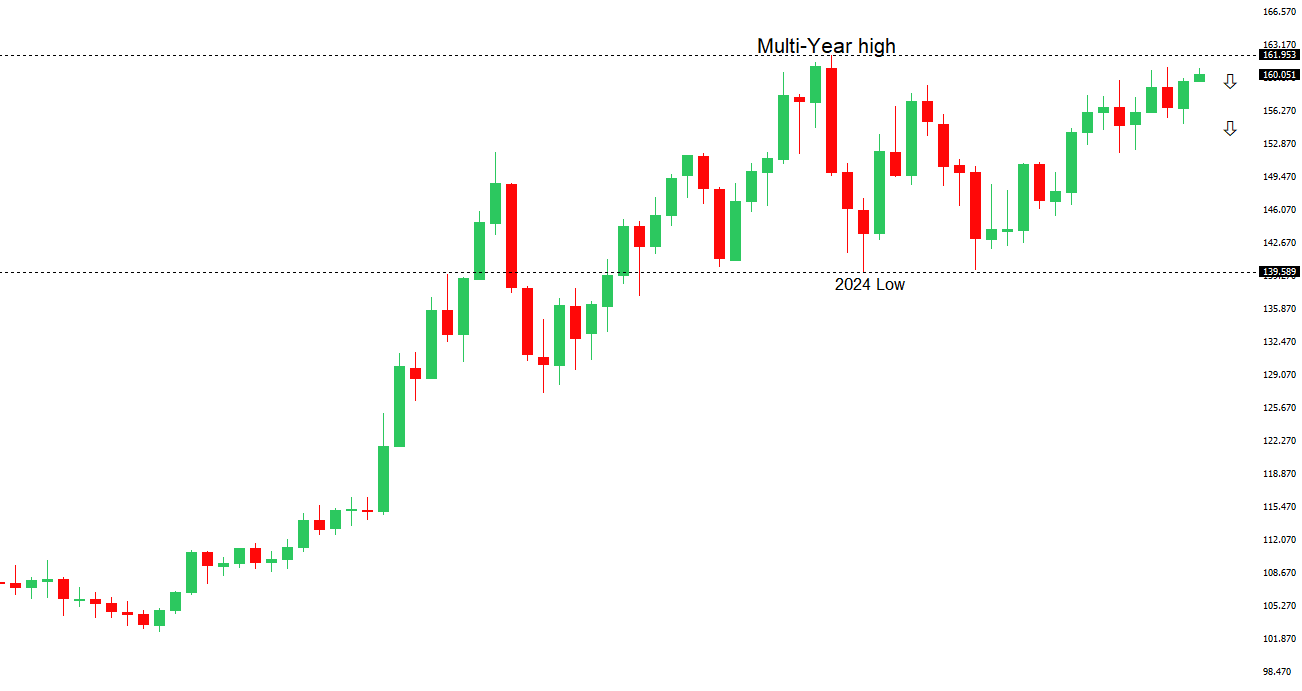
USDJPY: technical overview

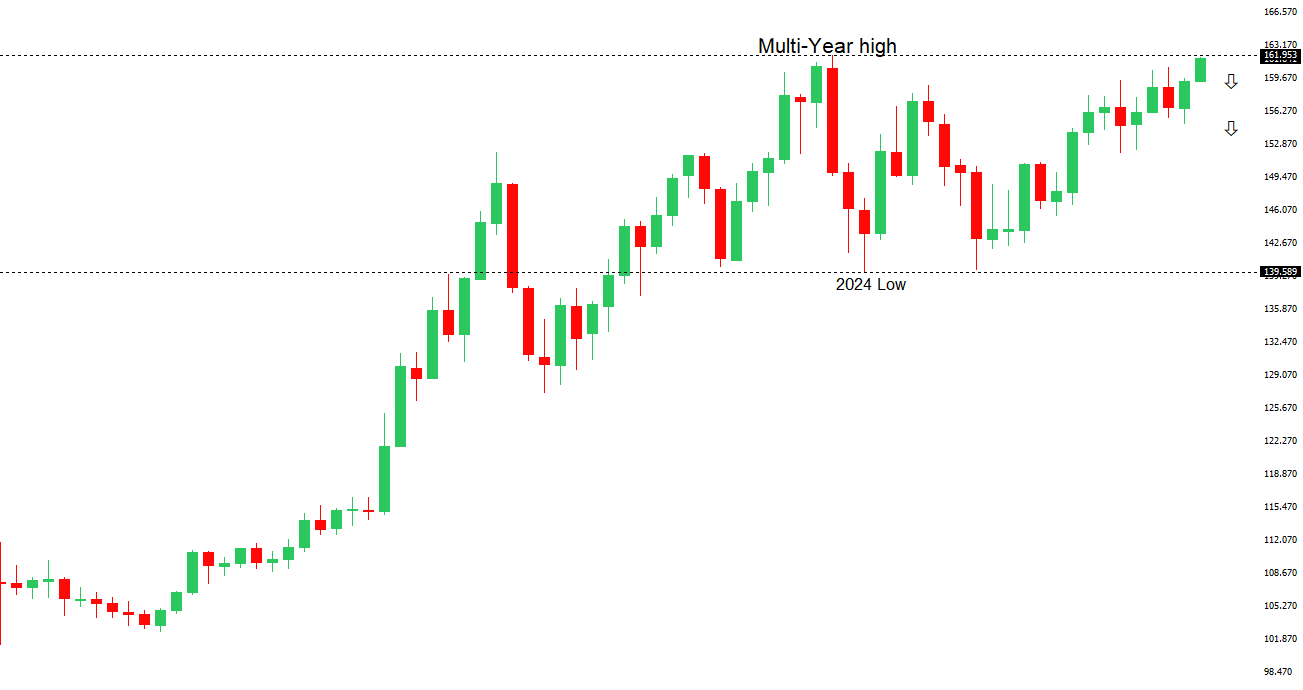
There are signs of the formation of a meaningful top after the market put in a multi-year high in 2024. At this point, rallies should be well capped above 160.00 in favor of a fresh down-leg back towards the 2024 low at 139.58. Only a monthly close above 160.00 negates.

USDJPY Chart
R2 160.73 - 30 April/2026 high - Strong
R1 160.45 - 9 June high - Strong
S1 159.37 - 3 June low - Medium
S2 158.59 - 20 May low - Medium
USDJPY: fundamental overview

The Yen remains under pressure as escalating tensions in the Middle East continue to weigh on Japan’s economic outlook and support safe-haven demand for the US Dollar, keeping USDJPY pinned near the critical 160.50 intervention zone. Although Japan’s latest Producer Price Index surprised to the upside, reinforcing expectations that the Bank of Japan will continue normalizing policy, markets remain unconvinced that additional tightening alone will be sufficient to materially narrow the still-wide US-Japan yield differential. Investors are increasingly treating an expected BoJ rate hike to 1.00% at next week’s meeting as a foregone conclusion, with some economists projecting rates could rise further later this year. However, stronger US data, reduced expectations for Federal Reserve easing, and concerns that higher energy prices stemming from Middle East disruptions will disproportionately hurt energy-importing Japan have continued to undermine the Yen. At the same time, repeated warnings from Japanese officials that they stand ready to act against excessive currency moves, particularly with USDJPY trading back near levels that previously triggered record intervention, are helping to limit more aggressive Yen selling. Attention now turns to upcoming US inflation data, with hotter-than-expected CPI or PPI readings likely to reinforce the higher-for-longer Fed narrative and potentially push USDJPY further into intervention territory, while softer inflation outcomes could offer the Yen a temporary reprieve.

 
AUDUSD: technical overview

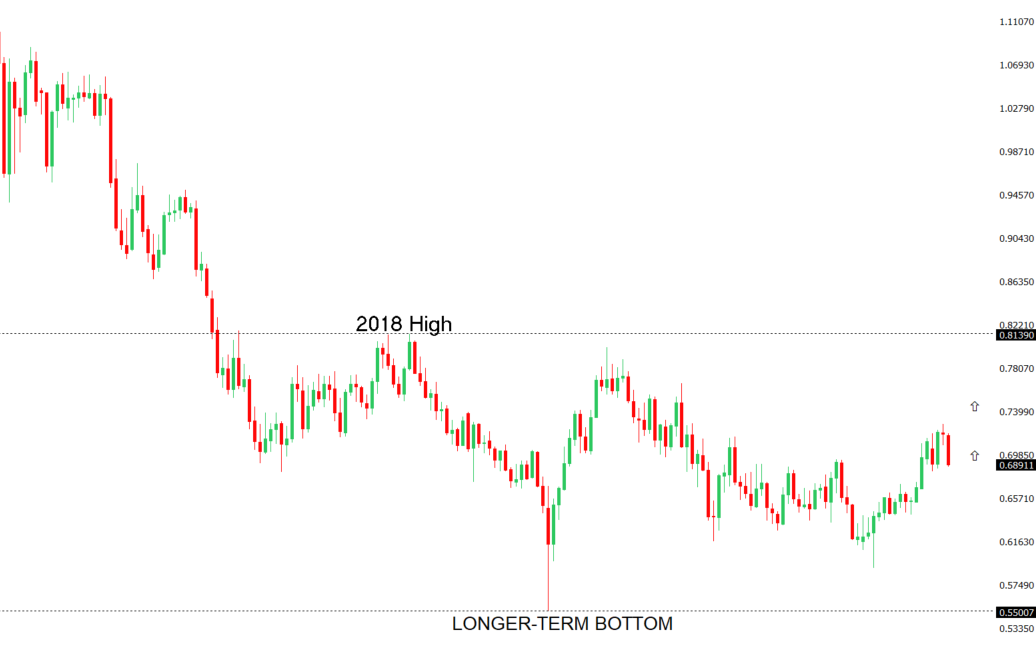
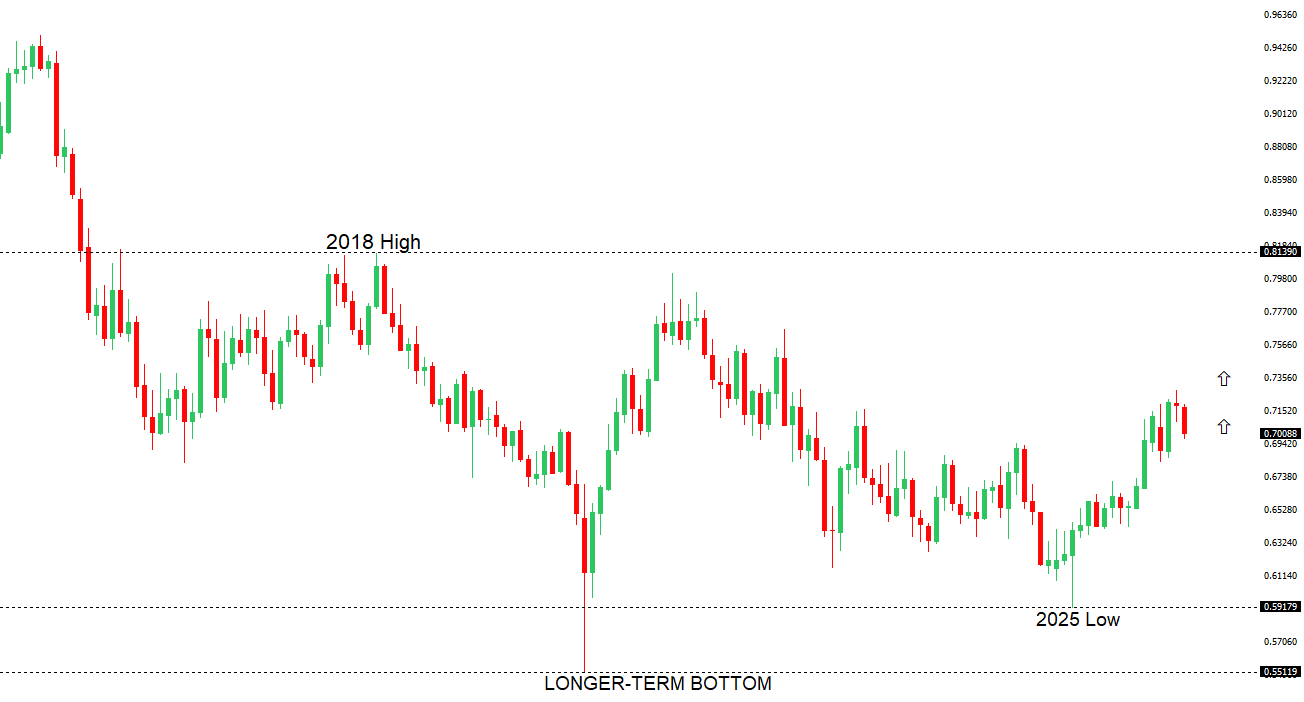
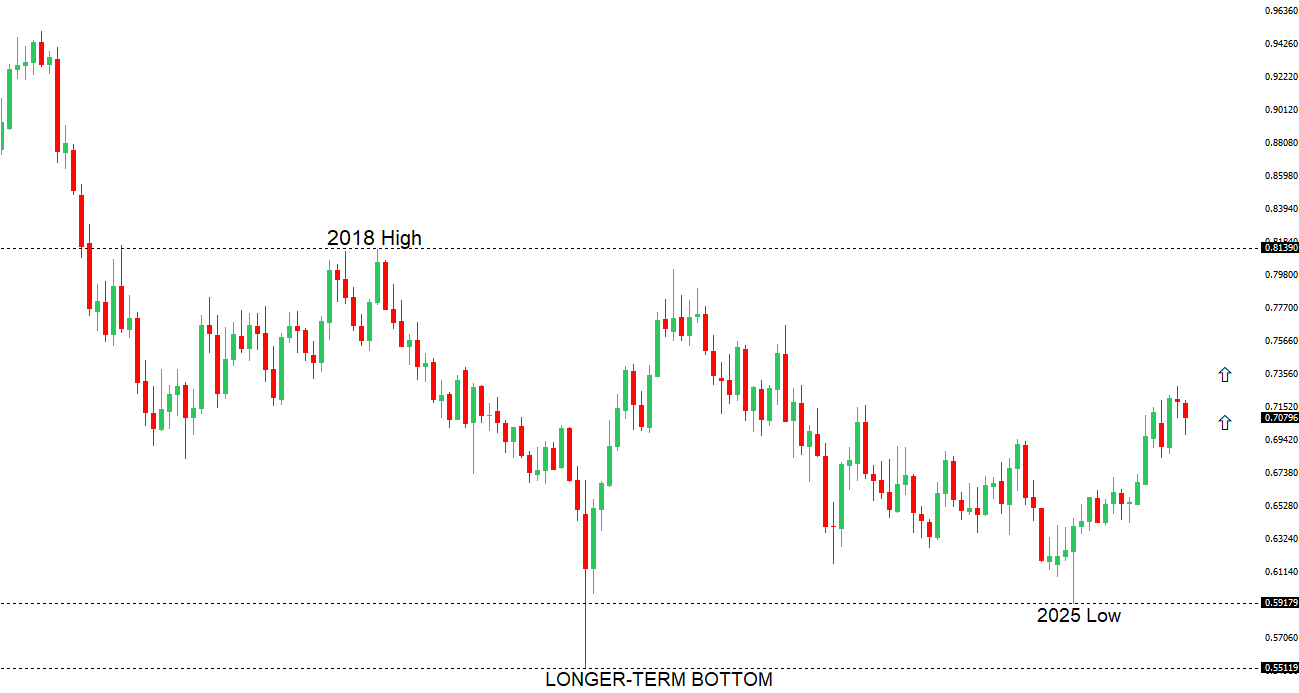
There are signs of the formation of a longer-term base with the market recovering out from a meaningful longer-term support zone. The latest monthly close back above 0.7000 takes the big picture pressure off the downside and strengthens the case for a bottom, with the focus now on a push towards 0.8000. Setbacks should now be well supported ahead of 0.6700.

AUDUSD Chart
R2 0.7201 - 29 May high - Strong
R1 0.7100 - Figure - Medium
S1 0.7005 - 9 June low - Medium
S2 0.6963 - 8 April low - Strong
AUDUSD: fundamental overview

The Australian Dollar remains under pressure following mixed Chinese inflation data that offered little fresh directional impetus. China’s May CPI rose 1.2% annually, slightly below expectations, suggesting domestic demand remains uneven, while stronger-than-expected producer prices pointed to firmer industrial activity and resilience in parts of the manufacturing sector. Given China’s status as Australia’s largest trading partner, these data points remain important for the Aussie through trade and commodity demand channels, although the market reaction has been muted. More broadly, sentiment toward the AUD continues to be shaped by global risk dynamics, with renewed US strikes on Iran boosting safe-haven demand for the US Dollar and tempering hopes for a lasting Middle East peace deal. At the same time, the Australian currency is finding some support from expectations the RBA will maintain a relatively hawkish bias compared with several of its global peers, particularly as policymakers remain alert to persistent domestic inflation pressures. Looking ahead, traders are likely to remain cautious ahead of the latest US inflation data, which could significantly influence Federal Reserve expectations, Treasury yields, and broader risk appetite, all of which remain key drivers for the direction of AUDUSD.

 
Suggested reading

Wall Street Races “Onchain,” & the Scramble Begins, E. Ekshian, RCM (June 9, 2026)

An Average Economy: Not Great, Not Terrible, J. Calhoun, Alhambra (June 4, 2026)


Any opinions, news, research, analyses, prices or other information ("information") contained on this Blog, constitutes marketing communication and it has not been prepared in accordance with legal requirements designed to promote the independence of investment research. Further, the information contained within this Blog does not contain (and should not be construed as containing) investment advice or an investment recommendation, or an offer of, or solicitation for, a transaction in any financial instrument. LMAX Group has not verified the accuracy or basis-in-fact of any claim or statement made by any third parties as comments for every Blog entry.

LMAX Group will not accept liability for any loss or damage, including without limitation to, any loss of profit, which may arise directly or indirectly from use of or reliance on such information. No representation or warranty is given as to the accuracy or completeness of the above information. While the produced information was obtained from sources deemed to be reliable, LMAX Group does not provide any guarantees about the reliability of such sources. Consequently any person acting on it does so entirely at his or her own risk. It is not a place to slander, use unacceptable language or to promote LMAX Group or any other FX and CFD provider and any such postings, excessive or unjust comments and attacks will not be allowed and will be removed from the site immediately.

Day Image
9th June 2026 | view in browser
Risk returns, but the hard part lies ahead

Markets head into Tuesday with risk sentiment improving as investors look through recent geopolitical tensions, while turning their attention to key US inflation data, an expected ECB rate hike, persistent BOJ tightening speculation, and the sustainability of AI-driven gains in global equity markets.


Performance chart 30day v. USD (%)
Performance Chart
 
 
Technical & fundamental highlights
EURUSD: technical overview

The Euro outlook remains constructive with higher lows sought out on dips in favor of the next major upside extension targeting the 2021 high at 1.2350. Setbacks should be exceptionally well supported ahead of 1.1300.

EURUSD Chart
R2 1.1646 - 4 June high - Medium
R1 1.1576 - 21 May low - Medium
S1 1.1500 - 8 June low - Medium
S2 1.1443 - 30 March low - Medium
EURUSD: fundamental overview

The euro has been trading with a mixed bias, supported by expectations that the ECB will deliver another 25bp rate hike this week after Eurozone inflation accelerated to 3.2%, reinforcing the central bank’s hawkish stance and keeping the prospect of additional tightening on the table. Recent data has also been modestly encouraging, with Eurozone Sentix investor confidence improving in June, suggesting sentiment is becoming less pessimistic despite ongoing growth concerns. At the same time, upside in the single currency has been capped by renewed geopolitical uncertainty in the Middle East, with investors gravitating toward the safe-haven US Dollar after comments from Israeli Prime Minister Netanyahu indicated the conflict with Iran and Hezbollah may not yet be over. Looking ahead, the market’s focus is squarely on Thursday’s ECB decision and President Lagarde’s guidance on the policy outlook, while Wednesday’s US CPI report could also prove pivotal for EURUSD by influencing expectations around the Federal Reserve path and broader US Dollar direction.

 
GBPUSD: technical overview

The Pound remains exceptionally well supported on dips into the 1.3000 area, with the price largely consolidating above the psychological barrier and previous resistance turned support in the form of the 2023 high. Look for the market to continue be well supported on dips ahead of the next major upside extension through the yearly high at 1.3870 and towards a retest of the 2018 high at 1.4377 further up. Only a monthly close below 1.3000 negates.

GBPUSD Chart
R2 1.3509 - 25 May high - Strong
R1 1.3400 - Figure - Medium
S1 1.3302 - 18 May low - Strong
S2 1.3219 - 13 March low - Medium
GBPUSD: fundamental overview

The pound is finding solid underlying support on dips, backed by the UK’s one of the highest policy rates in the G7 (tied with the US at 3.75%) and a resilient inflation outlook that keeps the Bank of England from cutting rates aggressively. Despite a stronger-than-expected US jobs report reinforcing expectations of a more restrictive Federal Reserve that could even hike later in 2026, the yield advantage and BoE’s cautious stance continue to provide a firm floor for Sterling. While the BoE remains mindful of weakening growth, elevated energy prices are expected to keep inflation risks tilted higher toward 4%, limiting the scope for rapid easing and reinforcing rate support for the pound. The recent Israel-Lebanon ceasefire has improved risk sentiment and reduced safe-haven flows into the dollar, offering further tailwinds for GBPUSD on dips, even as lingering geopolitical tensions around Iran, the Gulf, and the Strait of Hormuz maintain a cautious backdrop. With traders now looking toward Friday’s UK GDP data for signs of resilience and tomorrow’s US inflation and labor market releases for Fed clues, the overall setup leaves GBPUSD well-supported on weakness while remaining capped by superior US fundamentals, favoring a range-bound to modestly constructive bias.

 
USDJPY: technical overview

There are signs of the formation of a meaningful top after the market put in a multi-year high in 2024. At this point, rallies should be well capped above 160.00 in favor of a fresh down-leg back towards the 2024 low at 139.58. Only a monthly close above 160.00 negates.

USDJPY Chart
R2 160.73 - 30 April/2026 high - Strong
R1 160.40 - 8 June high - Strong
S1 159.37 - 3 June low - Medium
S2 158.59 - 20 May low - Medium
USDJPY: fundamental overview

The yen remains primarily driven by the widening policy divergence between the Bank of Japan and the Federal Reserve, with stronger-than-expected US employment data reinforcing expectations that US rates will remain higher for longer and helping keep USDJPY above the psychologically important 160.00 level. At the same time, the yen continues to draw support from rising expectations for further BoJ policy normalization after stronger Japanese wage growth data reinforced the case for additional tightening later this month. However, the dominant theme remains growing intervention risk, with Japanese Finance Minister Katayama again warning that authorities stand ready to take decisive action against excessive currency weakness, while many market participants increasingly view the 160.00 area as a potential trigger point for official action. A modest easing in Israel-Iran tensions has also reduced safe-haven demand for both the US dollar and yen, leaving interest rate differentials and intervention concerns as the key drivers of price action ahead of this week’s US inflation data, which could significantly influence expectations for the Fed and the next move in USDJPY.

 
AUDUSD: technical overview

There are signs of the formation of a longer-term base with the market recovering out from a meaningful longer-term support zone. The latest monthly close back above 0.7000 takes the big picture pressure off the downside and strengthens the case for a bottom, with the focus now on a push towards 0.8000. Setbacks should now be well supported ahead of 0.6700.

AUDUSD Chart
R2 0.7201 - 29 May high - Strong
R1 0.7100 - Figure - Medium
S1 0.7018 - 8 June low - Medium
S2 0.6963 - 8 April low - Strong
AUDUSD: fundamental overview

The Australian dollar is finding support from an improving global risk backdrop and encouraging Chinese economic data, with AUDUSD rebounding toward 0.7050 after recent two-month lows. Easing tensions in the Middle East have weighed on the US dollar as oil prices retreat and investors become more willing to embrace risk, providing a tailwind for the Aussie. At the same time, stronger-than-expected Chinese trade figures have reinforced the outlook for Australia’s largest trading partner, with exports and imports both accelerating sharply in May, highlighting resilient demand for commodities, semiconductors and AI-related hardware. Domestically, the broader fundamental picture remains constructive, supported by still-elevated inflation and a Reserve Bank of Australia that continues to signal a cautious, hawkish stance, keeping the prospect of lower rates distant for now. While Australia’s economy has shown some signs of moderation through softer growth and a cooling labor market, inflation remains above target and policymakers continue to emphasize that policy must stay restrictive. As a result, the medium-term outlook for the Aussie remains underpinned by relatively high Australian yields, resilient domestic fundamentals and stabilization in China, although near-term direction continues to depend heavily on global risk sentiment, US dollar dynamics and geopolitical developments.

 
Suggested reading

Investors Confront The Reality of the AI Business, B. Berkowitz, Axios (June 7, 2026)

The Media Obsession With Nvidia & China, J. Tamny, Forbes (June 4, 2026)


Any opinions, news, research, analyses, prices or other information ("information") contained on this Blog, constitutes marketing communication and it has not been prepared in accordance with legal requirements designed to promote the independence of investment research. Further, the information contained within this Blog does not contain (and should not be construed as containing) investment advice or an investment recommendation, or an offer of, or solicitation for, a transaction in any financial instrument. LMAX Group has not verified the accuracy or basis-in-fact of any claim or statement made by any third parties as comments for every Blog entry.

LMAX Group will not accept liability for any loss or damage, including without limitation to, any loss of profit, which may arise directly or indirectly from use of or reliance on such information. No representation or warranty is given as to the accuracy or completeness of the above information. While the produced information was obtained from sources deemed to be reliable, LMAX Group does not provide any guarantees about the reliability of such sources. Consequently any person acting on it does so entirely at his or her own risk. It is not a place to slander, use unacceptable language or to promote LMAX Group or any other FX and CFD provider and any such postings, excessive or unjust comments and attacks will not be allowed and will be removed from the site immediately.

Day Image
8th June 2026 | view in browser
Hawkish Fed fears meet Middle East tensions

Markets begin the week balancing escalating Middle East tensions and surging oil prices against a stronger-than-expected US economy, with higher Treasury yields, a firmer dollar, and growing expectations that the Federal Reserve may need to keep policy tighter for longer.


Performance chart 30day v. USD (%)
Performance Chart
 
 
Technical & fundamental highlights
EURUSD: technical overview

The Euro outlook remains constructive with higher lows sought out on dips in favor of the next major upside extension targeting the 2021 high at 1.2350. Setbacks should be exceptionally well supported ahead of 1.1300.

EURUSD Chart
R2 1.1646 - 4 June high - Medium
R1 1.1576 - 21 May low - Medium
S1 1.1504 - 3 April low - Strong
S2 1.1443 - 30 March low - Medium
EURUSD: fundamental overview

The euro has come under pressure in recent sessions, with EURUSD retreating as a stronger-than-expected US labor market report prompted markets to scale back expectations for Federal Reserve easing and pushed US Treasury yields sharply higher. While Eurozone inflation remains elevated, with headline CPI accelerating to 3.2% in May and underlying price pressures showing signs of broadening, the ECB’s latest rate hike was fully priced and President Lagarde offered little indication of an accelerated tightening path beyond current expectations. At the same time, softer Eurozone growth signals have resurfaced, highlighted by a larger-than-expected 3.8% decline in German factory orders in April, reinforcing concerns over manufacturing momentum in the bloc’s largest economy. More broadly, the euro continues to benefit from improving investor sentiment toward Europe, expectations for increased fiscal spending and defense investment across the region, and a narrowing growth differential versus the US. However, near-term price action remains largely driven by shifts in Fed pricing, US yield dynamics, and broader risk sentiment, with geopolitical tensions in the Middle East adding an additional layer of uncertainty for global markets ahead of this week’s US CPI release and further ECB guidance.

 
USDJPY: technical overview

There are signs of the formation of a meaningful top after the market put in a multi-year high in 2024. At this point, rallies should be well capped above 160.00 in favor of a fresh down-leg back towards the 2024 low at 139.58. Only a monthly close above 160.00 negates.

USDJPY Chart
R2 160.73 - 30 April/2026 high - Strong
R1 160.40 - 8 June high - Strong
S1 159.37 - 3 June low - Medium
S2 158.59 - 20 May low - Medium
USDJPY: fundamental overview

The Japanese Yen remains under pressure, with USDJPY pushing back above the psychologically important 160.00 level, driven primarily by widening US-Japan rate differentials and a resurgence in US Dollar demand. Stronger-than-expected US labor market data, including a solid May nonfarm payrolls report and upward revisions to prior months, have reinforced expectations that the Federal Reserve will keep policy restrictive for longer, supporting higher US Treasury yields. At the same time, rising oil prices amid escalating Israel-Iran tensions have added another headwind for Japan, a major energy importer, worsening the country’s terms of trade and weighing on the Yen. On the domestic side, Japan’s Q1 GDP growth was revised modestly lower, highlighting some loss of economic momentum, although the data has done little to alter expectations for further Bank of Japan normalization. Indeed, stronger wage growth and persistent inflation pressures continue to support expectations for additional BoJ tightening in the months ahead. Nevertheless, for now, external factors remain dominant, with markets focused on the yield advantage of the Dollar and the risk that any sustained move above 160.00 could provoke another round of official intervention, particularly as Japanese authorities have stepped up warnings against excessive currency volatility.

 
AUDUSD: technical overview

There are signs of the formation of a longer-term base with the market recovering out from a meaningful longer-term support zone. The latest monthly close back above 0.7000 takes the big picture pressure off the downside and strengthens the case for a bottom, with the focus now on a push towards 0.8000. Setbacks should now be well supported ahead of 0.6700.

AUDUSD Chart
R2 0.7201 - 29 May high - Strong
R1 0.7100 - Figure - Medium
S1 0.7018 - 8 June low - Medium
S2 0.6963 - 8 April low - Strong
AUDUSD: fundamental overview

The Australian Dollar has entered a more consolidative phase after its strong rally earlier in the year, with gains increasingly capped by a resilient US Dollar and shifting global risk sentiment. On the domestic front, the currency continues to draw support from the Reserve Bank of Australia’s relatively hawkish stance, as policymakers maintain that inflation remains too elevated and signal that rates are likely to stay restrictive for longer. While recent Australian growth and labor market data have softened at the margin, inflation remains sticky enough to keep markets cautious about pricing in RBA easing. Externally, China – Australia’s largest trading partner – has stabilized rather than accelerated, providing a neutral backdrop for the Aussie through steady, though unspectacular, demand prospects. More recently, however, AUD performance has been dominated by broader macro drivers, including renewed Middle East tensions, which have boosted safe-haven demand for the US Dollar, alongside stronger-than-expected US economic data that has reinforced expectations for a higher-for-longer Federal Reserve policy stance. As a result, the Aussie remains supported by relatively constructive domestic fundamentals and RBA policy expectations, but its upside continues to be constrained by USD strength, geopolitical uncertainty, and the absence of a stronger growth impulse from China.

 
Suggested reading

The AI future we want, M. Murgia, Financial Times (May 31, 2026)

Other Nation’s Move To Gold Is Bad News For The Dollar, R. Forsyth, Barron’s (June 6, 2026)


Any opinions, news, research, analyses, prices or other information ("information") contained on this Blog, constitutes marketing communication and it has not been prepared in accordance with legal requirements designed to promote the independence of investment research. Further, the information contained within this Blog does not contain (and should not be construed as containing) investment advice or an investment recommendation, or an offer of, or solicitation for, a transaction in any financial instrument. LMAX Group has not verified the accuracy or basis-in-fact of any claim or statement made by any third parties as comments for every Blog entry.

LMAX Group will not accept liability for any loss or damage, including without limitation to, any loss of profit, which may arise directly or indirectly from use of or reliance on such information. No representation or warranty is given as to the accuracy or completeness of the above information. While the produced information was obtained from sources deemed to be reliable, LMAX Group does not provide any guarantees about the reliability of such sources. Consequently any person acting on it does so entirely at his or her own risk. It is not a place to slander, use unacceptable language or to promote LMAX Group or any other FX and CFD provider and any such postings, excessive or unjust comments and attacks will not be allowed and will be removed from the site immediately.

Day Image
5th June 2026 | view in browser
Payrolls, Persian Gulf and Policy: Markets face a three-way test

Markets head into today’s U.S. payrolls report with investors balancing escalating Middle East geopolitical risks, persistent U.S. economic resilience, BOJ tightening expectations, and growing political scrutiny of the AI trade, while the dollar, yields, oil, and risk assets await the next major catalyst.


Performance chart 30day v. USD (%)
Performance Chart
 
 
Technical & fundamental highlights
EURUSD: technical overview

The Euro outlook remains constructive with higher lows sought out on dips in favor of the next major upside extension targeting the 2021 high at 1.2350. Setbacks should be exceptionally well supported ahead of 1.1300.

EURUSD Chart
R2 1.1797 - 6 May high - Medium
R1 1.1722 - 14 May high - Medium
S1 1.1576 - 21 May low - Medium
S2 1.1504 - 3 April low - Strong
EURUSD: fundamental overview

The euro has remained well supported on the fundamentals, with recent Eurozone inflation data reinforcing expectations that the ECB will continue its gradual normalization path. Headline CPI accelerated to 3.2% in May, its highest level in more than two-and-a-half years, while core inflation rose to 2.5% and services inflation climbed to 3.5%, highlighting increasingly broad-based price pressures across the economy. The data has effectively cemented market expectations for another 25bp ECB rate hike next week, helping underpin demand for the single currency despite ongoing geopolitical uncertainty. At the same time, Eurozone growth dynamics have shown signs of stabilization, reducing concerns about an aggressive easing cycle and supporting a widening divergence with expectations for slower US economic momentum. Nevertheless, EURUSD has struggled to extend gains beyond the mid-1.16s as the dollar remains supported by safe-haven demand amid heightened Middle East tensions and ahead of key US labor market data, with investors looking to the latest Nonfarm Payrolls report for clues on the Federal Reserve’s policy outlook.

 
USDJPY: technical overview

There are signs of the formation of a meaningful top after the market put in a multi-year high in 2024. At this point, rallies should be well capped above 160.00 in favor of a fresh down-leg back towards the 2024 low at 139.58. Only a monthly close above 160.00 negates.

USDJPY Chart
R2 160.73 - 30 April/2026 high - Strong
R1 160.09 - 3 June high - Strong
S1 158.59 - 20 May low - Medium
S2 157.29 - 14 May low - Medium
USDJPY: fundamental overview

The Yen remains under pressure, with USDJPY hovering near the closely watched 160.00 level as widening US-Japan yield differentials continue to outweigh improving domestic fundamentals. While stronger-than-expected wage growth has reinforced expectations that the Bank of Japan will continue normalizing policy, and markets remain alert to the risk of official intervention should Yen weakness become disorderly, these supportive factors have so far failed to generate a sustained recovery. Instead, the Dollar has remained underpinned by resilient US economic data and expectations that the Federal Reserve will keep rates restrictive for longer, preserving the yield advantage in favor of the USD. At the same time, heightened geopolitical uncertainty in the Middle East has boosted demand for Dollar liquidity, further limiting Yen gains despite its traditional safe-haven status. As a result, the market continues to test Japan’s tolerance for currency weakness, with intervention rhetoric from Tokyo helping to slow, but not reverse, the broader trend of Yen depreciation.

 
AUDUSD: technical overview

There are signs of the formation of a longer-term base with the market recovering out from a meaningful longer-term support zone. The latest monthly close back above 0.7000 takes the big picture pressure off the downside and strengthens the case for a bottom, with the focus now on a push towards 0.8000. Setbacks should now be well supported ahead of 0.6700.

AUDUSD Chart
R2 0.7278 - 6 May/2026 high - Strong
R1 0.7222 - 17 April high - Medium
S1 0.7079 - 19 May low - Medium
S2 0.6963 - 8 April low - Strong
AUDUSD: fundamental overview

The Australian Dollar remains broadly supported by a still-resilient domestic economy and the Reserve Bank of Australia’s increasingly “higher-for-longer” policy stance, although gains have recently stalled near the 0.7200 area. While headline inflation has continued to ease, underlying price pressures remain sticky, with trimmed mean inflation still running above the RBA’s target range, reinforcing Governor Bullock’s message that policymakers will do whatever is necessary to restore price stability. Markets continue to price a prolonged period of restrictive policy, with the cash rate held at 4.35% and expectations for additional tightening still lingering. Domestic growth has softened from earlier levels and labor market conditions are gradually cooling, but activity remains comparatively robust relative to many G10 peers. External factors have also become increasingly important for the Aussie, with swings in global risk sentiment and developments in the Middle East driving near-term price action. Recent optimism around a potential easing of tensions between the US and Iran weighed on the US Dollar and supported risk-sensitive currencies, though renewed uncertainty surrounding negotiations has helped underpin safe-haven demand for the Greenback. Meanwhile, China remains more of a stabilizing influence than a growth engine for Australia, with improving business surveys helping offset softer activity data and ongoing concerns around domestic demand. Overall, the fundamental backdrop remains constructive for the Australian Dollar, supported by a hawkish RBA, relatively firm domestic conditions, and investor positioning that continues to favor the currency, although further upside will likely require either a renewed improvement in global risk appetite or another leg lower in the US Dollar.

 
Suggested reading

My Favorite New Words For Traders of 2026, J. Parets, Trend Labs (June 2, 2026)

Being Useful is More Attractive Than Being Rich, N. Maggiulli, Of Dollars and Data (June 2, 2026)


Any opinions, news, research, analyses, prices or other information ("information") contained on this Blog, constitutes marketing communication and it has not been prepared in accordance with legal requirements designed to promote the independence of investment research. Further, the information contained within this Blog does not contain (and should not be construed as containing) investment advice or an investment recommendation, or an offer of, or solicitation for, a transaction in any financial instrument. LMAX Group has not verified the accuracy or basis-in-fact of any claim or statement made by any third parties as comments for every Blog entry.

LMAX Group will not accept liability for any loss or damage, including without limitation to, any loss of profit, which may arise directly or indirectly from use of or reliance on such information. No representation or warranty is given as to the accuracy or completeness of the above information. While the produced information was obtained from sources deemed to be reliable, LMAX Group does not provide any guarantees about the reliability of such sources. Consequently any person acting on it does so entirely at his or her own risk. It is not a place to slander, use unacceptable language or to promote LMAX Group or any other FX and CFD provider and any such postings, excessive or unjust comments and attacks will not be allowed and will be removed from the site immediately.

Day Image
4th June 2026 | view in browser
Markets navigate a fragile equilibrium

Markets remain driven by a fragile mix of Middle East geopolitical risk, sticky inflation and Fed uncertainty, and the ongoing AI investment boom, supporting the US dollar, underpinning oil and gold, and keeping broader risk sentiment cautious despite resilient equity valuations.


Performance chart 30day v. USD (%)
Performance Chart
 
 
Technical & fundamental highlights
EURUSD: technical overview

The Euro outlook remains constructive with higher lows sought out on dips in favor of the next major upside extension targeting the 2021 high at 1.2350. Setbacks should be exceptionally well supported ahead of 1.1300.

EURUSD Chart
R2 1.1797 - 6 May high - Medium
R1 1.1722 - 14 May high - Medium
S1 1.1576 - 21 May low - Medium
S2 1.1504 - 3 April low - Strong
EURUSD: fundamental overview

The euro has remained broadly supported on the back of a steadily more hawkish ECB outlook, with markets increasingly convinced the central bank will deliver a 25bp rate hike at next week’s meeting and potentially follow up with additional tightening later this year as inflation pressures remain elevated. Recent data showed Eurozone CPI accelerating to 3.2% in May, with core inflation also firming, reinforcing concerns that higher energy costs linked to Middle East tensions are feeding into broader price pressures. At the same time, ECB officials have continued to signal a willingness to act to prevent inflation expectations from becoming entrenched, helping underpin Euro demand despite signs of slowing regional growth and softer business activity data. More recently, easing geopolitical tensions following a reported Israel-Lebanon ceasefire have weighed on safe-haven demand for the US dollar, allowing EURUSD to be supported into dips. That said, upside in the single currency remains tempered by lingering uncertainty surrounding the broader Middle East conflict, elevated oil prices, and expectations that the Federal Reserve could maintain a relatively hawkish policy stance if US inflation risks persist.

 
USDJPY: technical overview

There are signs of the formation of a meaningful top after the market put in a multi-year high in 2024. At this point, rallies should be well capped above 160.00 in favor of a fresh down-leg back towards the 2024 low at 139.58. Only a monthly close above 160.00 negates.

USDJPY Chart
R2 160.73 - 30 April/2026 high - Strong
R1 160.09 - 3 June high - Strong
S1 158.59 - 20 May low - Medium
S2 157.29 - 14 May low - Medium
USDJPY: fundamental overview

The yen remains under pressure as the fundamental backdrop continues to favor capital outflows and a wide yield advantage for the US dollar. While Japanese officials have stepped up verbal intervention, with Prime Minister Takaichi, Finance Minister Katayama, and other policymakers reiterating their readiness to act against excessive and speculative FX moves, markets remain focused on the underlying drivers of yen weakness. Despite the Bank of Japan’s gradual normalization efforts and rising JGB yields, Japanese rates remain well below US Treasury yields, preserving the attractiveness of dollar assets and carry trades. At the same time, Japan’s status as a major energy importer leaves the economy vulnerable to elevated oil prices and geopolitical tensions, which can worsen the trade balance and weigh on the currency. Investors also remain unconvinced that the BoJ will tighten policy aggressively enough to materially narrow rate differentials, with government officials continuing to stress that specific policy measures remain the central bank’s decision. As a result, while intervention threats may slow the pace of USDJPY gains around the closely watched 160 level, markets continue to see sustained yen strength as unlikely absent a more pronounced slowdown in the US economy, a sharper narrowing in US-Japan yield spreads, or a significantly more hawkish shift from the BoJ.

 
AUDUSD: technical overview

There are signs of the formation of a longer-term base with the market recovering out from a meaningful longer-term support zone. The latest monthly close back above 0.7000 takes the big picture pressure off the downside and strengthens the case for a bottom, with the focus now on a push towards 0.8000. Setbacks should now be well supported ahead of 0.6700.

AUDUSD Chart
R2 0.7278 - 6 May/2026 high - Strong
R1 0.7222 - 17 April high - Medium
S1 0.7079 - 19 May low - Medium
S2 0.6963 - 8 April low - Strong
AUDUSD: fundamental overview

The Australian Dollar has been underpinned by a combination of resilient domestic fundamentals and a still-hawkish Reserve Bank of Australia, with AUD finding support after April trade data showed a stronger-than-expected return to surplus as exports surged 7.2% month-on-month, driven by solid shipments of iron ore, coal and LPG, while import growth slowed sharply. The data reinforced the view that external demand remains supportive despite a moderation in domestic activity. On the monetary policy front, RBA Governor Bullock reiterated that inflation remains too high and is expected to rise further in the near term, maintaining a tightening bias even as the central bank paused after three consecutive rate hikes. While recent GDP figures and easing unit labor cost growth have strengthened expectations that the RBA may remain on hold for now, markets continue to price a meaningful chance of another hike later this year should inflation prove sticky. More broadly, the AUD has also benefited from an improvement in global risk sentiment and ongoing US dollar softness, though gains have been tempered by concerns over slowing Australian household demand, a cooling housing market, and rising geopolitical tensions in the Middle East, which have boosted safe-haven demand for the US dollar and increased uncertainty around the global growth outlook.

 
Suggested reading

Three examples of how AI could work for good, M. Murgia, Financial Times (May 31, 2026)

The Fed’s Balance Sheet Is Costly No Matter What, N. Michel, Cato (June 2, 2026)


Any opinions, news, research, analyses, prices or other information ("information") contained on this Blog, constitutes marketing communication and it has not been prepared in accordance with legal requirements designed to promote the independence of investment research. Further, the information contained within this Blog does not contain (and should not be construed as containing) investment advice or an investment recommendation, or an offer of, or solicitation for, a transaction in any financial instrument. LMAX Group has not verified the accuracy or basis-in-fact of any claim or statement made by any third parties as comments for every Blog entry.

LMAX Group will not accept liability for any loss or damage, including without limitation to, any loss of profit, which may arise directly or indirectly from use of or reliance on such information. No representation or warranty is given as to the accuracy or completeness of the above information. While the produced information was obtained from sources deemed to be reliable, LMAX Group does not provide any guarantees about the reliability of such sources. Consequently any person acting on it does so entirely at his or her own risk. It is not a place to slander, use unacceptable language or to promote LMAX Group or any other FX and CFD provider and any such postings, excessive or unjust comments and attacks will not be allowed and will be removed from the site immediately.

Day Image
3rd June 2026 | view in browser
Tariffs, tankers and turbulence

Markets remain dominated by a toxic mix of escalating Middle East conflict, rising oil prices, and the resurgence of Trump’s tariff agenda, supporting the US dollar and crude while raising stagflation risks and leaving investors increasingly cautious on global growth and risk assets.


Performance chart 30day v. USD (%)
Performance Chart
 
 
Technical & fundamental highlights
EURUSD: technical overview

The Euro outlook remains constructive with higher lows sought out on dips in favor of the next major upside extension targeting the 2021 high at 1.2350. Setbacks should be exceptionally well supported ahead of 1.1300.

EURUSD Chart
R2 1.1797 - 6 May high - Medium
R1 1.1722 - 14 May high - Medium
S1 1.1576 - 21 May low - Medium
S2 1.1504 - 3 April low - Strong
EURUSD: fundamental overview

The euro has remained relatively well supported on the fundamentals, underpinned by a renewed hawkish shift in ECB expectations after Eurozone inflation surprised to the upside in May, with headline HICP accelerating to 3.2% year-over-year. Recent comments from ECB officials have reinforced the view that policymakers remain concerned about inflation risks, particularly against the backdrop of higher energy prices stemming from escalating Middle East tensions and the closure of the Strait of Hormuz. ECB Governing Council members Olli Rehn, Gediminas Simkus and Pierre Wunsch have all signaled support for a June rate hike, with Wunsch noting that the case for tightening remains compelling if geopolitical tensions persist and warning against relying solely on market pricing to do the ECB’s work. At the same time, the euro’s gains have been tempered by a broader risk-off environment that has boosted demand for the US dollar as a safe haven. Stronger-than-expected US data, including a rise in ISM manufacturing activity to its highest level since 2022 and a sharp increase in job openings, has reinforced the narrative of higher-for-longer Fed policy, limiting EURUSD upside despite increasingly hawkish ECB rhetoric. Overall, markets continue to balance a more restrictive ECB outlook against the support being generated for the dollar from geopolitical uncertainty and resilient US economic performance.

 
USDJPY: technical overview

There are signs of the formation of a meaningful top after the market put in a multi-year high in 2024. At this point, rallies should be well capped above 160.00 in favor of a fresh down-leg back towards the 2024 low at 139.58. Only a monthly close above 160.00 negates.

USDJPY Chart
R2 160.73 - 30 April/2026 high - Strong
R1 160.00 - Psychological - Strong
S1 158.59 - 20 May low - Medium
S2 157.29 - 14 May low - Medium
USDJPY: fundamental overview

The yen remains under broad pressure, with USDJPY once again testing the key 160 area as the wide US-Japan rate differential continues to favor the dollar, particularly against a backdrop of resilient US data and expectations that the Federal Reserve will keep policy restrictive for longer. At the same time, the Bank of Japan has been slow to normalize policy despite underlying inflation remaining above target and growing speculation that it could deliver another rate hike this month. Rising Middle East tensions and elevated oil prices have added another headwind for the yen, given Japan’s heavy reliance on imported energy, worsening the terms-of-trade impact and increasing demand for dollars. While safe-haven flows would normally support the yen, geopolitical uncertainty has instead reinforced demand for the US dollar as the world’s primary reserve currency. Against this backdrop, markets are increasingly focused on the risk of official intervention, with Japanese authorities reiterating their readiness to act against excessive or speculative currency moves after spending a record ¥11.7 trillion supporting the yen in late April and May. However, the limited and short-lived impact of previous intervention efforts suggests that without a more meaningful narrowing of yield differentials through further BOJ tightening, underlying yen weakness is likely to persist.

 
AUDUSD: technical overview

There are signs of the formation of a longer-term base with the market recovering out from a meaningful longer-term support zone. The latest monthly close back above 0.7000 takes the big picture pressure off the downside and strengthens the case for a bottom, with the focus now on a push towards 0.8000. Setbacks should now be well supported ahead of 0.6700.

AUDUSD Chart
R2 0.7278 - 6 May/2026 high - Strong
R1 0.7222 - 17 April high - Medium
S1 0.7079 - 19 May low - Medium
S2 0.6963 - 8 April low - Strong
AUDUSD: fundamental overview

The Australian Dollar has come under renewed pressure after Q1 GDP growth slowed to just 0.3% q/q, undershooting expectations and reinforcing the view that the Australian economy is losing momentum amid elevated borrowing costs and softer domestic demand. The weaker growth backdrop has prompted markets to scale back expectations for additional RBA tightening, particularly against a backdrop of a cooling labor market and contracting services activity. At the same time, escalating Middle East tensions have boosted safe-haven demand for the US Dollar while raising concerns about the growth implications of persistently high energy prices for Australia. Offsetting some of these headwinds, China’s latest data have offered a constructive signal for Australia’s external outlook, with the May Caixin Services PMI jumping to 54.4 from 52.6, marking the fastest expansion in three months and highlighting resilient domestic demand and improving employment conditions. The strong Chinese services reading reinforces expectations that Beijing’s policy support measures are helping cushion the economy from global shocks, providing a degree of support for Australia’s commodity and export sectors. However, for now, the market appears more focused on weakening domestic Australian growth dynamics and reduced RBA rate expectations, leaving the AUD vulnerable despite the relatively encouraging China backdrop.

 
Suggested reading

Find Your Inner J.P. Morgan, Plus Be Patient, J. Calhoun, Alhambra (May 31, 2026)

AI Will Create More Jobs, Not Fewer, T. Slok, Apollo (June 1, 2026)


Any opinions, news, research, analyses, prices or other information ("information") contained on this Blog, constitutes marketing communication and it has not been prepared in accordance with legal requirements designed to promote the independence of investment research. Further, the information contained within this Blog does not contain (and should not be construed as containing) investment advice or an investment recommendation, or an offer of, or solicitation for, a transaction in any financial instrument. LMAX Group has not verified the accuracy or basis-in-fact of any claim or statement made by any third parties as comments for every Blog entry.

LMAX Group will not accept liability for any loss or damage, including without limitation to, any loss of profit, which may arise directly or indirectly from use of or reliance on such information. No representation or warranty is given as to the accuracy or completeness of the above information. While the produced information was obtained from sources deemed to be reliable, LMAX Group does not provide any guarantees about the reliability of such sources. Consequently any person acting on it does so entirely at his or her own risk. It is not a place to slander, use unacceptable language or to promote LMAX Group or any other FX and CFD provider and any such postings, excessive or unjust comments and attacks will not be allowed and will be removed from the site immediately.

Day Image
2nd June 2026 | view in browser
Pricing hope, hedging reality

Markets remain cautiously risk-sensitive as investors balance hopes for a US-Iran breakthrough against persistent geopolitical uncertainty, with elevated oil prices, yen intervention-watch, sticky inflation concerns, and softer equity futures driving a defensive tone across global assets.


Performance chart 30day v. USD (%)
Performance Chart
 
 
Technical & fundamental highlights
EURUSD: technical overview

The Euro outlook remains constructive with higher lows sought out on dips in favor of the next major upside extension targeting the 2021 high at 1.2350. Setbacks should be exceptionally well supported ahead of 1.1300.

EURUSD Chart
R2 1.1797 - 6 May high - Medium
R1 1.1722 - 14 May high - Medium
S1 1.1576 - 21 May low - Medium
S2 1.1504 - 3 April low - Strong
EURUSD: fundamental overview

The euro has remained well-supported above 1.16, driven primarily by a more hawkish shift in ECB expectations as policymakers grow increasingly concerned that the inflationary impact of elevated energy prices linked to Middle East tensions is broadening beyond the energy sector. ECB Executive Board member Isabel Schnabel has argued that the central bank can no longer look through the inflation shock, warning of rising risks of second-round effects and unanchored inflation expectations, prompting markets to price in additional rate hikes this year. Attention is now firmly on the latest Eurozone HICP release, with headline inflation expected to accelerate further after rising to 3.0% in April, reinforcing the view that price pressures remain well above the ECB’s 2% target. Recent national inflation readings from major economies including Spain and France have also surprised on the upside, adding to expectations that the ECB will maintain a tightening bias. At the same time, ongoing geopolitical uncertainty surrounding the Israel-Iran conflict, risks to global energy supply routes, and developments around the Strait of Hormuz continue to fuel concerns over persistent inflation pressures, helping underpin the euro even as broader risk sentiment remains fragile.

 
USDJPY: technical overview

There are signs of the formation of a meaningful top after the market put in a multi-year high in 2024. At this point, rallies should be well capped above 160.00 in favor of a fresh down-leg back towards the 2024 low at 139.58. Only a monthly close above 160.00 negates.

USDJPY Chart
R2 160.00 - Psychological - Strong
R1 159.77 - 1 June high - Medium
S1 158.59 - 20 May low - Medium
S2 157.29 - 14 May low - Medium
USDJPY: fundamental overview

The yen remains under pressure as markets continue to focus on the wide policy divergence between the Federal Reserve and Bank of Japan, with USDJPY pushing back toward the 160 level despite growing expectations for a BoJ rate hike at the June 15-16 meeting. While BoJ Governor Ueda has maintained a hawkish tone, warning about second-round inflation effects from higher energy prices, and market participants increasingly expect another rate increase alongside further policy normalization, these supportive factors for the yen have been offset by rising concerns over Japan’s vulnerability to elevated oil prices amid ongoing Middle East tensions. Higher energy costs are seen as a drag on Japan’s import-dependent economy even as they boost inflation. At the same time, resilient US economic data and persistent inflation concerns have reinforced expectations that US rates will remain higher for longer, sustaining favorable yield differentials for the dollar. Japanese authorities have also stepped up verbal intervention, with Finance Minister Katayama stressing close monitoring of markets and coordination with US counterparts, helping to curb speculative yen selling as traders remain wary of potential intervention should USDJPY extend gains beyond current levels. Meanwhile, rising Japanese government bond yields, with 10-year JGB yields at multi-decade highs, have fueled debate over the pace of BoJ normalization, with major financial institutions arguing that a clear roadmap for future tightening will be just as important as the June rate decision in restoring confidence in the yen.

 
AUDUSD: technical overview

There are signs of the formation of a longer-term base with the market recovering out from a meaningful longer-term support zone. The latest monthly close back above 0.7000 takes the big picture pressure off the downside and strengthens the case for a bottom, with the focus now on a push towards 0.8000. Setbacks should now be well supported ahead of 0.6700.

AUDUSD Chart
R2 0.7278 - 6 May/2026 high - Strong
R1 0.7222 - 17 April high - Medium
S1 0.7079 - 19 May low - Medium
S2 0.6963 - 8 April low - Strong
AUDUSD: fundamental overview

The Australian Dollar has come under modest pressure in recent sessions as investors reassess the domestic growth outlook ahead of Wednesday’s Q1 GDP release. A weaker-than-expected current account report, which showed the deficit widening to A$27.1 billion, alongside softer company profit data, reinforced concerns that growth momentum is slowing, with net exports now expected to subtract around 0.8 percentage points from quarterly GDP and government spending contributing little support. At the same time, signs of cooling domestic demand, including softer household consumption, a gradually weakening labor market and flat housing prices, suggest the Reserve Bank of Australia’s earlier tightening is beginning to bite. However, AUD downside remains tempered by the RBA’s still-hawkish policy stance, with sticky underlying inflation, rising wage pressures following Australia’s 4.75% minimum wage increase, and expectations from some banks for a further 25bp rate hike in August helping to support yield differentials. More broadly, the currency continues to take direction from global risk sentiment, developments in the Middle East and China’s economic performance, with China acting more as a stabilizing influence than a major growth tailwind for Australia. Overall, while softer near-term growth expectations have weighed on the AUD, the prospect of higher-for-longer Australian interest rates continues to provide an important fundamental offset.

 
Suggested reading

What Is The Optimal Number of Positions In A Portfolio?, B. Gilbert, Carson Group (May 27, 2026)

The Impact of AI on the Economy and Markets, T. Slok, Apollo (May 28, 2026)


Any opinions, news, research, analyses, prices or other information ("information") contained on this Blog, constitutes marketing communication and it has not been prepared in accordance with legal requirements designed to promote the independence of investment research. Further, the information contained within this Blog does not contain (and should not be construed as containing) investment advice or an investment recommendation, or an offer of, or solicitation for, a transaction in any financial instrument. LMAX Group has not verified the accuracy or basis-in-fact of any claim or statement made by any third parties as comments for every Blog entry.

LMAX Group will not accept liability for any loss or damage, including without limitation to, any loss of profit, which may arise directly or indirectly from use of or reliance on such information. No representation or warranty is given as to the accuracy or completeness of the above information. While the produced information was obtained from sources deemed to be reliable, LMAX Group does not provide any guarantees about the reliability of such sources. Consequently any person acting on it does so entirely at his or her own risk. It is not a place to slander, use unacceptable language or to promote LMAX Group or any other FX and CFD provider and any such postings, excessive or unjust comments and attacks will not be allowed and will be removed from the site immediately.

Day Image
1st June 2026 | view in browser
Priced for peace, hedged for conflict

Markets begin the week balancing resilient risk appetite against escalating Middle East uncertainty, with higher oil prices, a modest safe-haven bid in the US dollar, hawkish central bank rhetoric, and unresolved US-Iran negotiations emerging as the key drivers of FX, equities, and commodity price action.


Performance chart 30day v. USD (%)
Performance Chart
 
 
Technical & fundamental highlights
EURUSD: technical overview

The Euro outlook remains constructive with higher lows sought out on dips in favor of the next major upside extension targeting the 2021 high at 1.2350. Setbacks should be exceptionally well supported ahead of 1.1300.

EURUSD Chart
R2 1.1797 - 6 May high - Medium
R1 1.1722 - 14 May high - Medium
S1 1.1576 - 21 May low - Medium
S2 1.1504 - 3 April low - Strong
EURUSD: fundamental overview

The euro remains underpinned by a combination of ECB hawkishness and improving risk sentiment, with markets increasingly focused on the prospect of additional policy tightening from Frankfurt. The latest catalyst came from ECB Executive Board member Isabel Schnabel, who argued that the central bank can no longer look through the inflationary effects of the Iran conflict, warning that price pressures have broadened well beyond energy and that inflation expectations risk becoming unanchored. Importantly, Schnabel reframed the Iran shock as a more persistent global cost and demand shock rather than a temporary energy spike, signaling that further rate hikes remain firmly on the table and declining to place any ceiling on the tightening cycle. Markets are now fully pricing two additional ECB rate hikes over the next year and continue to assign meaningful odds of a third move. At the same time, tentative progress toward a longer-lasting ceasefire agreement between the US and Iran has helped support broader risk appetite, reducing some of the downside risks to the euro associated with energy supply disruptions. Against this backdrop, EURUSD remains supported on relative rate differentials, though gains have been tempered by a modest recovery in the US dollar ahead of this week’s key US labor market data, particularly the May nonfarm payrolls report.

 
USDJPY: technical overview

There are signs of the formation of a meaningful top after the market put in a multi-year high in 2024. At this point, rallies should be well capped above 160.00 in favor of a fresh down-leg back towards the 2024 low at 139.58. Only a monthly close above 160.00 negates.

USDJPY Chart
R2 160.00 - Psychological - Strong
R1 159.66 - 28 May high - Medium
S1 158.59 - 20 May low - Medium
S2 157.29 - 14 May low - Medium
USDJPY: fundamental overview

The Yen remains pressured by a combination of softer domestic growth signals and an unfavorable rate differential versus the US Dollar. The latest Ministry of Finance data showed Q1 corporate capital spending effectively stalled, rising just 0.047% y/y versus expectations for a 4.0% increase and slowing sharply from 6.5% in Q4, reinforcing expectations that Japan’s preliminary Q1 GDP growth estimate may be revised lower on June 8. The weak investment data, alongside concerns about the impact of elevated energy prices and Middle East tensions on Japan’s import-dependent economy, has largely offset support from increasingly hawkish Bank of Japan rhetoric. Governor Ueda recently reiterated concerns about inflation becoming more entrenched through second-round effects on wages and inflation expectations, keeping alive the prospect of further policy normalization. However, markets remain cautious about the BOJ’s ability to tighten aggressively given signs of slowing domestic demand and subdued capital expenditure despite strong corporate profits, which rose 14.6% y/y in Q1. At the same time, persistent yield spreads between US Treasuries and JGBs continue to favor Dollar demand, while resilient US economic data has encouraged investors to scale back Fed easing expectations. As a result, USDJPY remains supported despite growing expectations for further BOJ normalization, with incoming inflation data and the June GDP revision likely to play a key role in shaping near-term Yen direction.

 
AUDUSD: technical overview

There are signs of the formation of a longer-term base with the market recovering out from a meaningful longer-term support zone. The latest monthly close back above 0.7000 takes the big picture pressure off the downside and strengthens the case for a bottom, with the focus now on a push towards 0.8000. Setbacks should now be well supported ahead of 0.6700.

AUDUSD Chart
R2 0.7278 - 6 May/2026 high - Strong
R1 0.7222 - 17 April high - Medium
S1 0.7079 - 19 May low - Medium
S2 0.6963 - 8 April low - Strong
AUDUSD: fundamental overview

The Australian dollar has remained relatively resilient, with AUDUSD hovering just below the 0.7200 level and near recent two-week highs, supported by signs of stabilization in Chinese manufacturing activity and broader optimism around Australia’s key export outlook. However, gains continue to be capped by a stronger US dollar backdrop, as persistent US inflation pressures reinforce expectations that the Federal Reserve will keep policy restrictive for longer. Geopolitical uncertainty surrounding the fragile US-Iran ceasefire and ongoing concerns over the Strait of Hormuz have also underpinned safe-haven demand for the greenback. On the domestic side, markets have tempered expectations for further RBA tightening, reducing one source of support for the Aussie. Meanwhile, investors are also monitoring Beijing’s latest efforts to tighten oversight of outbound investment and technology transfers, a move that reinforces China’s focus on economic self-reliance and could have implications for future trade and investment flows across the region. More broadly, the AUD continues to take direction from China’s growth outlook, commodity price dynamics—particularly iron ore—and evolving interest rate expectations between the RBA and the Fed.

 
Suggested reading

Are consumers ready for humanoid robots?, C. Criddle, Financial Times (May 29, 2026)

The AI Future we want, M. Murgia, Financial Times (May 31, 2026)


Any opinions, news, research, analyses, prices or other information ("information") contained on this Blog, constitutes marketing communication and it has not been prepared in accordance with legal requirements designed to promote the independence of investment research. Further, the information contained within this Blog does not contain (and should not be construed as containing) investment advice or an investment recommendation, or an offer of, or solicitation for, a transaction in any financial instrument. LMAX Group has not verified the accuracy or basis-in-fact of any claim or statement made by any third parties as comments for every Blog entry.

LMAX Group will not accept liability for any loss or damage, including without limitation to, any loss of profit, which may arise directly or indirectly from use of or reliance on such information. No representation or warranty is given as to the accuracy or completeness of the above information. While the produced information was obtained from sources deemed to be reliable, LMAX Group does not provide any guarantees about the reliability of such sources. Consequently any person acting on it does so entirely at his or her own risk. It is not a place to slander, use unacceptable language or to promote LMAX Group or any other FX and CFD provider and any such postings, excessive or unjust comments and attacks will not be allowed and will be removed from the site immediately.

Day Image
29th May 2026 | view in browser
Markets price peace but hedge the headline risk

Markets remain broadly risk-positive on softer U.S. inflation and AI-led equity strength, but investors are staying cautious as unresolved U.S.-Iran negotiations, BOJ policy uncertainty, and geopolitical tensions continue to shape FX, commodities, and broader macro price action.


Performance chart 30day v. USD (%)
Performance Chart
 
 
Technical & fundamental highlights
EURUSD: technical overview

The Euro outlook remains constructive with higher lows sought out on dips in favor of the next major upside extension targeting the 2021 high at 1.2350. Setbacks should be exceptionally well supported ahead of 1.1300.

EURUSD Chart
R2 1.1797 - 6 May high - Medium
R1 1.1722 - 14 May high - Medium
S1 1.1576 - 21 May low - Medium
S2 1.1504 - 3 April low - Strong
EURUSD: fundamental overview

The euro remains well supported on a combination of improving risk sentiment, relative growth resilience, and a less negative rates outlook. Most recently, reports of progress toward a US-Iran agreement and an extension of the ceasefire have helped underpin broader risk appetite, encouraging demand for pro-cyclical currencies including the euro. At the same time, softer-than-expected monthly US core PCE inflation and signs of moderating US growth have reinforced expectations that the Federal Reserve will be able to adopt a less restrictive policy stance going forward, weighing on the US dollar. On the euro side, investors continue to draw support from expectations that the ECB is nearing the end of its easing cycle, while Germany’s fiscal expansion plans and increased European defense and infrastructure spending are seen as constructive for the medium-term growth outlook. The result has been a continuation of the favorable EURUSD dynamic, with dips attracting demand amid a still-broad trend of dollar weakness.

 
USDJPY: technical overview

There are signs of the formation of a meaningful top after the market put in a multi-year high in 2024. At this point, rallies should be well capped above 160.00 in favor of a fresh down-leg back towards the 2024 low at 139.58. Only a monthly close above 160.00 negates.

USDJPY Chart
R2 160.00 - Psychological - Strong
R1 159.66 - 28 May high - Medium
S1 158.59 - 20 May low - Medium
S2 157.29 - 14 May low - Medium
USDJPY: fundamental overview

Japan fundamentals remain mixed for the yen. On one hand, BoJ Governor Ueda’s recent remarks reinforced expectations that the central bank remains concerned about inflation becoming embedded through wages and inflation expectations, keeping the prospect of further policy normalization alive. However, the latest Tokyo CPI report complicated that narrative, with headline, core, and core-core inflation all slowing more than expected in May, reducing the urgency for a June rate hike and prompting some investors to push expectations toward a later move despite markets still assigning a relatively high probability of tightening in the months ahead. At the same time, stronger-than-expected April retail sales and industrial production data suggest domestic demand and manufacturing activity remain resilient, helping to offset concerns about the broader economy. The dominant driver of yen weakness continues to be the wide US-Japan rate differential, with US yields remaining elevated relative to JGB yields, while Japan’s dependence on imported energy leaves the economy vulnerable to higher oil prices and a weaker currency. Against this backdrop, intervention risks have become an increasingly important support factor, with USDJPY once again approaching the psychologically important ¥160 level. Market participants are awaiting official Ministry of Finance intervention data, with estimates suggesting authorities may have spent as much as ¥10 trillion defending the currency in late April and early May. While intervention fears may slow the pace of depreciation, investors generally view direct FX operations as a temporary tool rather than a lasting solution unless accompanied by a meaningful narrowing in US-Japan yield differentials through further BoJ tightening.

 
AUDUSD: technical overview

There are signs of the formation of a longer-term base with the market recovering out from a meaningful longer-term support zone. The latest monthly close back above 0.7000 takes the big picture pressure off the downside and strengthens the case for a bottom, with the focus now on a push towards 0.8000. Setbacks should now be well supported ahead of 0.6700.

AUDUSD Chart
R2 0.7278 - 6 May/2026 high - Strong
R1 0.7222 - 17 April high - Medium
S1 0.7079 - 19 May low - Medium
S2 0.6963 - 8 April low - Strong
AUDUSD: fundamental overview

The Australian dollar has been trading with a mixed fundamental backdrop, caught between shifting global risk sentiment and a material repricing of RBA expectations. Recent Australian inflation data surprised to the downside, with both monthly and annual CPI readings cooling faster than anticipated, prompting markets to sharply scale back expectations for additional RBA tightening. Following the data, the probability of a near-term rate hike was largely priced out, while expectations for further policy tightening later in the year were significantly reduced, undermining a key source of support for the currency. At the same time, escalating geopolitical tensions in the Middle East have weighed on broader risk appetite, typically a headwind for the risk-sensitive Australian dollar. However, intermittent bouts of US dollar weakness, driven by hopes of de-escalation in the region and evolving expectations around the US policy outlook, have helped cushion downside pressure. As a result, AUDUSD remains range-bound, with softer domestic inflation and a less hawkish RBA offsetting support from periods of improved global sentiment and US dollar consolidation.

 
Suggested reading

AI Can’t Pick Winning Funds. But It Can Avoid Bad Ones, L. Swedroe, Morningstar (May 28, 2026)

China’s Long March to Technological Supremacy, J. Rockstrom, Project Syndicate (May 27, 2026)


Any opinions, news, research, analyses, prices or other information ("information") contained on this Blog, constitutes marketing communication and it has not been prepared in accordance with legal requirements designed to promote the independence of investment research. Further, the information contained within this Blog does not contain (and should not be construed as containing) investment advice or an investment recommendation, or an offer of, or solicitation for, a transaction in any financial instrument. LMAX Group has not verified the accuracy or basis-in-fact of any claim or statement made by any third parties as comments for every Blog entry.

LMAX Group will not accept liability for any loss or damage, including without limitation to, any loss of profit, which may arise directly or indirectly from use of or reliance on such information. No representation or warranty is given as to the accuracy or completeness of the above information. While the produced information was obtained from sources deemed to be reliable, LMAX Group does not provide any guarantees about the reliability of such sources. Consequently any person acting on it does so entirely at his or her own risk. It is not a place to slander, use unacceptable language or to promote LMAX Group or any other FX and CFD provider and any such postings, excessive or unjust comments and attacks will not be allowed and will be removed from the site immediately.

Day Image
28th May 2026 | view in browser
Dollar up, gold down, nerves fraying

Markets remain dominated by the inflationary fallout from escalating US-Iran tensions, with higher oil prices and hawkish central bank rhetoric driving dollar strength, pressuring equities and gold, and reinforcing the higher-for-longer global rates narrative.


Performance chart 30day v. USD (%)
Performance Chart
 
 
Technical & fundamental highlights
EURUSD: technical overview

The Euro outlook remains constructive with higher lows sought out on dips in favor of the next major upside extension targeting the 2021 high at 1.2350. Setbacks should be exceptionally well supported ahead of 1.1300.

EURUSD Chart
R2 1.1797 - 6 May high - Medium
R1 1.1722 - 14 May high - Medium
S1 1.1576 - 21 May low - Medium
S2 1.1504 - 3 April low - Strong
EURUSD: fundamental overview

The Euro has come under renewed pressure amid a broader flight to safety after Iran retaliated against recent US strikes, with reports of attacks on US military bases and explosions near Bandar Abbas fueling concerns of a wider regional conflict and supporting demand for the US Dollar. The deterioration in risk sentiment has overshadowed what had otherwise been a constructive backdrop for the single currency, including improving Eurozone growth expectations and optimism around increased fiscal spending in Germany. At the same time, markets remain cautious ahead of key US PCE inflation data and Germany’s preliminary May HICP release, both of which could shape expectations for the Fed and ECB policy outlooks. ECB officials have continued to signal confidence that inflation is moving sustainably back toward target, reinforcing expectations the central bank is nearing the end of its easing cycle, though geopolitical tensions and softer global risk appetite are limiting Euro upside for now.

 
USDJPY: technical overview

There are signs of the formation of a meaningful top after the market put in a multi-year high in 2024. At this point, rallies should be well capped above 160.00 in favor of a fresh down-leg back towards the 2024 low at 139.58. Only a monthly close above 160.00 negates.

USDJPY Chart
R2 160.00 - Psychological - Strong
R1 159.66 - 28 May high - Medium
S1 158.59 - 20 May low - Medium
S2 157.29 - 14 May low - Medium
USDJPY: fundamental overview

The Yen has remained caught between increasingly hawkish Bank of Japan expectations and still-powerful external headwinds. BoJ Governor Kazuo Ueda’s latest comments reinforced the view that policymakers are becoming more concerned that higher energy prices could feed into wages, inflation expectations, and broader price-setting behavior, keeping alive expectations for additional policy normalization in the months ahead. Recent inflation readings have continued to hold above the BoJ’s 2% target, while steady wage growth has strengthened the case for further rate hikes. However, Yen gains have been limited by Japan’s vulnerability to elevated oil prices, rising concerns about the domestic growth outlook, and persistently wide yield differentials with the United States, where Treasury yields remain comparatively attractive. On the external side, the Dollar has continued to draw support from resilient US economic data and a more hawkish repricing of Federal Reserve expectations, with markets scaling back the scope for easing amid sticky inflation and firm labor market conditions. Investors are now closely focused on upcoming Tokyo CPI data and US PCE inflation figures for further confirmation on the policy outlook for both the BoJ and the Fed, while rising geopolitical tensions and higher crude prices are also contributing to volatility.

 
AUDUSD: technical overview

There are signs of the formation of a longer-term base with the market recovering out from a meaningful longer-term support zone. The latest monthly close back above 0.7000 takes the big picture pressure off the downside and strengthens the case for a bottom, with the focus now on a push towards 0.8000. Setbacks should now be well supported ahead of 0.6700.

AUDUSD Chart
R2 0.7278 - 6 May/2026 high - Strong
R1 0.7222 - 17 April high - Medium
S1 0.7079 - 19 May low - Medium
S2 0.6963 - 8 April low - Strong
AUDUSD: fundamental overview

The Australian dollar has come under renewed pressure as softer domestic data has prompted markets to scale back expectations for additional RBA tightening, particularly following weaker labor market readings and a moderation in headline inflation. While underlying price pressures remain sticky, investors increasingly believe the RBA may be nearing the end of its hiking cycle as slowing growth and easing demand begin to weigh on the economy. At the same time, heightened geopolitical tensions in the Middle East and the resulting surge in energy prices have fueled broader risk aversion and supported the US dollar and Japanese yen at the expense of higher-beta currencies like the Aussie. Concerns over slower Chinese growth – a key driver for Australia’s commodity-linked economy – have also limited AUD upside, despite some support from resilient metals demand and relatively elevated Australian yields. Meanwhile, hawkish Bank of Japan rhetoric and lingering fears of Japanese FX intervention have added further downside pressure.

 
Suggested reading

Why Double Digit Earnings Growth Won’t Stop the Bear, M. Hulbert, Marketwatch (May 27, 2026)

If Expectations Aren’t Met, It’s Long Way Down, J. Calhoun, Alhambra (May 25, 2026)


Any opinions, news, research, analyses, prices or other information ("information") contained on this Blog, constitutes marketing communication and it has not been prepared in accordance with legal requirements designed to promote the independence of investment research. Further, the information contained within this Blog does not contain (and should not be construed as containing) investment advice or an investment recommendation, or an offer of, or solicitation for, a transaction in any financial instrument. LMAX Group has not verified the accuracy or basis-in-fact of any claim or statement made by any third parties as comments for every Blog entry.

LMAX Group will not accept liability for any loss or damage, including without limitation to, any loss of profit, which may arise directly or indirectly from use of or reliance on such information. No representation or warranty is given as to the accuracy or completeness of the above information. While the produced information was obtained from sources deemed to be reliable, LMAX Group does not provide any guarantees about the reliability of such sources. Consequently any person acting on it does so entirely at his or her own risk. It is not a place to slander, use unacceptable language or to promote LMAX Group or any other FX and CFD provider and any such postings, excessive or unjust comments and attacks will not be allowed and will be removed from the site immediately.