Day Image
17th April 2026 | view in browser
Ceasefire optimism offsetting escalation fears

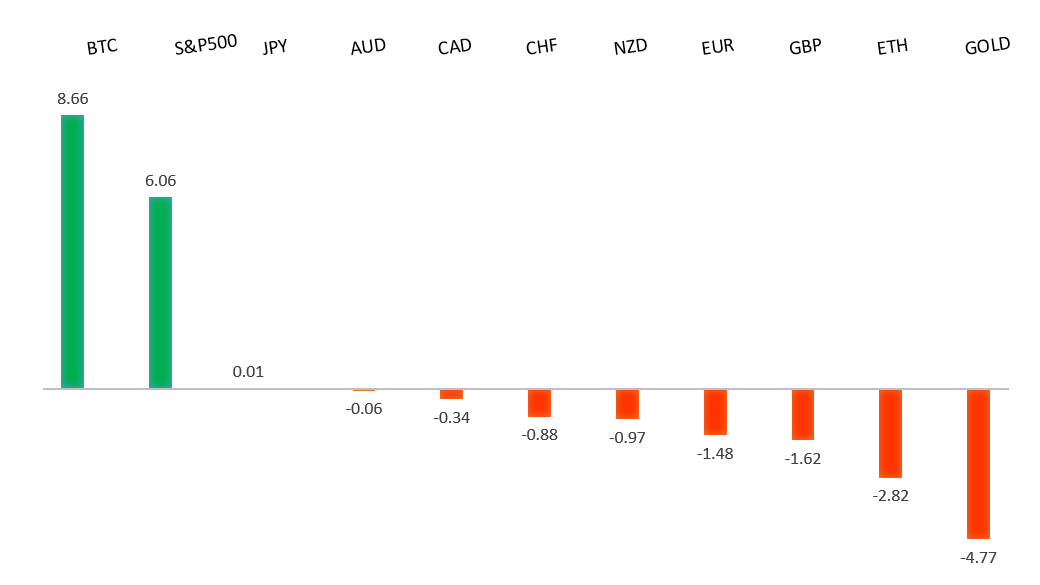
Global markets are navigating fragile optimism heading into Friday, supported by President Trump’s bullish tone on an imminent end to the Iran conflict and ceasefire progress, yet tempered by unverified escalation risks, diverging central bank signals, and cautious risk trimming into the weekend.


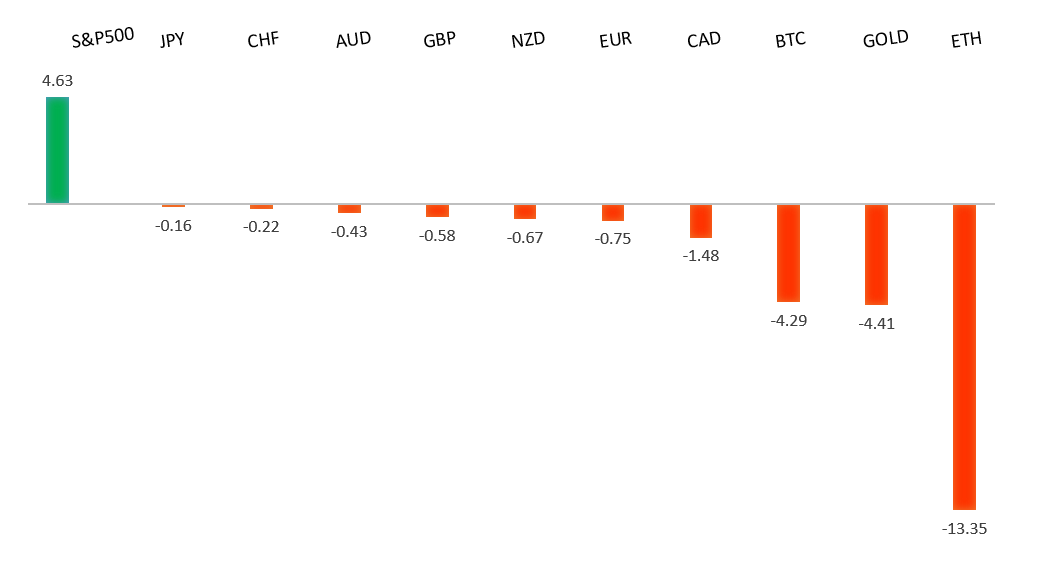
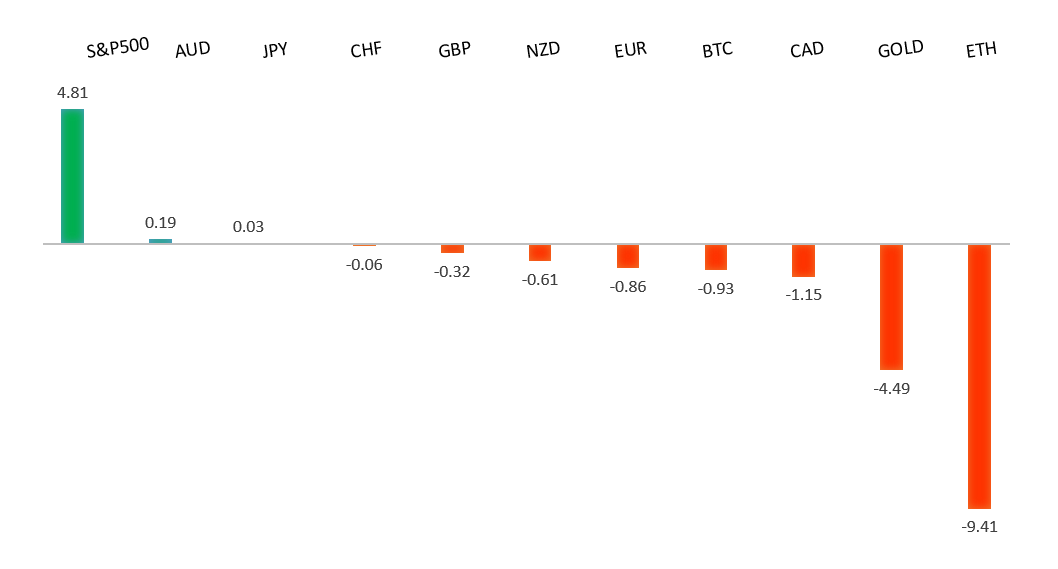
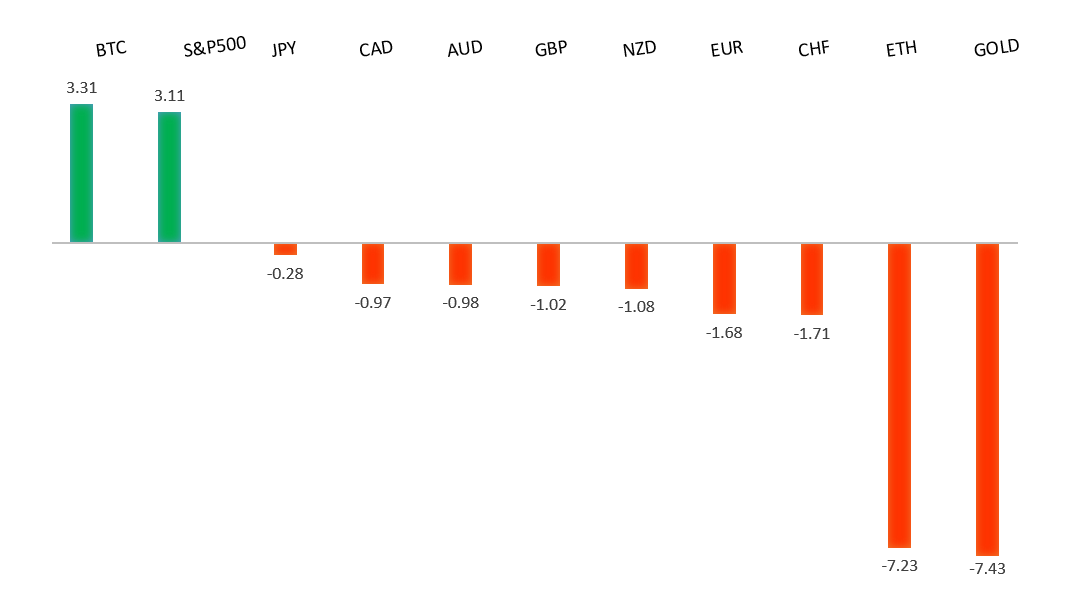
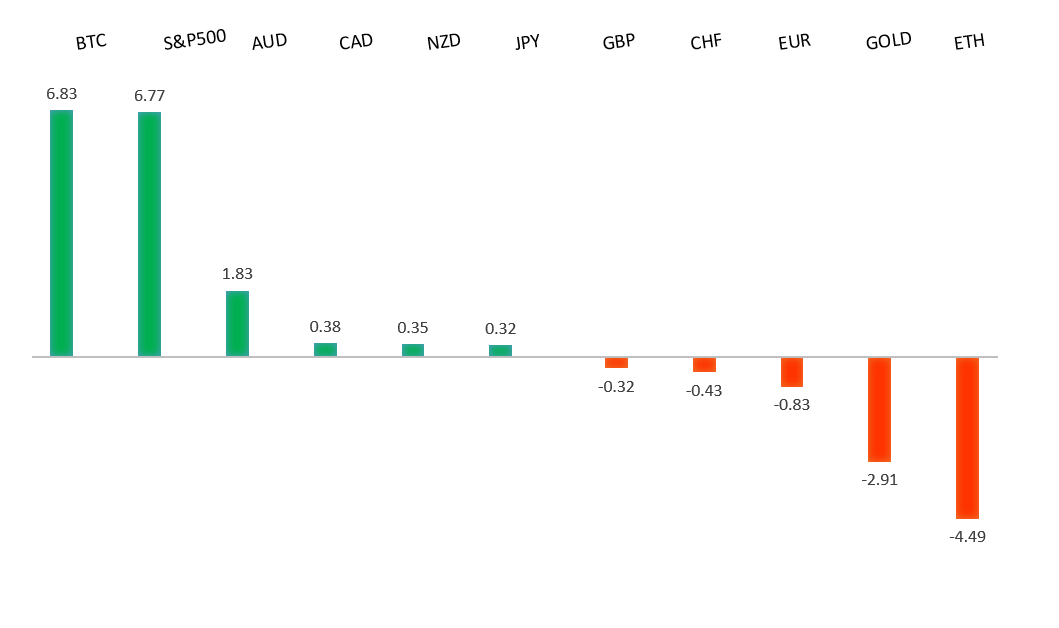
Performance chart 30day v. USD (%)
Performance Chart
 
 
Technical & fundamental highlights
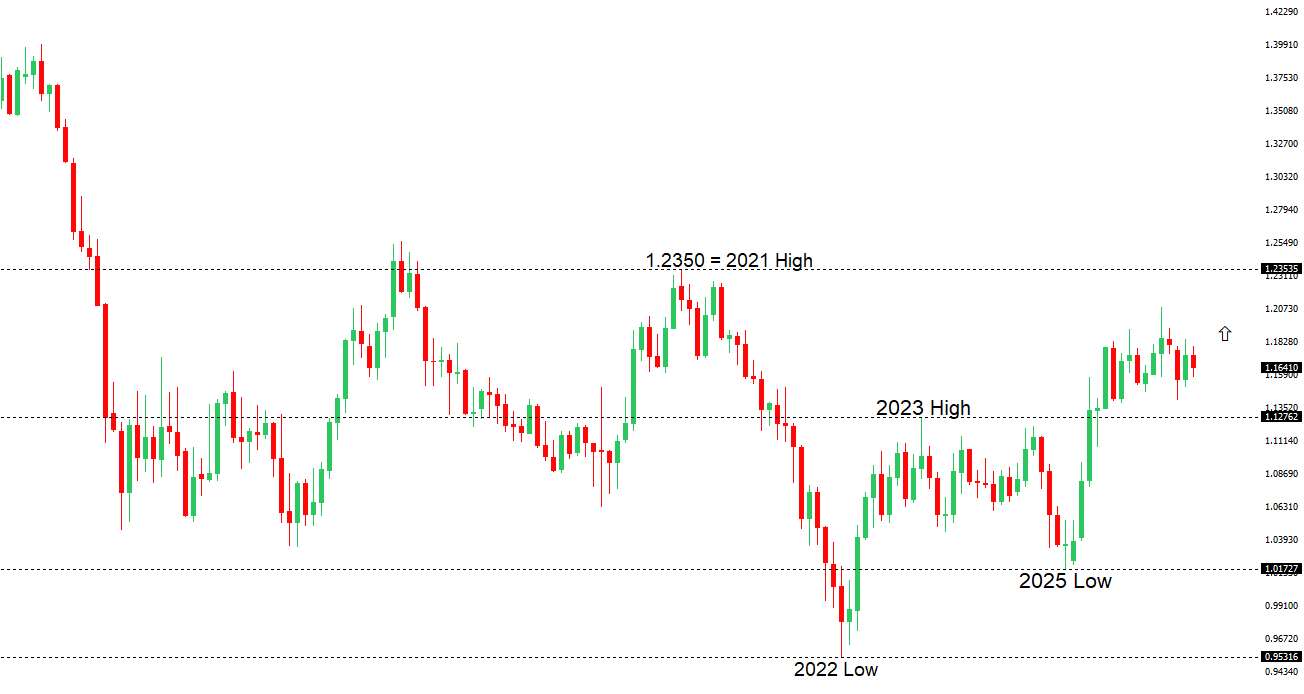
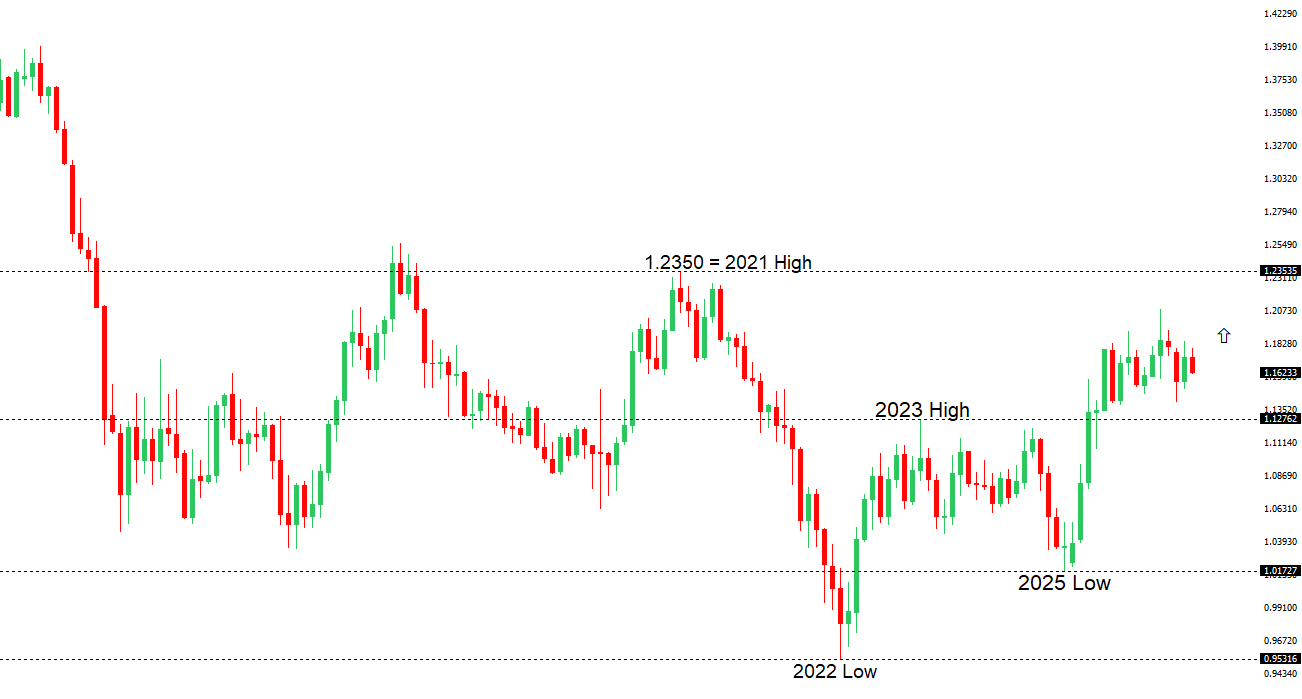
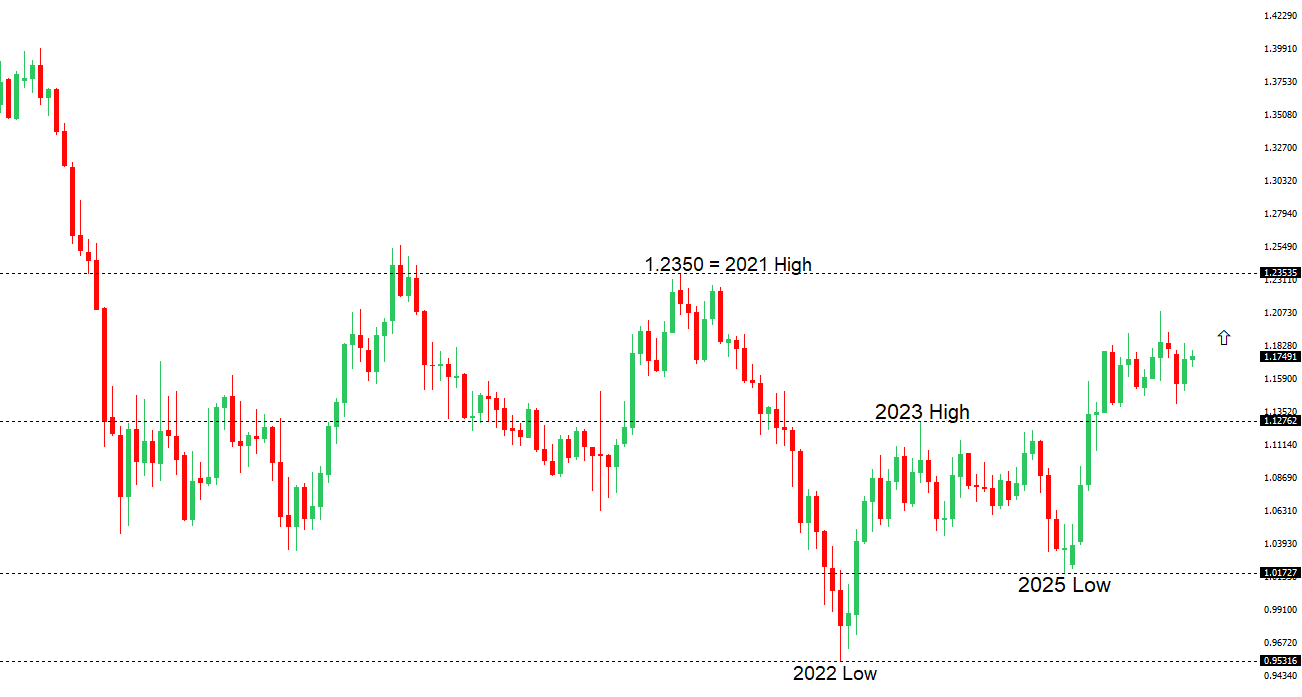
EURUSD: technical overview

The Euro outlook remains constructive with higher lows sought out on dips in favor of the next major upside extension targeting the 2021 high at 1.2350. Setbacks should be exceptionally well supported ahead of 1.1300.

EURUSD Chart
R2 1.1835 - 23 February high - Medium
R1 1.1824 - 16 April high - Medium
S1 1.1754 - 14 April low - Medium
S2 1.1650 - 9 April low - Strong
EURUSD: fundamental overview

The euro has been supported against the US dollar by easing geopolitical tensions in the Middle East, as optimism around resumed US-Iran ceasefire negotiations in the coming days and a fragile truce have reduced safe-haven demand for the greenback, even amid the ongoing US blockade of Iranian ports in the Strait of Hormuz and related Chinese criticism. This risk-on sentiment has helped lift the euro toward levels not seen since February. On the data side, softer-than-expected US Producer Price Index figures—showing annual headline inflation – have reinforced a bearish bias for the dollar by tempering expectations for aggressive Federal Reserve tightening. In the eurozone, the European Central Bank is maintaining a data-dependent stance ahead of its April meeting, with policymakers leaning toward holding rates unchanged while markets price in roughly two quarter-point hikes later this year; President Christine Lagarde has emphasized agility without any bias toward immediate tightening, even as elevated energy costs from regional instability continue to cloud the euro area’s growth and inflation outlook. Strong US private-sector job creation via the ADP report has offered some counter-support to the dollar, but overall fundamentals have favored modest euro resilience.

 
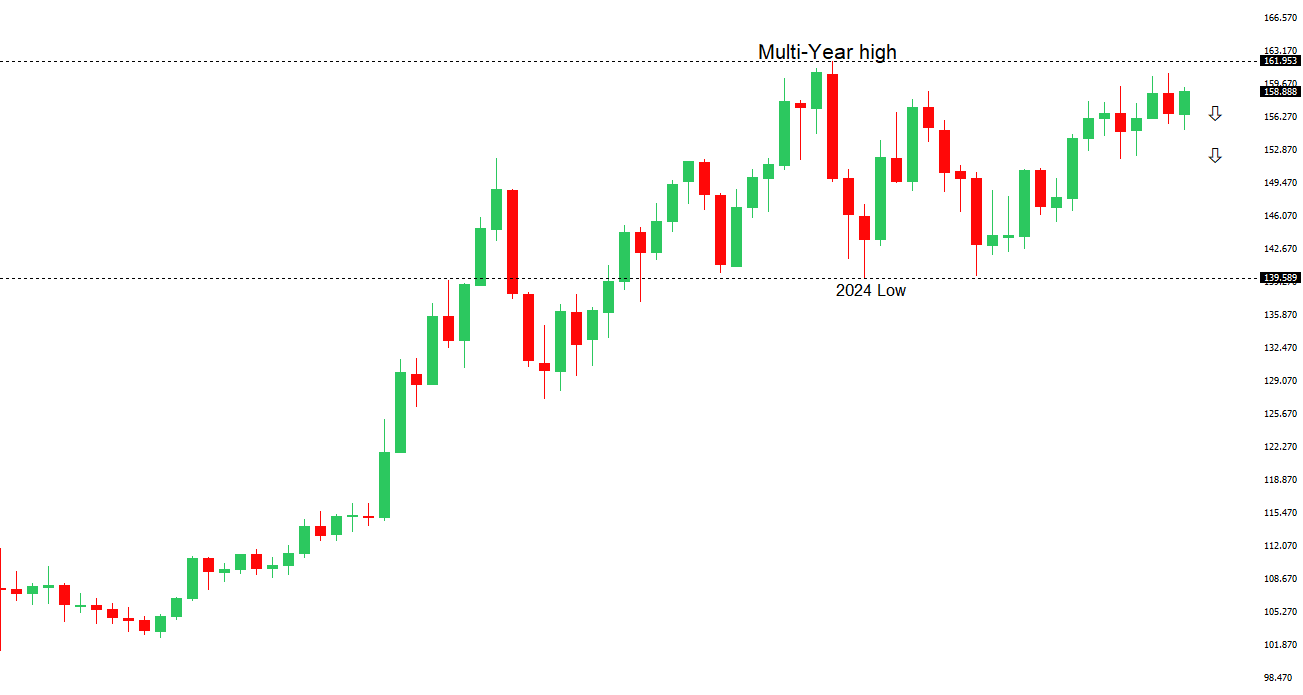
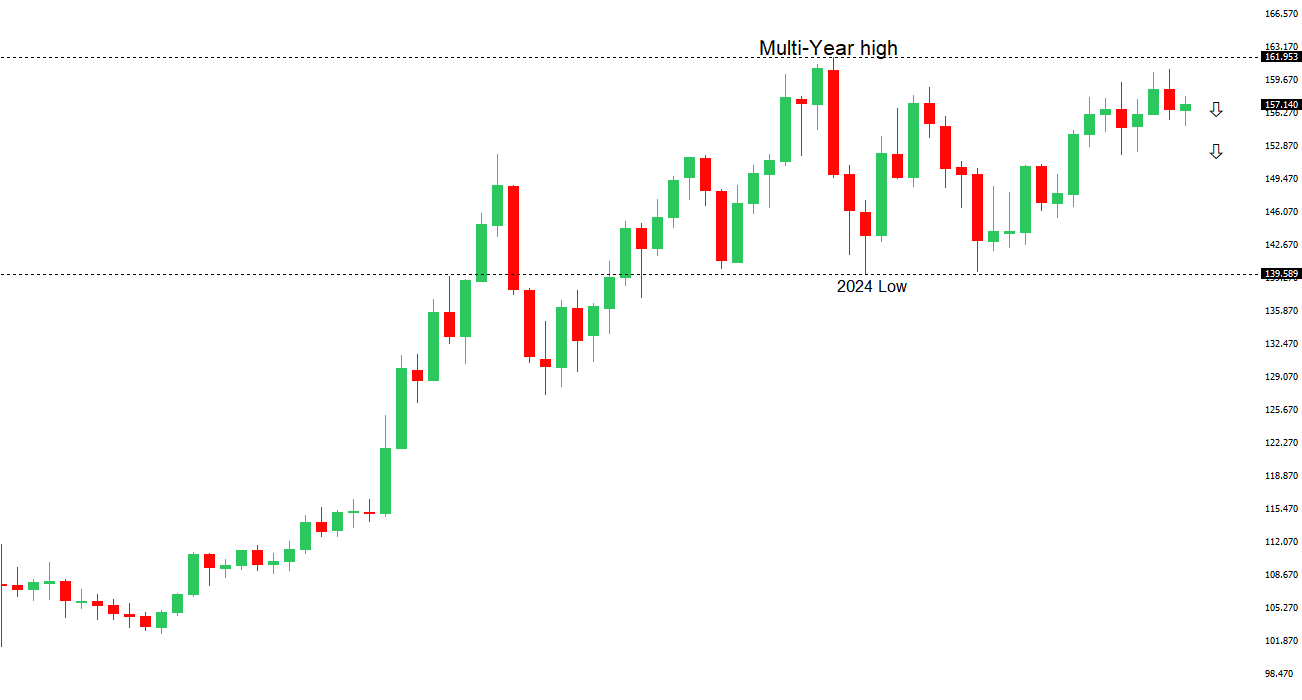
USDJPY: technical overview

There are signs of the formation of a meaningful top after the market put in a multi-year high in 2024. At this point, rallies should be well capped above 160.00 in favor of a fresh down-leg back towards the 2024 low at 139.58. Only a monthly close above 160.00 negates.

USDJPY Chart
R2 160.46 - 30 March/2026 high - Strong
R1 160.03 - 7 April high - Medium
S1 157.89 - 8 April low - Medium
S2 157.51 - 19 March low - Strong
USDJPY: fundamental overview

The Japanese yen has faced downward pressure against the US dollar, with USDJPY trading near 159.50, as declining expectations for a Bank of Japan rate hike at the April 28 policy meeting have undermined the currency amid ongoing uncertainty from Middle East tensions. BoJ officials, including Governor Ueda, have signaled a cautious, data-dependent approach, cooling bets on near-term tightening despite earlier hawkish hints, while Japan’s heavy reliance on imported oil leaves the economy vulnerable to any escalation around the Strait of Hormuz. Finance Minister Katayama’s comments on discussions with US Treasury Secretary Scott Bessent regarding foreign exchange have revived fears of potential intervention, providing some support to the yen and capping the pair’s upside from recent lows. At the same time, optimism over a fragile US-Iran ceasefire, the Israel-Lebanon truce, and receding hawkish Fed expectations have weighed on safe-haven dollar demand, though lingering geopolitical risks and concerns over Japan’s energy costs have prevented sharper yen appreciation.

 
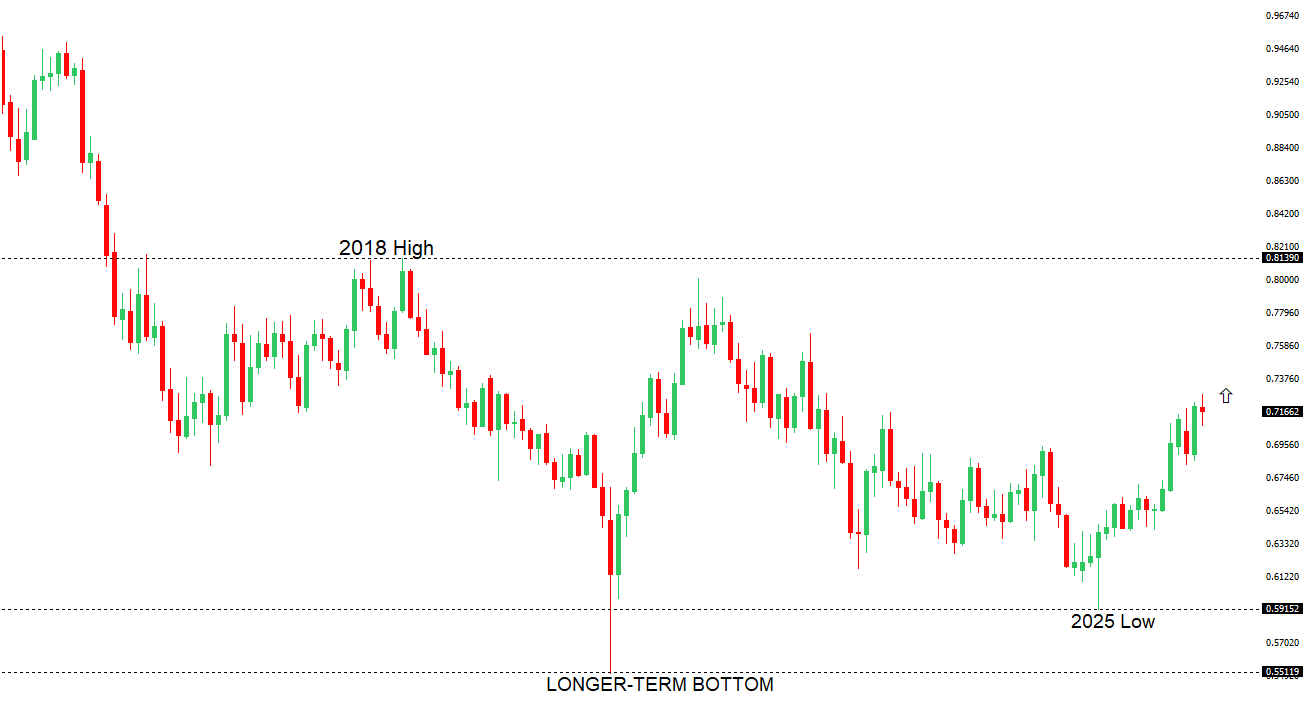
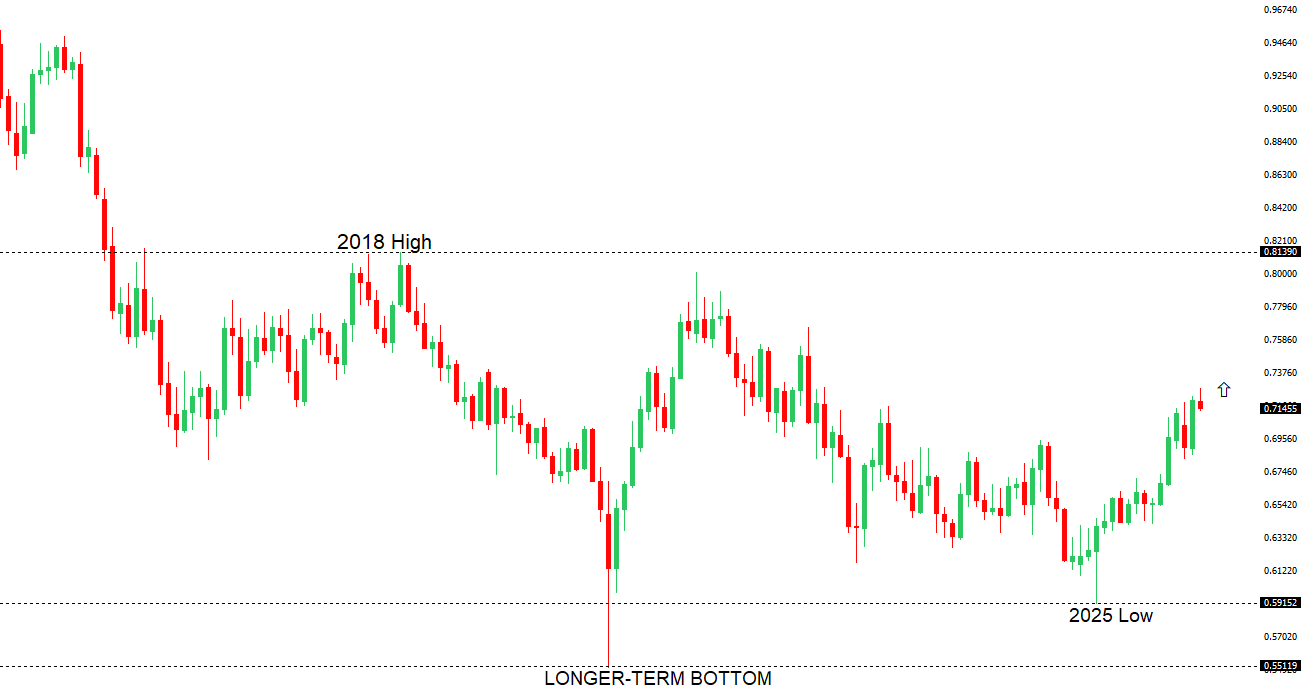
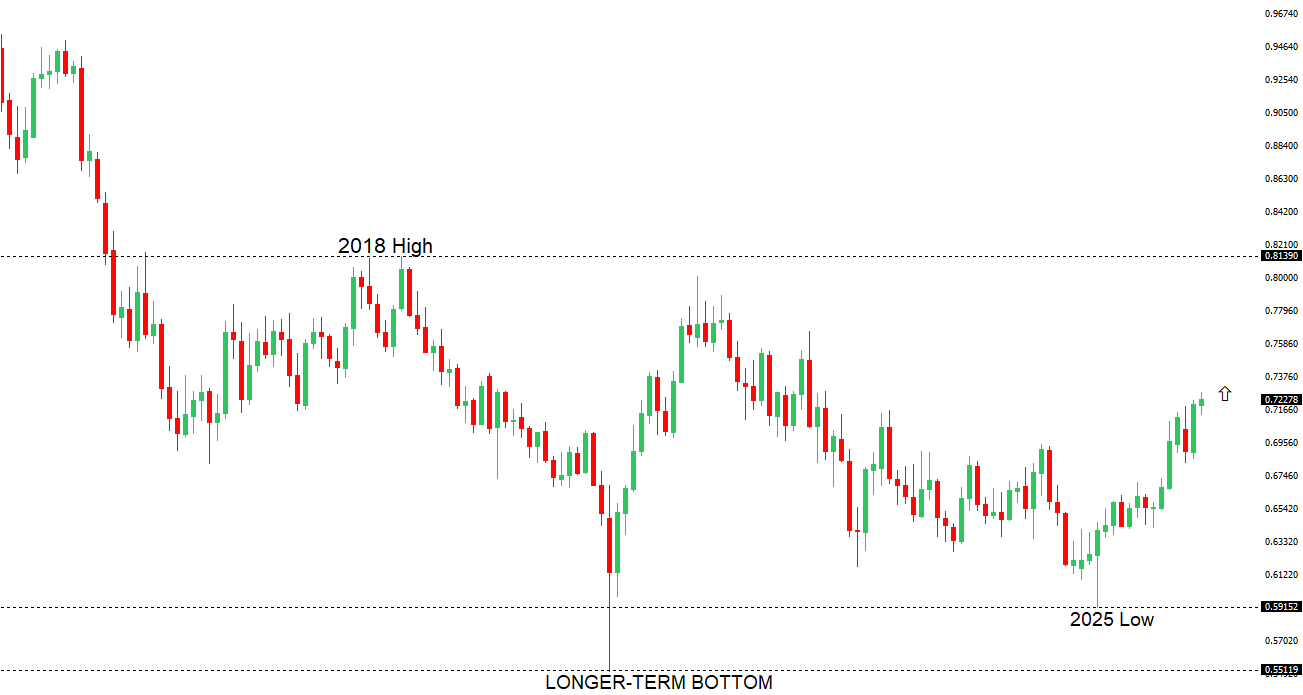
AUDUSD: technical overview

There are signs of the formation of a longer-term base with the market recovering out from a meaningful longer-term support zone. The latest monthly close back above 0.7000 takes the big picture pressure off the downside and strengthens the case for a bottom, with the focus now on a push towards 0.8000. Setbacks should now be well supported ahead of 0.6700.

AUDUSD Chart
R2 0.7284 - 3 June high/2022 - Strong
R1 0.7198 - 16 April/2026 high - Medium
S1 0.7077 - 14 April low - Medium
S2 0.6963 - 8 April low - Strong
AUDUSD: fundamental overview

The Australian dollar has strengthened against the US dollar, recently pushing AUDUSD above 0.7100 and toward year-to-date highs near 0.7200, supported by improving risk sentiment from optimism around US-Iran ceasefire negotiations and the Israel-Lebanon truce, which have reduced safe-haven demand for the greenback amid a fragile Middle East truce. Domestically, the Reserve Bank of Australia maintains a hawkish tilt despite a narrow 5-4 vote on its latest 25 basis point hike to 4.10%, with officials emphasizing sticky inflation—headline CPI at 3.7% year-on-year, trimmed mean at 3.3%—and capacity constraints that could keep rates higher for longer, even as markets price in further tightening later this year while remaining data-dependent on global developments. Resilient Australian fundamentals, including a widening trade surplus, firm GDP growth, and a still-solid labor market with unemployment steady near 4.3%, have reinforced the currency’s appeal as a commodity-linked play. China’s economy, acting as a stabilizer rather than a strong growth engine with Q4 expansion at 4.5-5.0% and mixed retail sales, continues to provide moderate support for Australian exports, though softening external demand and producer price deflation temper the upside. Lingering geopolitical risks around the Strait of Hormuz and elevated energy prices add caution by sustaining some imported inflation pressures for the Aussie economy.

 
Suggested reading

The True Cost Of Oil And Gas, J. Klement Klement on Investing (April 13, 2026)

What History Teaches Us About Market Volatility, L. Swedroe, Larry’s Substack (April 15, 2026)


Any opinions, news, research, analyses, prices or other information ("information") contained on this Blog, constitutes marketing communication and it has not been prepared in accordance with legal requirements designed to promote the independence of investment research. Further, the information contained within this Blog does not contain (and should not be construed as containing) investment advice or an investment recommendation, or an offer of, or solicitation for, a transaction in any financial instrument. LMAX Group has not verified the accuracy or basis-in-fact of any claim or statement made by any third parties as comments for every Blog entry.

LMAX Group will not accept liability for any loss or damage, including without limitation to, any loss of profit, which may arise directly or indirectly from use of or reliance on such information. No representation or warranty is given as to the accuracy or completeness of the above information. While the produced information was obtained from sources deemed to be reliable, LMAX Group does not provide any guarantees about the reliability of such sources. Consequently any person acting on it does so entirely at his or her own risk. It is not a place to slander, use unacceptable language or to promote LMAX Group or any other FX and CFD provider and any such postings, excessive or unjust comments and attacks will not be allowed and will be removed from the site immediately.

Day Image
16th April 2026 | view in browser
Risk on as geopolitics cool

Markets are pushing further into risk-on territory with equities at record highs on easing geopolitical tensions and resilient global data, even as underlying inflation and conflict risks keep central banks firmly in wait-and-see mode.


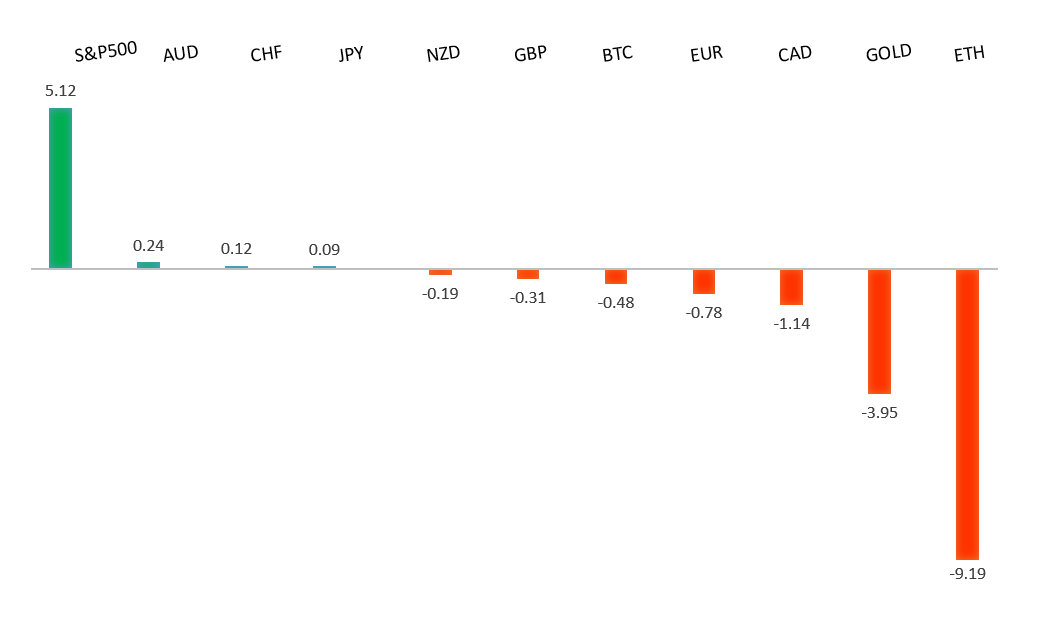
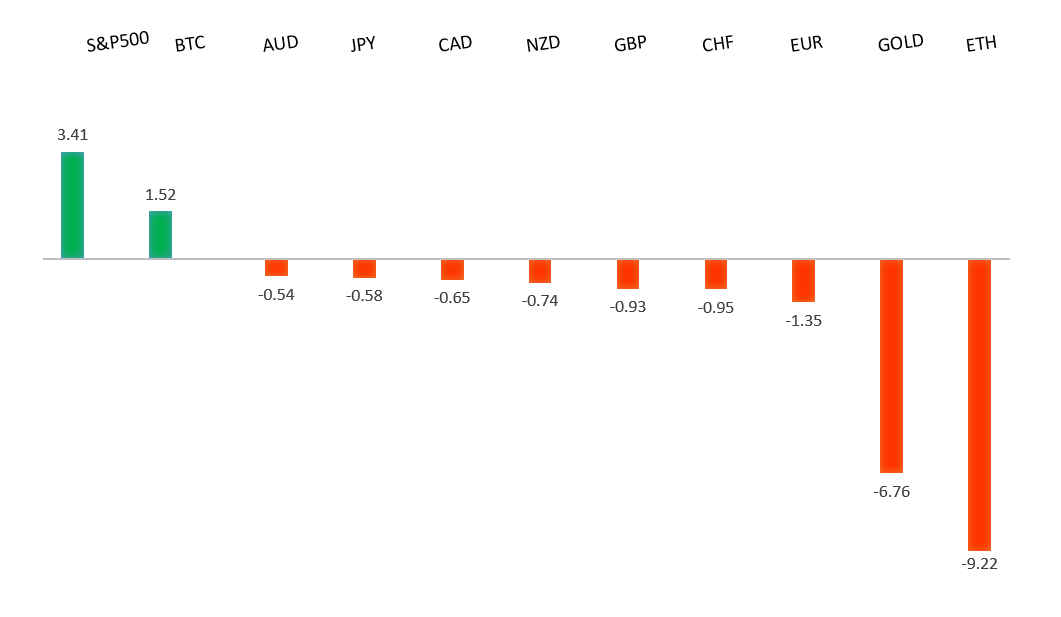
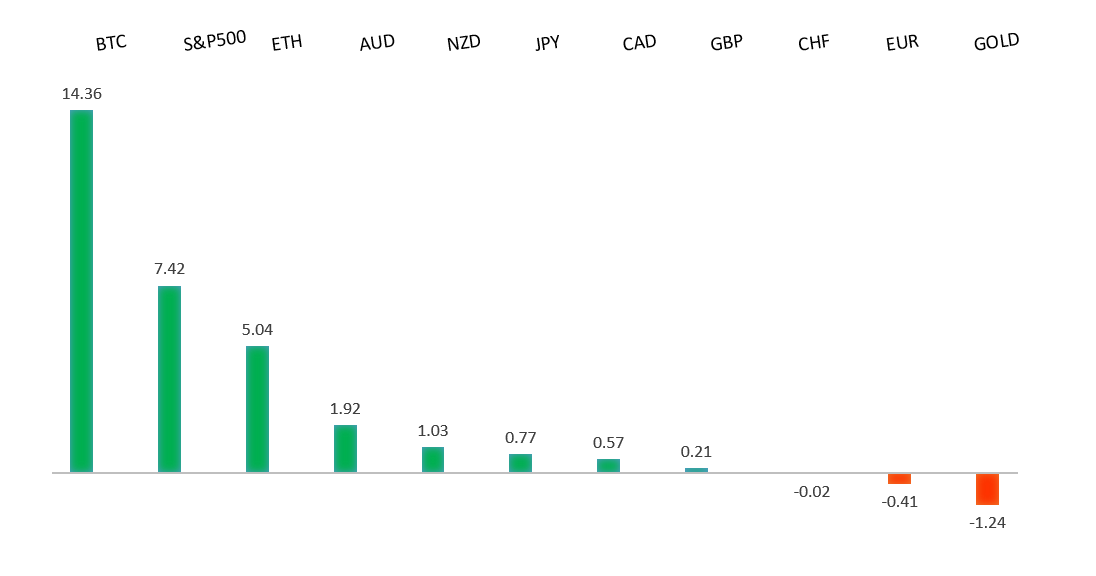
Performance chart 30day v. USD (%)
Performance Chart
 
 
Technical & fundamental highlights
EURUSD: technical overview

The Euro outlook remains constructive with higher lows sought out on dips in favor of the next major upside extension targeting the 2021 high at 1.2350. Setbacks should be exceptionally well supported ahead of 1.1300.

EURUSD Chart
R2 1.1835 - 23 February high - Medium
R1 1.1824 - 16 April high - Medium
S1 1.1754 - 14 April low - Medium
S2 1.1650 - 9 April low - Strong
EURUSD: fundamental overview

The euro has been supported by a combination of external dollar weakness and a relatively steady eurozone backdrop, pushing EURUSD through 1.1800. On the geopolitical front, improved risk sentiment—driven by expectations of further US-Iran negotiations and hopes of avoiding near-term escalation—has reduced safe-haven demand for the dollar, indirectly lifting the euro. This has been reinforced by softer-than-expected US producer price data, which came in well below consensus and tempered Fed tightening expectations, weighing on the USD despite still-solid labor market readings and persistent energy-driven inflation pressures. On the European side, the absence of major negative surprises, alongside steady inflation dynamics around 2.5% and a broadly patient/neutral stance from the ECB, has helped the euro hold firm. Markets appear comfortable that policymakers can remain data-dependent while assessing external shocks, allowing EUR strength to be driven primarily by the shift in relative macro expectations versus the US.

 
USDJPY: technical overview

There are signs of the formation of a meaningful top after the market put in a multi-year high in 2024. At this point, rallies should be well capped above 160.00 in favor of a fresh down-leg back towards the 2024 low at 139.58. Only a monthly close above 160.00 negates.

USDJPY Chart
R2 160.46 - 30 March/2026 high - Strong
R1 160.03 - 7 April high - Medium
S1 157.89 - 8 April low - Medium
S2 157.51 - 19 March low - Strong
USDJPY: fundamental overview

The yen has shown tentative resilience, with USDJPY easing back toward the lower end of its recent range amid a softer US dollar and persistent intervention jitters from Tokyo. Improved geopolitical sentiment—fueled by hopes for progress in US-Iran diplomacy and potential de-escalation steps, including rare Israel-Lebanon talks—has reduced safe-haven demand for the dollar, while a partial retreat in oil prices from recent highs has further tempered expectations for aggressive Fed tightening. At the same time, renewed verbal warnings from Finance Minister Katayama regarding excessive volatility and speculative moves have reinforced market expectations of potential intervention, providing intermittent support to the yen. However, any meaningful or sustained JPY appreciation remains capped by Japan’s acute vulnerability to energy supply disruptions around the Strait of Hormuz, where ongoing restrictions continue to weigh on import costs, the trade balance, and the broader economy despite efforts to tap reserves and diversify routes.

 
AUDUSD: technical overview

There are signs of the formation of a longer-term base with the market recovering out from a meaningful longer-term support zone. The latest monthly close back above 0.7000 takes the big picture pressure off the downside and strengthens the case for a bottom, with the focus now on a push towards 0.8000. Setbacks should now be well supported ahead of 0.6700.

AUDUSD Chart
R2 0.7284 - 3 June high/2022 - Strong
R1 0.7198 - 16 April/2026 high - Medium
S1 0.7077 - 14 April low - Medium
S2 0.6963 - 8 April low - Strong
AUDUSD: fundamental overview

The Australian dollar has strengthened notably amid a clear improvement in global risk sentiment, with easing geopolitical tensions and a partial retreat in oil prices from recent highs supporting demand for higher-beta currencies and extending the AUDUSD run to a fresh yearly high. The move has been reinforced by a softer US dollar backdrop, as cooling inflation signals and a more cautious Fed tone have tempered expectations for aggressive further tightening, even as policymakers stay alert to lingering oil-driven inflation risks. On the domestic side, Australia’s labor market continues to display resilience, with unemployment holding steady at 4.3% in the latest March data, reinforcing the view that the Reserve Bank of Australia can maintain a tightening bias and helping anchor rate differentials in the Aussie’s favor.

 
Suggested reading

Market Timing Doesn’t Matter As Much As You Think, B. Carlson, AWOCS (April 14, 2026)

Why World’s Superrich Are Swapping Dubai for Milan, C. Newkey-Burden, The Week (April 10, 2026)


Any opinions, news, research, analyses, prices or other information ("information") contained on this Blog, constitutes marketing communication and it has not been prepared in accordance with legal requirements designed to promote the independence of investment research. Further, the information contained within this Blog does not contain (and should not be construed as containing) investment advice or an investment recommendation, or an offer of, or solicitation for, a transaction in any financial instrument. LMAX Group has not verified the accuracy or basis-in-fact of any claim or statement made by any third parties as comments for every Blog entry.

LMAX Group will not accept liability for any loss or damage, including without limitation to, any loss of profit, which may arise directly or indirectly from use of or reliance on such information. No representation or warranty is given as to the accuracy or completeness of the above information. While the produced information was obtained from sources deemed to be reliable, LMAX Group does not provide any guarantees about the reliability of such sources. Consequently any person acting on it does so entirely at his or her own risk. It is not a place to slander, use unacceptable language or to promote LMAX Group or any other FX and CFD provider and any such postings, excessive or unjust comments and attacks will not be allowed and will be removed from the site immediately.

Day Image
15th April 2026 | view in browser
A delicate balance of optimism and risk

Markets enter the day with a cautiously constructive tone as easing geopolitical tensions weigh on oil and support risk sentiment, while underlying inflation uncertainty and mixed global data keep the outlook balanced.


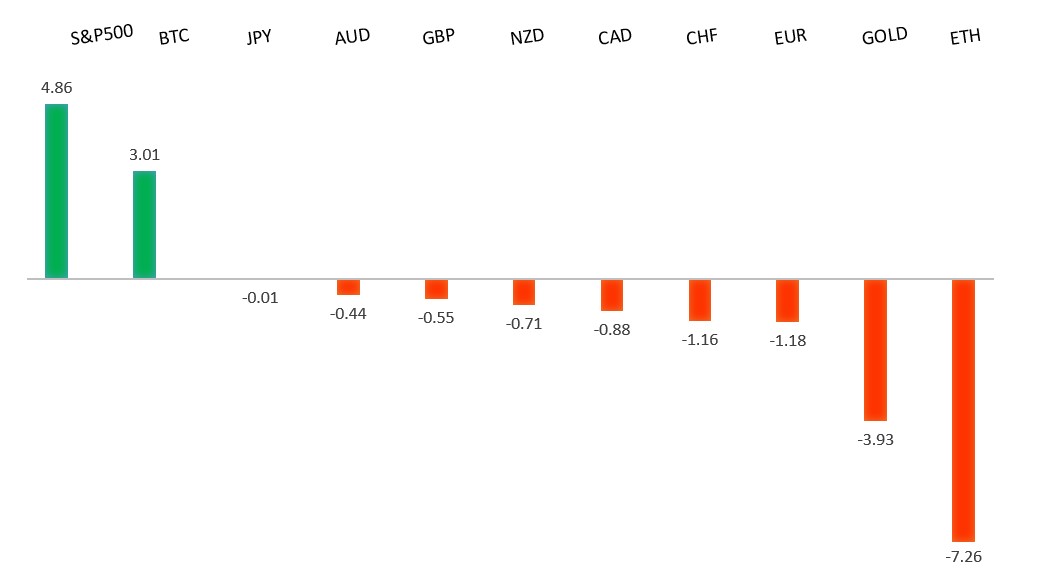
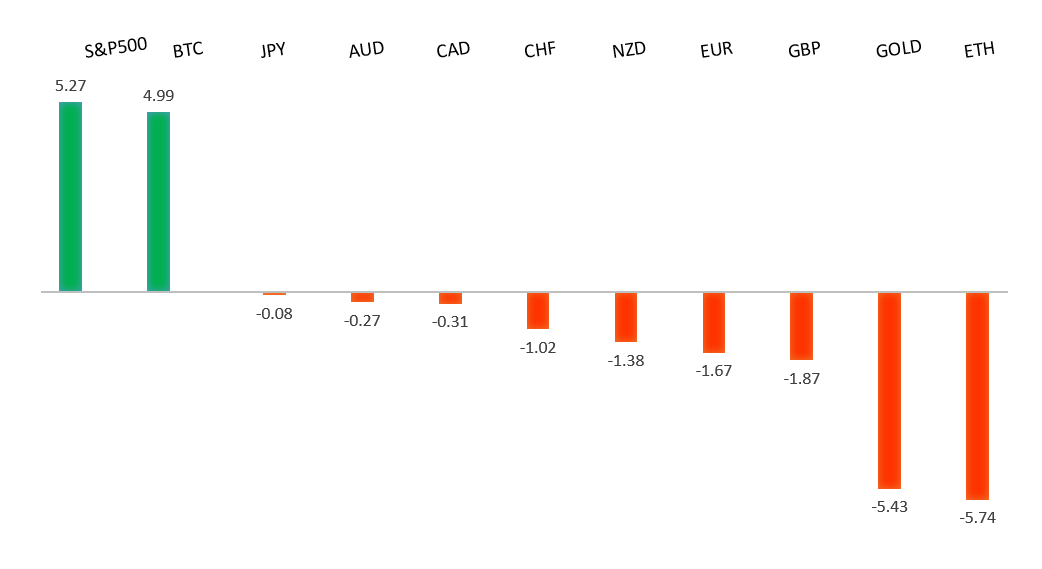
Performance chart 30day v. USD (%)
Performance Chart
 
 
Technical & fundamental highlights
EURUSD: technical overview

The Euro outlook remains constructive with higher lows sought out on dips in favor of the next major upside extension targeting the 2021 high at 1.2350. Setbacks should be exceptionally well supported ahead of 1.1300.

EURUSD Chart
R2 1.1835 - 23 February high - Medium
R1 1.1812 - 14 April high - Medium
S1 1.1650 - 9 April low - Medium
S2 1.1589 - 8 April low - Strong
EURUSD: fundamental overview

The euro has been supported by a combination of broad-based US dollar weakness and shifting expectations around relative central bank policy, with markets increasingly pricing a less hawkish Federal Reserve alongside a more persistent tightening bias from the ECB in response to ongoing inflation pressures, particularly those linked to energy. As geopolitical risks tied to the Iran situation are seen as peaking, the dollar’s safe-haven appeal has diminished, allowing EURUSD to push higher, while the euro has also benefited from the view that Europe may be more responsive in addressing inflation compared to the US. At the same time, evolving energy dynamics and the potential for a changing relationship between oil and the dollar have reinforced the euro’s relative appeal. Looking ahead, Eurozone industrial production data and ECB President Christine Lagarde’s speech will be worth keeping an eye on for further clues around the growth outlook and policy trajectory.

 
USDJPY: technical overview

There are signs of the formation of a meaningful top after the market put in a multi-year high in 2024. At this point, rallies should be well capped above 160.00 in favor of a fresh down-leg back towards the 2024 low at 139.58. Only a monthly close above 160.00 negates.

USDJPY Chart
R2 160.46 - 30 March/2026 high - Strong
R1 160.03 - 7 April high - Medium
S1 157.89 - 8 April low - Medium
S2 157.51 - 19 March low - Strong
USDJPY: fundamental overview

The Bank of Japan’s ultra-accommodative stance, reinforced by Governor Ueda’s cautious tone on normalization and emphasis on the need for sustained wage growth, continues to anchor Japanese yields and preserve the attractiveness of yen-funded carry trades, particularly against a still relatively high US rate environment. At the same time, the yen’s traditional sensitivity to risk aversion has diminished, with markets viewing geopolitical tensions as less likely to escalate into a severe disruption, thereby limiting haven inflows. Stable energy conditions have also helped reduce downside pressure from Japan’s terms of trade, but have not been enough to offset the broader yield differential dynamic, leaving the yen largely driven by external rate expectations and lacking a strong domestic catalyst.

 
AUDUSD: technical overview

There are signs of the formation of a longer-term base with the market recovering out from a meaningful longer-term support zone. The latest monthly close back above 0.7000 takes the big picture pressure off the downside and strengthens the case for a bottom, with the focus now on a push towards 0.8000. Setbacks should now be well supported ahead of 0.6700.

AUDUSD Chart
R2 0.7188 - 11 March/2026 high - Strong
R1 0.7148 - 14 April high - Medium
S1 0.6990 - 13 April low - Medium
S2 0.6833 - 30 March low - Strong
AUDUSD: fundamental overview

The Australian dollar has been driven by a mix of improving global sentiment and a softer US dollar, with easing geopolitical tensions around the Middle East helping to support higher beta currencies and lift AUD toward recent highs. At the same time, the domestic backdrop remains mixed, with inflation still running above target and the RBA maintaining a cautious but relatively hawkish stance, even as signs of slowing momentum emerge across business activity and parts of the labor market. Notably, the currency has been able to shrug off Tuesday’s weak round of Australian confidence data, suggesting external factors are currently dominating. China has also played a role, offering a stabilizing but less dynamic growth impulse as softer trade trends point to weaker external demand.

 
Suggested reading

It’s Hard To Sell When Things Are Great, Buy When Awful, J. Calhoun, Alhambra (April 12, 2026)

We’re All Financial Nihilists Now, A. Schrager, Known Unknowns (April 13, 2026)


Any opinions, news, research, analyses, prices or other information ("information") contained on this Blog, constitutes marketing communication and it has not been prepared in accordance with legal requirements designed to promote the independence of investment research. Further, the information contained within this Blog does not contain (and should not be construed as containing) investment advice or an investment recommendation, or an offer of, or solicitation for, a transaction in any financial instrument. LMAX Group has not verified the accuracy or basis-in-fact of any claim or statement made by any third parties as comments for every Blog entry.

LMAX Group will not accept liability for any loss or damage, including without limitation to, any loss of profit, which may arise directly or indirectly from use of or reliance on such information. No representation or warranty is given as to the accuracy or completeness of the above information. While the produced information was obtained from sources deemed to be reliable, LMAX Group does not provide any guarantees about the reliability of such sources. Consequently any person acting on it does so entirely at his or her own risk. It is not a place to slander, use unacceptable language or to promote LMAX Group or any other FX and CFD provider and any such postings, excessive or unjust comments and attacks will not be allowed and will be removed from the site immediately.

Day Image
14th April 2026 | view in browser
Diplomacy hopes lift mood, oil slips

Markets enter the day on a cautiously constructive footing as easing geopolitical tensions weigh on oil and the dollar, though sentiment remains tempered by hawkish central bank signals and mixed global data.


Performance chart 30day v. USD (%)
Performance Chart
 
 
Technical & fundamental highlights
EURUSD: technical overview

The Euro outlook remains constructive with higher lows sought out on dips in favor of the next major upside extension targeting the 2021 high at 1.2350. Setbacks should be exceptionally well supported ahead of 1.1300.

EURUSD Chart
R2 1.1835 - 23 February high - Medium
R1 1.1796 - 2 March high - Medium
S1 1.1650 - 9 April low - Medium
S2 1.1589 - 8 April low - Strong
EURUSD: fundamental overview

The euro has been supported primarily by broad US dollar weakness, extending its gains as markets continue to reassess the Fed outlook amid easing geopolitical tensions and softer oil prices, which have helped stabilize global risk sentiment. While the Eurozone macro backdrop remains fragile, with growth still subdued and the economy sensitive to external shocks, the currency has found relative strength as investors look past near-term softness and focus on a less aggressive policy divergence with the Fed. At the same time, ongoing ECB communication has leaned cautious but steady, reinforcing a data-dependent stance rather than signaling imminent easing, which has helped underpin the euro.

 
USDJPY: technical overview

There are signs of the formation of a meaningful top after the market put in a multi-year high in 2024. At this point, rallies should be well capped above 160.00 in favor of a fresh down-leg back towards the 2024 low at 139.58. Only a monthly close above 160.00 negates.

USDJPY Chart
R2 160.46 - 30 March/2026 high - Strong
R1 160.03 - 7 April high - Medium
S1 157.89 - 8 April low - Medium
S2 157.51 - 19 March low - Strong
USDJPY: fundamental overview

The yen has been trading off a mix of shifting rate expectations and broader global sentiment, with markets increasingly focused on the Bank of Japan after it held rates at 0.75% in March but signaled a tightening bias, fueling speculation of a potential hike as soon as April amid building inflation pressures. At the same time, improved risk sentiment on tentative optimism around a U.S.–Iran resolution has tempered traditional safe-haven demand for the yen, even as ongoing uncertainty keeps downside contained. External drivers remain key, with US rate dynamics in focus ahead of PPI data and a heavy slate of Fed speakers, which could influence yield differentials and near-term direction, leaving the yen caught between a gradually shifting domestic policy backdrop and still-dominant global macro forces.

 
AUDUSD: technical overview

There are signs of the formation of a longer-term base with the market recovering out from a meaningful longer-term support zone. The latest monthly close back above 0.7000 takes the big picture pressure off the downside and strengthens the case for a bottom, with the focus now on a push towards 0.8000. Setbacks should now be well supported ahead of 0.6700.

AUDUSD Chart
R2 0.7188 - 11 March/2026 high - Strong
R1 0.7103 - 14 April high - Medium
S1 0.6963 - 8 April low - Medium
S2 0.6833 - 30 March low - Strong
AUDUSD: fundamental overview

The Australian dollar has been driven by a mix of domestic weakness and shifting global sentiment, with a sharp collapse in Australian business confidence highlighting downside risks to growth and offsetting the impact of still-hawkish rhetoric from the RBA, which continues to flag elevated inflation and the need for tighter policy. Externally, easing geopolitical tensions and softer oil prices have supported a broader improvement in risk sentiment, offering some relief to the AUD, though gains have been limited by ongoing concerns around China’s external sector, where weaker export data points to softer global demand. At the same time, relative currency dynamics have also played a role, with the euro finding support on a weaker US dollar backdrop despite a fragile Eurozone economy still grappling with sluggish growth and energy sensitivity, leaving AUD performance more muted in comparison as markets balance domestic softness against global macro crosscurrents.

 
Suggested reading

Thoughts From The Road: Japan, H. McVey, KKR (April 1, 2026)

Satoshi Nakamoto: Mystery Behind Creator of BTC, C. Newkey-Burden, The Week (April 9, 2026)


Any opinions, news, research, analyses, prices or other information ("information") contained on this Blog, constitutes marketing communication and it has not been prepared in accordance with legal requirements designed to promote the independence of investment research. Further, the information contained within this Blog does not contain (and should not be construed as containing) investment advice or an investment recommendation, or an offer of, or solicitation for, a transaction in any financial instrument. LMAX Group has not verified the accuracy or basis-in-fact of any claim or statement made by any third parties as comments for every Blog entry.

LMAX Group will not accept liability for any loss or damage, including without limitation to, any loss of profit, which may arise directly or indirectly from use of or reliance on such information. No representation or warranty is given as to the accuracy or completeness of the above information. While the produced information was obtained from sources deemed to be reliable, LMAX Group does not provide any guarantees about the reliability of such sources. Consequently any person acting on it does so entirely at his or her own risk. It is not a place to slander, use unacceptable language or to promote LMAX Group or any other FX and CFD provider and any such postings, excessive or unjust comments and attacks will not be allowed and will be removed from the site immediately.

Day Image
13th April 2026 | view in browser
Steady but cautious amid ongoing geopolitical risks

Markets are trading cautiously as Middle East tensions keep oil elevated and support the dollar, reinforcing policy divergence led by resilient US data, while FX, equities, and commodities remain largely driven by geopolitics and energy dynamics amid a relatively light economic calendar.


Performance chart 30day v. USD (%)
Performance Chart
 
 
Technical & fundamental highlights
EURUSD: technical overview

The Euro outlook remains constructive with higher lows sought out on dips in favor of the next major upside extension targeting the 2021 high at 1.2350. Setbacks should be exceptionally well supported ahead of 1.1300.

EURUSD Chart
R2 1.1740 - 10 April high - Strong
R1 1.1700 - Figure - Medium
S1 1.1590 - 8 April low - Medium
S2 1.1504 - 3 April low - Strong
EURUSD: fundamental overview

The euro has come under a little pressure as the week gets going, primarily by persistent geopolitical tensions in the Middle East, including the ongoing disruption in the Strait of Hormuz and uncertain ceasefire talks, which have kept oil prices elevated and raised upside risks to eurozone inflation while weighing on regional growth prospects. Stronger-than-expected US economic data, particularly the resilient March labor market report, has reinforced expectations of higher-for-longer Federal Reserve rates amid rising US inflation pressures, widening the policy divergence with the ECB. The ECB’s latest projections show upward revisions to 2026 inflation due to energy costs but a downward revision to growth, with the central bank maintaining rates unchanged while adopting a cautious stance that limits aggressive easing hopes. These fundamentals, combined with broader safe-haven demand for the dollar, have driven the euro’s softer tone.

 
USDJPY: technical overview

There are signs of the formation of a meaningful top after the market put in a multi-year high in 2024. At this point, rallies should be well capped above 160.00 in favor of a fresh down-leg back towards the 2024 low at 139.58. Only a monthly close above 160.00 negates.

USDJPY Chart
R2 160.46 - 30 March/2026 high - Strong
R1 160.03 - 7 April high - Medium
S1 157.89 - 8 April low - Medium
S2 157.51 - 19 March low - Strong
USDJPY: fundamental overview

The yen has softened since the Friday close, pressured by heightened geopolitical tensions in the Middle East and ongoing risks around the Strait of Hormuz, which have lifted energy prices and worsened Japan’s terms of trade as a major importer. At the same time, persistent policy divergence with the Federal Reserve—supported by resilient US data and firmer rate expectations—continues to underpin the dollar, while the Bank of Japan maintains a cautious normalization path amid fragile domestic growth. Together, these dynamics, alongside the dollar’s dominance in attracting safe-haven flows in a higher-yield environment, have reinforced the yen’s weaker tone.

 
AUDUSD: technical overview

There are signs of the formation of a longer-term base with the market recovering out from a meaningful longer-term support zone. The latest monthly close back above 0.7000 takes the big picture pressure off the downside and strengthens the case for a bottom, with the focus now on a push towards 0.8000. Setbacks should now be well supported ahead of 0.6700.

AUDUSD Chart
R2 0.7188 - 11 March/2026 high - Strong
R1 0.7095 - 9 April high - Medium
S1 0.6963 - 8 April low - Medium
S2 0.6833 - 30 March low - Strong
AUDUSD: fundamental overview

The Australian dollar has softened since the Friday close, weighed by ongoing geopolitical tensions in the Middle East and risks around the Strait of Hormuz, which have kept oil prices elevated and dampened global risk sentiment, supporting safe-haven demand for the US dollar. As a high-beta currency, the AUD has been particularly sensitive to this shift, with broader risk aversion offsetting any support from firm commodity prices. At the same time, stronger-than-expected US data, particularly resilient labor market figures, have reinforced higher-for-longer Federal Reserve expectations, widening policy divergence with the Reserve Bank of Australia. China-related sentiment remains an additional headwind, with ongoing uncertainty around the growth outlook limiting upside for Australia’s export-driven economy and further weighing on the currency.

 
Suggested reading

The Investment That Can Shield You in Uncertain Times, J. Zweig, WSJ (April 10, 2026)

What 1,000-year-old companies know about resilience, E. Markowitz, Big Think (April 1, 2026)


Any opinions, news, research, analyses, prices or other information ("information") contained on this Blog, constitutes marketing communication and it has not been prepared in accordance with legal requirements designed to promote the independence of investment research. Further, the information contained within this Blog does not contain (and should not be construed as containing) investment advice or an investment recommendation, or an offer of, or solicitation for, a transaction in any financial instrument. LMAX Group has not verified the accuracy or basis-in-fact of any claim or statement made by any third parties as comments for every Blog entry.

LMAX Group will not accept liability for any loss or damage, including without limitation to, any loss of profit, which may arise directly or indirectly from use of or reliance on such information. No representation or warranty is given as to the accuracy or completeness of the above information. While the produced information was obtained from sources deemed to be reliable, LMAX Group does not provide any guarantees about the reliability of such sources. Consequently any person acting on it does so entirely at his or her own risk. It is not a place to slander, use unacceptable language or to promote LMAX Group or any other FX and CFD provider and any such postings, excessive or unjust comments and attacks will not be allowed and will be removed from the site immediately.

Day Image
10th April 2026 | view in browser
Geopolitics flip to tailwind

Geopolitics remains firmly in the driver’s seat. The fragile US-Iran two-week ceasefire continues to hold with the Strait of Hormuz reopened, triggering another leg lower in oil prices and cementing the relief rally in risk assets.


Performance chart 30day v. USD (%)
Performance Chart
 
 
Technical & fundamental highlights
EURUSD: technical overview

The Euro outlook remains constructive with higher lows sought out on dips in favor of the next major upside extension targeting the 2021 high at 1.2350. Setbacks should be exceptionally well supported ahead of 1.1300.

EURUSD Chart
R2 1.1724 - 9 April high - Strong
R1 1.1700 - Figure - Medium
S1 1.1590 - 8 April low - Medium
S2 1.1504 - 3 April low - Strong
EURUSD: fundamental overview

The euro has been supported by the ongoing fragile US-Iran ceasefire and the associated reopening of the Strait of Hormuz, which has eased immediate oil supply disruption fears and driven a sharp pullback in crude prices. This has reduced stagflation risks for the eurozone by limiting imported inflation pressures while preserving some growth resilience, leading to a relief move in risk assets and a dialing back of expectations for aggressive near-term ECB rate hikes. With no meaningful economic data releases or central bank commentary emerging to alter the narrative, the single currency has also benefited from softer safe-haven flows into the dollar and modestly improved European sentiment, though lingering doubts over the ceasefire’s durability continue to limit upside conviction.

 
USDJPY: technical overview

There are signs of the formation of a meaningful top after the market put in a multi-year high in 2024. At this point, rallies should be well capped above 160.00 in favor of a fresh down-leg back towards the 2024 low at 139.58. Only a monthly close above 160.00 negates.

USDJPY Chart
R2 160.46 - 30 March/2026 high - Strong
R1 160.03 - 7 April high - Medium
S1 157.89 - 8 April low - Medium
S2 157.51 - 19 March low - Strong
USDJPY: fundamental overview

The Japanese yen has strengthened modestly amid the fragile US-Iran ceasefire and reopening of the Strait of Hormuz, which has triggered a sharp decline in oil prices and eased immediate energy supply disruption fears for Japan as a major net importer. Lower crude costs have reduced imported inflation pressures and supported risk sentiment, diminishing safe-haven demand for the dollar while highlighting the yen’s sensitivity to oil and geopolitical developments. With no major economic data releases and limited fresh central bank commentary, growing market expectations for a potential Bank of Japan rate hike as early as April—to address persistent inflation—have provided additional underlying support, though lingering doubts over the ceasefire’s durability continue to cap the yen’s gains.

 
AUDUSD: technical overview

There are signs of the formation of a longer-term base with the market recovering out from a meaningful longer-term support zone. The latest monthly close back above 0.7000 takes the big picture pressure off the downside and strengthens the case for a bottom, with the focus now on a push towards 0.8000. Setbacks should now be well supported ahead of 0.6700.

AUDUSD Chart
R2 0.7188 - 11 March/2026 high - Strong
R1 0.7095 - 9 April high - Medium
S1 0.6963 - 8 April low - Medium
S2 0.6833 - 30 March low - Strong
AUDUSD: fundamental overview

The Australian dollar has been supported by the fragile US-Iran ceasefire and reopening of the Strait of Hormuz, which has triggered a sharp decline in oil prices and eased immediate energy supply disruption fears. As a major commodity exporter, Australia has benefited from improved global risk sentiment and reduced stagflation risks, weighing on safe-haven flows into the dollar and supporting carry trade appetite. However, lower crude costs have also tempered imported inflation pressures, leading markets to scale back expectations for aggressive near-term RBA rate hikes amid a more balanced growth and inflation outlook, which has helped cap the extent of the Aussie’s upside.

 
Suggested reading

The Decline and Fall of the Dollar Empire, B. Eichengreen, Project Syndicate (April 9, 2026)

An Impossible Choice For The Fed?, H. McDonald, Carson Group (April 8, 2026)


Any opinions, news, research, analyses, prices or other information ("information") contained on this Blog, constitutes marketing communication and it has not been prepared in accordance with legal requirements designed to promote the independence of investment research. Further, the information contained within this Blog does not contain (and should not be construed as containing) investment advice or an investment recommendation, or an offer of, or solicitation for, a transaction in any financial instrument. LMAX Group has not verified the accuracy or basis-in-fact of any claim or statement made by any third parties as comments for every Blog entry.

LMAX Group will not accept liability for any loss or damage, including without limitation to, any loss of profit, which may arise directly or indirectly from use of or reliance on such information. No representation or warranty is given as to the accuracy or completeness of the above information. While the produced information was obtained from sources deemed to be reliable, LMAX Group does not provide any guarantees about the reliability of such sources. Consequently any person acting on it does so entirely at his or her own risk. It is not a place to slander, use unacceptable language or to promote LMAX Group or any other FX and CFD provider and any such postings, excessive or unjust comments and attacks will not be allowed and will be removed from the site immediately.

Day Image
9th April 2026 | view in browser
Geopolitics dominate as ceasefire resets market tone

Global markets have been running with a clear risk-on tone, driven almost entirely by the landmark US-Iran two-week ceasefire agreement tied to the reopening of the Strait of Hormuz. This diplomatic breakthrough has rapidly removed the geopolitical risk premium that had been weighing on sentiment for weeks, shifting flows decisively away from safe-haven assets and into riskier ones.


Performance chart 30day v. USD (%)
Performance Chart
 
 
Technical & fundamental highlights
EURUSD: technical overview

The Euro outlook remains constructive with higher lows sought out on dips in favor of the next major upside extension targeting the 2021 high at 1.2350. Setbacks should be exceptionally well supported ahead of 1.1300.

EURUSD Chart
R2 1.1722 - 8 April high - Strong
R1 1.1700 - Figure - Medium
S1 1.1590 - 8 April low - Medium
S2 1.1504 - 3 April low - Strong
EURUSD: fundamental overview

The euro has been primarily supported by diplomatic breakthroughs in the Middle East, including a US-Iran agreement on a two-week ceasefire that includes potential reopening of the Strait of Hormuz, which has eased safe-haven demand for the US dollar and lowered fears of prolonged energy price shocks weighing on eurozone growth. This geopolitical de-escalation has been reinforced by resilient eurozone economic signals, such as moderate inflation around 2.5% driven by prior energy pressures, helping sustain the European Central Bank’s relatively cautious and data-dependent stance compared to mixed US indicators and ongoing Federal Reserve rate path uncertainty. Overall, reduced geopolitical risk premiums have shifted flows in favor of the euro on fundamental grounds.

 
USDJPY: technical overview

There are signs of the formation of a meaningful top after the market put in a multi-year high in 2024. At this point, rallies should be well capped above 160.00 in favor of a fresh down-leg back towards the 2024 low at 139.58. Only a monthly close above 160.00 negates.

USDJPY Chart
R2 160.46 - 30 March/2026 high - Strong
R1 160.03 - 7 April high - Medium
S1 157.89 - 8 April low - Medium
S2 157.51 - 19 March low - Strong
USDJPY: fundamental overview

The yen has been primarily supported by diplomatic breakthroughs in the Middle East, including a US-Iran agreement on a two-week ceasefire with potential reopening of the Strait of Hormuz, which has eased geopolitical tensions, reduced safe-haven flows into the dollar, and lowered concerns over prolonged high energy prices that heavily burden Japan’s import-dependent economy. This de-escalation has offset some pressure from elevated oil costs and helped temper fears of imported inflation, while expectations of a near-term Bank of Japan rate hike and official warnings against excessive yen weakness have provided additional fundamental backing. Overall, the reduced risk premium from geopolitics has shifted flows in favor of the yen against the backdrop of persistent US dollar strength and mixed domestic economic signals.

 
AUDUSD: technical overview

There are signs of the formation of a longer-term base with the market recovering out from a meaningful longer-term support zone. The latest monthly close back above 0.7000 takes the big picture pressure off the downside and strengthens the case for a bottom, with the focus now on a push towards 0.8000. Setbacks should now be well supported ahead of 0.6700.

AUDUSD Chart
R2 0.7188 - 11 March/2026 high - Strong
R1 0.7085 - 8 April high - Medium
S1 0.6963 - 8 April low - Medium
S2 0.6833 - 30 March low - Strong
AUDUSD: fundamental overview

The Australian dollar has been primarily supported by diplomatic breakthroughs in the Middle East, including a US-Iran agreement on a two-week ceasefire with potential reopening of the Strait of Hormuz, which has eased geopolitical tensions, boosted global risk sentiment, and lowered oil prices sharply. This development has reduced safe-haven demand for the US dollar while alleviating imported inflation pressures for Australia and supporting its commodity export outlook through improved risk appetite. The relief has complemented the Reserve Bank of Australia’s hawkish stance, with recent rate hikes to 4.10% and market expectations for potential further tightening in May amid still-elevated domestic inflation, helping sustain the AUD against mixed US economic signals and Federal Reserve policy uncertainty. Overall, the geopolitical de-escalation has shifted fundamental flows in favor of the risk-sensitive Australian dollar.

 
Suggested reading

The Upper Middle Class Trap, N. Maggiulli, Of Dollars and Data (April 7, 2026)

Memories Of Good Investments, J. Klement, Klement on Investing (April 7, 2026)


Any opinions, news, research, analyses, prices or other information ("information") contained on this Blog, constitutes marketing communication and it has not been prepared in accordance with legal requirements designed to promote the independence of investment research. Further, the information contained within this Blog does not contain (and should not be construed as containing) investment advice or an investment recommendation, or an offer of, or solicitation for, a transaction in any financial instrument. LMAX Group has not verified the accuracy or basis-in-fact of any claim or statement made by any third parties as comments for every Blog entry.

LMAX Group will not accept liability for any loss or damage, including without limitation to, any loss of profit, which may arise directly or indirectly from use of or reliance on such information. No representation or warranty is given as to the accuracy or completeness of the above information. While the produced information was obtained from sources deemed to be reliable, LMAX Group does not provide any guarantees about the reliability of such sources. Consequently any person acting on it does so entirely at his or her own risk. It is not a place to slander, use unacceptable language or to promote LMAX Group or any other FX and CFD provider and any such postings, excessive or unjust comments and attacks will not be allowed and will be removed from the site immediately.

Day Image
3rd April 2026 | view in browser
Cautious markets eye volatile oil, thin NFP

The broader macro tone remains cautious amid ongoing Middle East developments, though occasional optimistic rhetoric has provided temporary relief and supported brief recoveries in risk sentiment.


Performance chart 30day v. USD (%)
Performance Chart
 
 
Technical & fundamental highlights
EURUSD: technical overview

The Euro outlook remains constructive with higher lows sought out on dips in favor of the next major upside extension targeting the 2021 high at 1.2350. Setbacks should be exceptionally well supported ahead of 1.1300.

EURUSD Chart
R2 1.1668 - 10 March high - Strong
R1 1.1641 - 23 March high - Medium
S1 1.1443 - 30 March low - Medium
S2 1.1411 - 13 March/2026 low - Strong
EURUSD: fundamental overview

The euro has been supported over the past 24 hours primarily by a softer U.S. dollar backdrop, with markets reassessing Fed policy expectations after mixed U.S. data and cautious commentary around inflation risks. At the same time, improving risk sentiment—driven by easing geopolitical concerns—has reduced demand for the dollar as a safe haven, indirectly benefiting the single currency. On the European side, relatively stable data and a lack of dovish surprises from the European Central Bank have helped anchor rate expectations, while resilience in recent regional indicators continues to support the view that policy will remain restrictive for longer. Overall, the move has been less about euro-specific catalysts and more a function of shifting rate differentials and broader macro positioning.

 
USDJPY: technical overview

There are signs of the formation of a meaningful top after the market put in a multi-year high in 2024. At this point, rallies should be well capped above 160.00 in favor of a fresh down-leg back towards the 2024 low at 139.58. Only a monthly close above 160.00 negates.

USDJPY Chart
R2 161.00 - Figure - Strong
R1 160.46 - 30 March/2026 high - Medium
S1 158.02 - 23 March low - Medium
S2 157.51 - 19 March low - Strong
USDJPY: fundamental overview

The yen has come under pressure amid a combination of external and policy-driven factors, with elevated oil prices on the back of Middle East tensions weighing on Japan’s terms of trade given its heavy reliance on energy imports. At the same time, persistent divergence in rate expectations continues to act as a headwind, with the Bank of Japan maintaining a cautious normalization path relative to other central banks, despite firmer domestic data and ongoing inflation concerns. While Japanese officials have reiterated warnings around excessive FX moves, markets remain unconvinced about the likelihood of imminent intervention, leaving the currency sensitive to broader yield differentials and shifts in global risk sentiment.

 
AUDUSD: technical overview

There are signs of the formation of a longer-term base with the market recovering out from a meaningful longer-term support zone. The latest monthly close back above 0.7000 takes the big picture pressure off the downside and strengthens the case for a bottom, with the focus now on a push towards 0.8000. Setbacks should now be well supported ahead of 0.6700.

AUDUSD Chart
R2 0.7188 - 11 March/2026 high - Strong
R1 0.7000 - Psychological - Medium
S1 0.6833 - 30 March low - Medium
S2 0.6767 - 7 January high - Strong
AUDUSD: fundamental overview

The Australian dollar has been supported by an improvement in global risk sentiment and a softer U.S. dollar backdrop, with easing geopolitical tensions helping to lift demand for higher-beta currencies. On the domestic side, relatively resilient data and stable expectations around the Reserve Bank of Australia have reinforced the view that policy will remain on hold for now, without a shift toward aggressive easing. At the same time, stronger signals out of China—Australia’s key trading partner—have provided an additional tailwind, particularly through the commodities channel, leaving the currency primarily driven by external growth expectations and broader macro positioning.

 
Suggested reading

What Are The Odds Of A Bear Market In 2026?, R. Detrick, Carson Group (April 1, 2026)

AI, Tariffs, and Global Uncertainty, V. Katenelson, The Intellectual Investor (April 2, 2026)


Any opinions, news, research, analyses, prices or other information ("information") contained on this Blog, constitutes marketing communication and it has not been prepared in accordance with legal requirements designed to promote the independence of investment research. Further, the information contained within this Blog does not contain (and should not be construed as containing) investment advice or an investment recommendation, or an offer of, or solicitation for, a transaction in any financial instrument. LMAX Group has not verified the accuracy or basis-in-fact of any claim or statement made by any third parties as comments for every Blog entry.

LMAX Group will not accept liability for any loss or damage, including without limitation to, any loss of profit, which may arise directly or indirectly from use of or reliance on such information. No representation or warranty is given as to the accuracy or completeness of the above information. While the produced information was obtained from sources deemed to be reliable, LMAX Group does not provide any guarantees about the reliability of such sources. Consequently any person acting on it does so entirely at his or her own risk. It is not a place to slander, use unacceptable language or to promote LMAX Group or any other FX and CFD provider and any such postings, excessive or unjust comments and attacks will not be allowed and will be removed from the site immediately.

Day Image
1st April 2026 | view in browser
Dollar down as markets test risk appetite

The dollar weakens into April as risk sentiment tentatively improves on shifting US-Iran headlines, though ongoing geopolitical tensions keep markets focused on incoming macro data and central bank signals for direction.


Performance chart 30day v. USD (%)
Performance Chart
 
 
Technical & fundamental highlights
EURUSD: technical overview

The Euro outlook remains constructive with higher lows sought out on dips in favor of the next major upside extension targeting the 2021 high at 1.2350. Setbacks should be exceptionally well supported ahead of 1.1300.

EURUSD Chart
R2 1.1668 - 10 March high - Strong
R1 1.1641 - 23 March high - Medium
S1 1.1443 - 30 March low - Medium
S2 1.1411 - 13 March/2026 low - Strong
EURUSD: fundamental overview

The euro has rebounded, supported by a softer dollar and tentative signs of geopolitical de-escalation. The latest data highlighted a mixed macro backdrop, with Eurozone inflation picking up to 2.5% YoY driven by energy costs, while core inflation eased and growth indicators—such as German retail sales and French consumption—remained weak, reinforcing a stagflationary tone. European Central Bank officials have acknowledged this balance, signaling caution as policymakers weigh persistent inflation risks against softening demand. For now, the euro’s outlook remains finely balanced, with upside limited by weak activity even as inflation keeps the ECB from turning decisively dovish, while upcoming labor market and PMI data will be key in shaping expectations.

 
USDJPY: technical overview

There are signs of the formation of a meaningful top after the market put in a multi-year high in 2024. At this point, rallies should be well capped above 160.00 in favor of a fresh down-leg back towards the 2024 low at 139.58. Only a monthly close above 160.00 negates.

USDJPY Chart
R2 161.00 - Figure - Strong
R1 160.46 - 30 March/2026 high - Medium
S1 158.02 - 23 March low - Medium
S2 157.51 - 19 March low - Strong
USDJPY: fundamental overview

Japan’s latest data points to resilient but cautious economic conditions, with the Bank of Japan Q1 Tankan survey showing improved business sentiment across both manufacturing and services, even as firms grow more cautious on the outlook and scale back capital expenditure plans. Meanwhile, the final March manufacturing PMI was revised slightly higher and remained in expansion territory, though momentum has softened from February, with easing output and demand. Rising input costs—driven by energy prices, a weaker yen, and labor shortages—are also becoming more pronounced, with companies increasingly passing these pressures on to consumers.

 
AUDUSD: technical overview

There are signs of the formation of a longer-term base with the market recovering out from a meaningful longer-term support zone. The latest monthly close back above 0.7000 takes the big picture pressure off the downside and strengthens the case for a bottom, with the focus now on a push towards 0.8000. Setbacks should now be well supported ahead of 0.6700.

AUDUSD Chart
R2 0.7188 - 11 March/2026 high - Strong
R1 0.7000 - Psychological - Medium
S1 0.6833 - 30 March low - Medium
S2 0.6767 - 7 January high - Strong
AUDUSD: fundamental overview

Australia’s latest data highlights a sharp divergence in the economy, with a strong rebound in housing—driven by a surge in apartment approvals—contrasting with a steep downturn in manufacturing. While dwelling approvals jumped to near five-year highs and housing activity shows resilience, the manufacturing sector has slipped back into contraction, with sentiment, employment, and capacity utilization all deteriorating sharply amid rising energy costs and supply chain disruptions. In short, a housing-led recovery is being overshadowed by a renewed industrial slowdown, as geopolitical energy shocks weigh heavily on the sector.

 
Suggested reading

Our Sour Mood Isn’t New, Not Related to Now, J. Calhoun, Alhambra (March 29, 2026)

Why Bottom For This Stock Market Is Closer Than You Think, J. Sonenshine, Barron’s (March 27, 2026)


Any opinions, news, research, analyses, prices or other information ("information") contained on this Blog, constitutes marketing communication and it has not been prepared in accordance with legal requirements designed to promote the independence of investment research. Further, the information contained within this Blog does not contain (and should not be construed as containing) investment advice or an investment recommendation, or an offer of, or solicitation for, a transaction in any financial instrument. LMAX Group has not verified the accuracy or basis-in-fact of any claim or statement made by any third parties as comments for every Blog entry.

LMAX Group will not accept liability for any loss or damage, including without limitation to, any loss of profit, which may arise directly or indirectly from use of or reliance on such information. No representation or warranty is given as to the accuracy or completeness of the above information. While the produced information was obtained from sources deemed to be reliable, LMAX Group does not provide any guarantees about the reliability of such sources. Consequently any person acting on it does so entirely at his or her own risk. It is not a place to slander, use unacceptable language or to promote LMAX Group or any other FX and CFD provider and any such postings, excessive or unjust comments and attacks will not be allowed and will be removed from the site immediately.

Day Image
31st March 2026 | view in browser
Markets eye data deluge in pivotal session

Markets enter the new day cautiously constructive, with EURUSD stabilizing amid rising Eurozone inflation expectations, softer oil offering support, and focus shifting to key US labor data and central bank signals against a backdrop of month and quarter-end US Dollar flow dynamics.


Performance chart 30day v. USD (%)
Performance Chart
 
 
Technical & fundamental highlights
EURUSD: technical overview

The Euro outlook remains constructive with higher lows sought out on dips in favor of the next major upside extension targeting the 2021 high at 1.2350. Setbacks should be exceptionally well supported ahead of 1.1300.

EURUSD Chart
R2 1.1668 - 10 March high - Strong
R1 1.1641 - 23 March high - Medium
S1 1.1443 - 30 March low - Medium
S2 1.1411 - 13 March/2026 low - Strong
EURUSD: fundamental overview

The euro is trying to hold up after five straight days of declines. Recent data showed a renewed rise in eurozone inflation, led by Germany, pointing to stronger price pressures, while growth indicators weakened, with softer confidence and slower retail sales suggesting cooling demand. This mix highlights a stagflationary backdrop, a risk also flagged by ECB Stournaras, who warned that escalating Middle East tensions could trigger an energy shock and further complicate the outlook. Overall, while higher inflation may make the ECB more cautious on rate cuts, weak growth, rising energy costs, and a stronger dollar continue to weigh on the euro.

 
USDJPY: technical overview

There are signs of the formation of a meaningful top after the market put in a multi-year high in 2024. At this point, rallies should be well capped above 160.00 in favor of a fresh down-leg back towards the 2024 low at 139.58. Only a monthly close above 160.00 negates.

USDJPY Chart
R2 161.00 - Figure - Strong
R1 160.46 - 30 March/2026 high - Medium
S1 158.55 - 25 March low - Medium
S2 157.51 - 19 March low - Strong
USDJPY: fundamental overview

The Yen has pared earlier gains, with USDJPY still hovering near the 160 level—a zone closely watched for potential intervention by Japanese authorities. Recent Tokyo inflation data showed easing price pressures, with both headline and core CPI remaining below the BoJ’s 2% target, while softer retail sales and industrial production point to weakening domestic demand. Labor market conditions remain relatively stable, but overall, the data suggest a mixed economic backdrop that reduces pressure on the Bank of Japan to tighten policy more aggressively.

 
AUDUSD: technical overview

There are signs of the formation of a longer-term base with the market recovering out from a meaningful longer-term support zone. The latest monthly close back above 0.7000 takes the big picture pressure off the downside and strengthens the case for a bottom, with the focus now on a push towards 0.8000. Setbacks should now be well supported ahead of 0.6700.

AUDUSD Chart
R2 0.7188 - 11 March/2026 high - Strong
R1 0.7000 - Psychological - Medium
S1 0.6833 - 30 March low - Medium
S2 0.6767 - 7 January high - Strong
AUDUSD: fundamental overview

The Australian dollar remains under pressure near a two-month low, weighed down by heightened geopolitical tensions and a stronger US dollar. Recent RBA minutes highlight a central bank still focused on fighting inflation, delivering another rate hike and signaling more could follow as price pressures—partly driven by energy risks—and tight labor markets persist, even as consumer demand shows signs of strain. Meanwhile, credit data points to resilience, with lending activity stabilizing and picking up modestly despite higher borrowing costs.

 
Suggested reading

Strategy, Bitcoin Whale, Has Stock That Can Defty Gravity, J. Graham, Investors (March 20, 2026)

3 Reasons The Stock Market Can Endure The War, J. Mackintosh, WSJ (March 29, 2026)


Any opinions, news, research, analyses, prices or other information ("information") contained on this Blog, constitutes marketing communication and it has not been prepared in accordance with legal requirements designed to promote the independence of investment research. Further, the information contained within this Blog does not contain (and should not be construed as containing) investment advice or an investment recommendation, or an offer of, or solicitation for, a transaction in any financial instrument. LMAX Group has not verified the accuracy or basis-in-fact of any claim or statement made by any third parties as comments for every Blog entry.

LMAX Group will not accept liability for any loss or damage, including without limitation to, any loss of profit, which may arise directly or indirectly from use of or reliance on such information. No representation or warranty is given as to the accuracy or completeness of the above information. While the produced information was obtained from sources deemed to be reliable, LMAX Group does not provide any guarantees about the reliability of such sources. Consequently any person acting on it does so entirely at his or her own risk. It is not a place to slander, use unacceptable language or to promote LMAX Group or any other FX and CFD provider and any such postings, excessive or unjust comments and attacks will not be allowed and will be removed from the site immediately.