Day Image
1st June 2026 | view in browser
Priced for peace, hedged for conflict

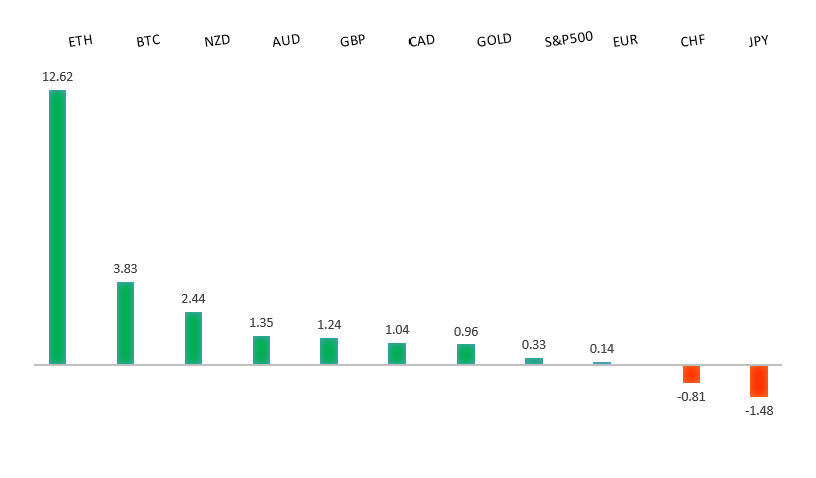
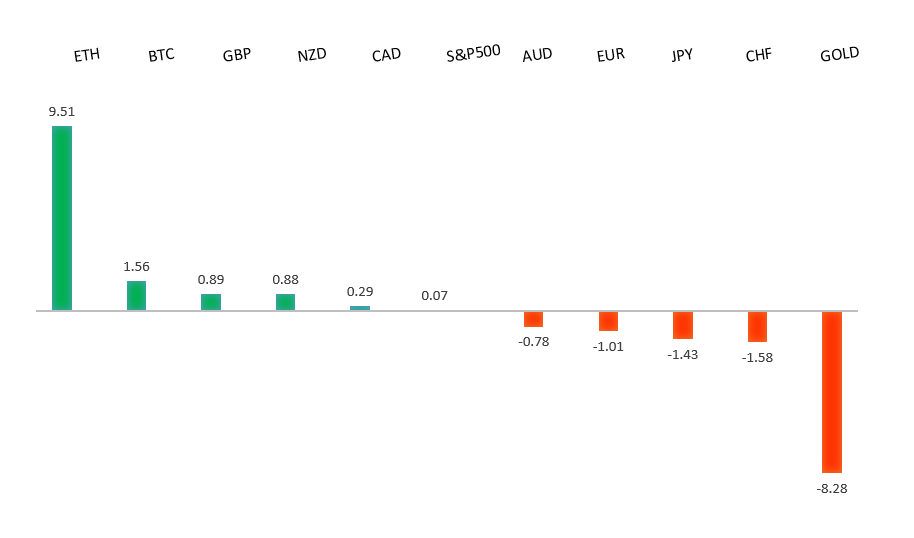
Markets begin the week balancing resilient risk appetite against escalating Middle East uncertainty, with higher oil prices, a modest safe-haven bid in the US dollar, hawkish central bank rhetoric, and unresolved US-Iran negotiations emerging as the key drivers of FX, equities, and commodity price action.


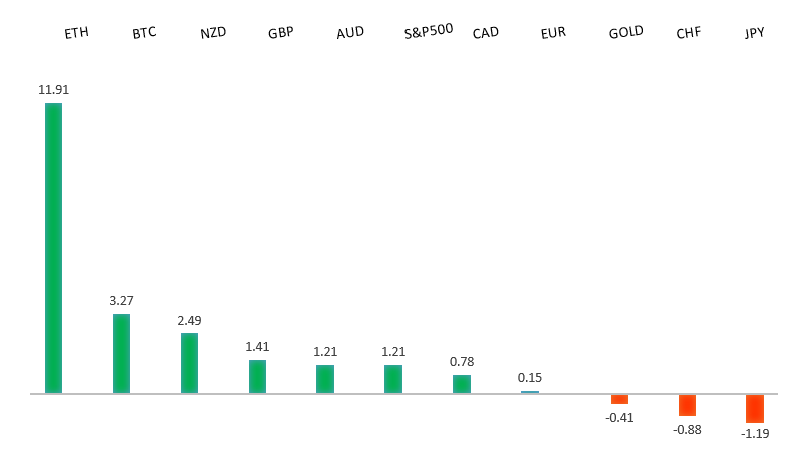
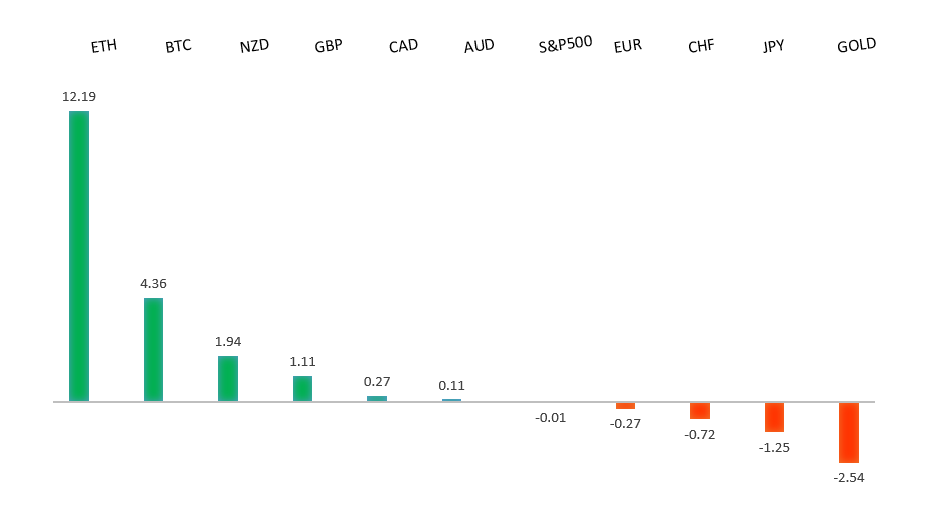
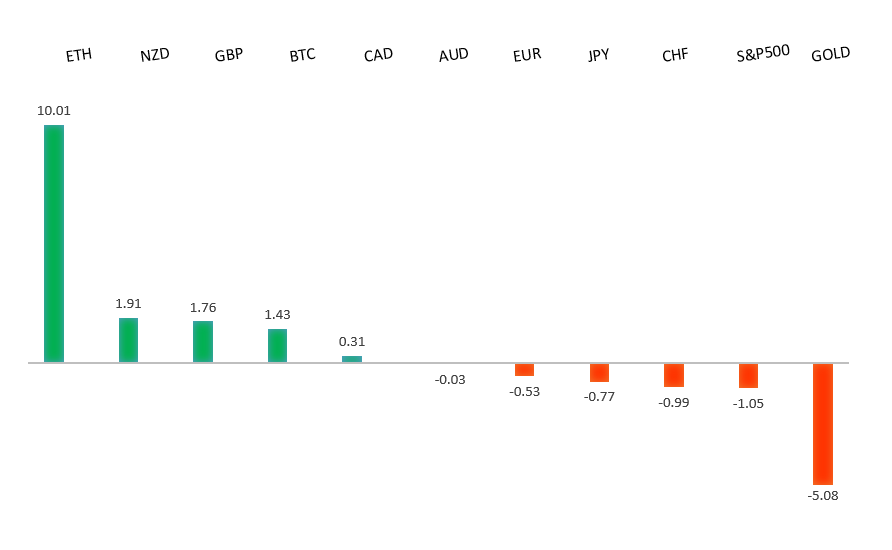
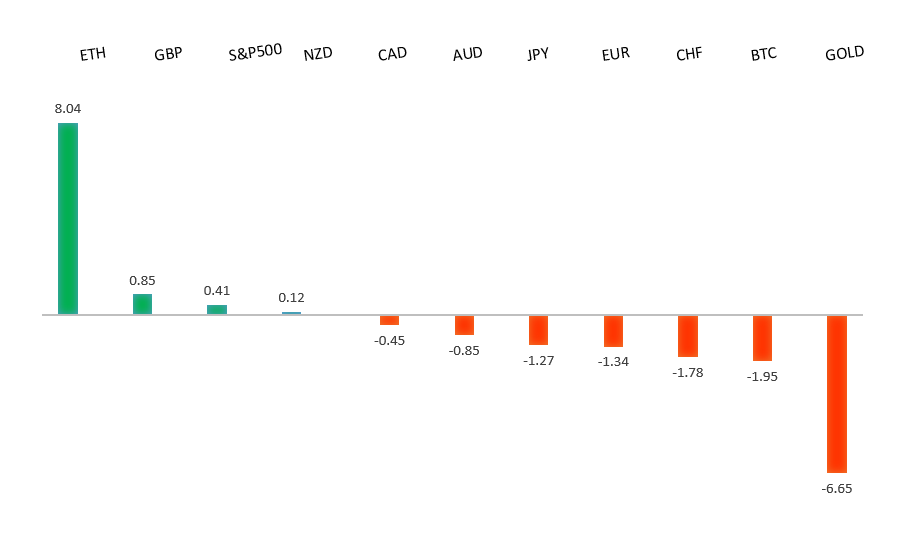
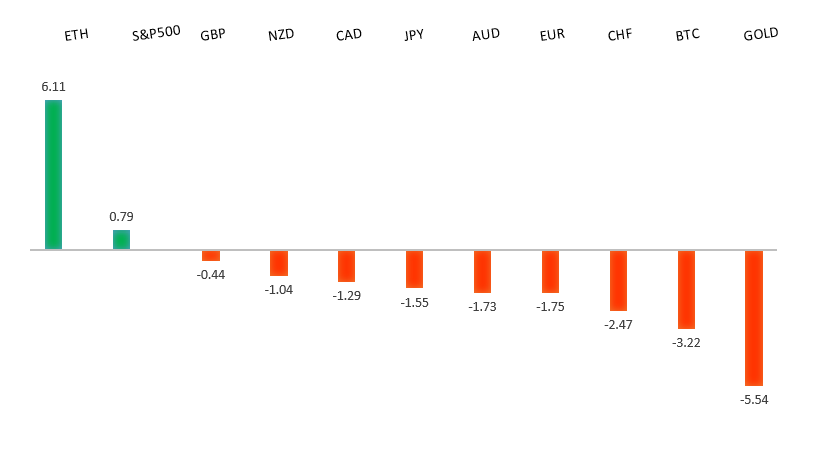
Performance chart 30day v. USD (%)
Performance Chart
 
 
Technical & fundamental highlights
EURUSD: technical overview

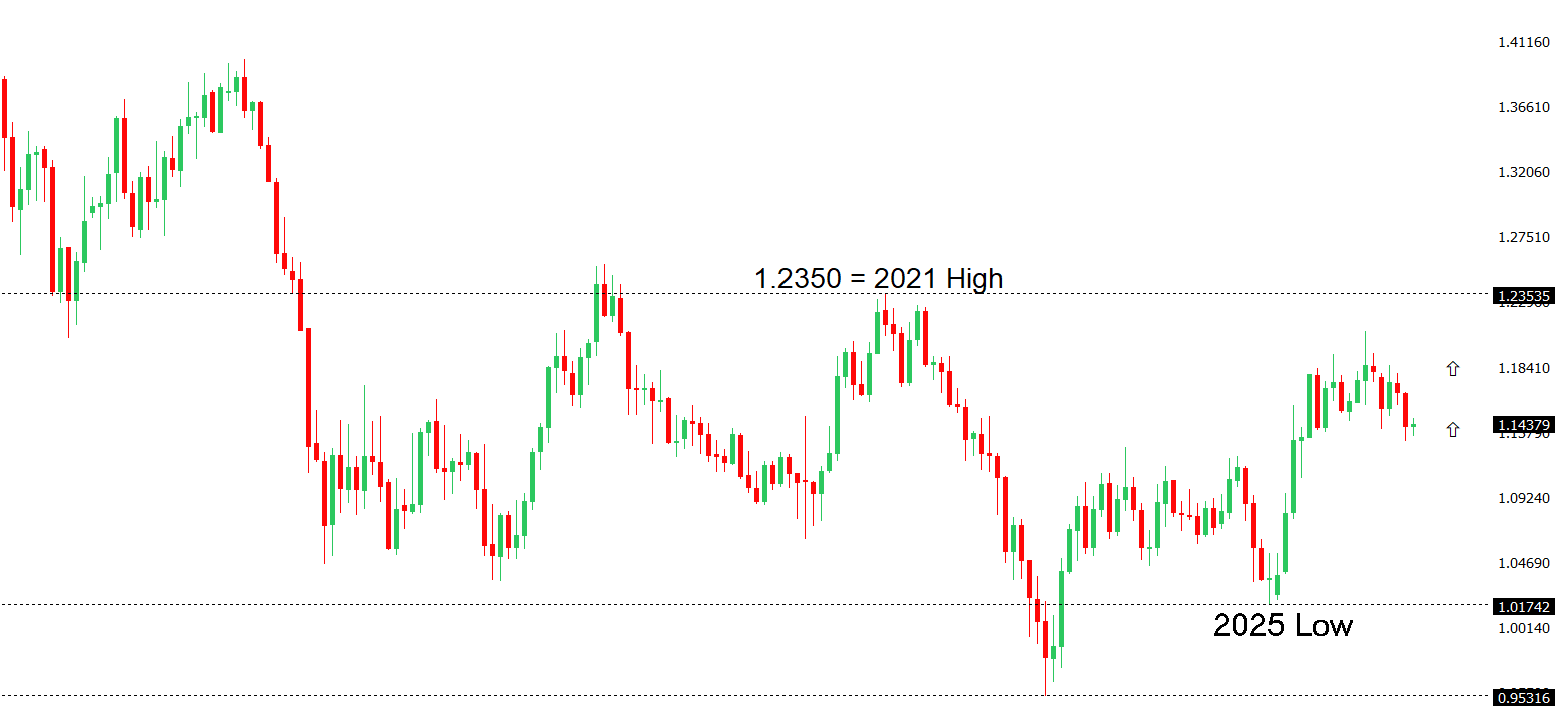
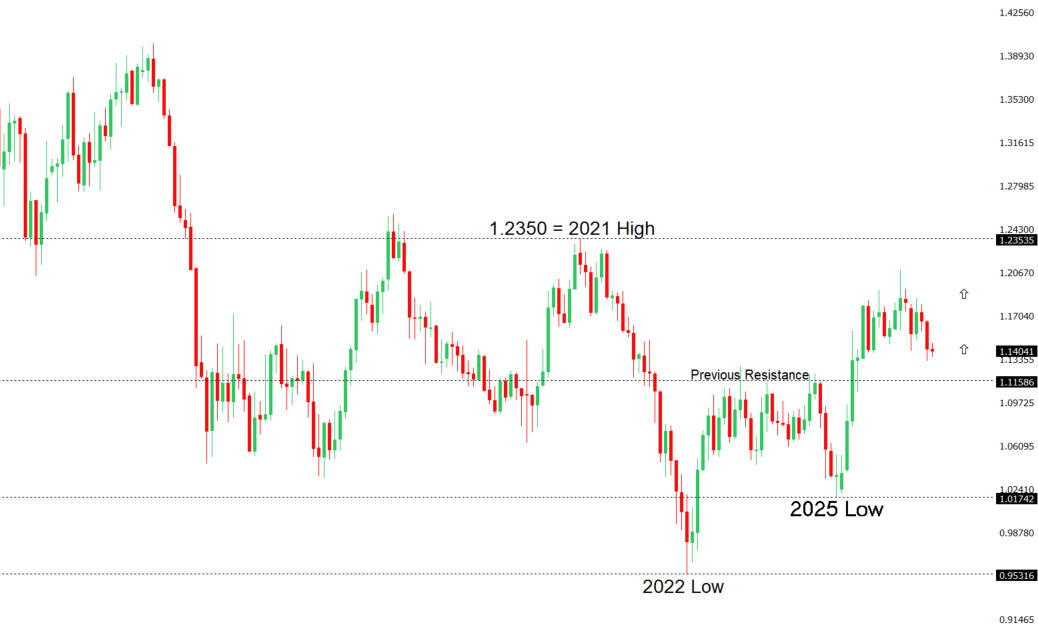
The Euro outlook remains constructive with higher lows sought out on dips in favor of the next major upside extension targeting the 2021 high at 1.2350. Setbacks should be exceptionally well supported ahead of 1.1300.

EURUSD Chart
R2 1.1797 - 6 May high - Medium
R1 1.1722 - 14 May high - Medium
S1 1.1576 - 21 May low - Medium
S2 1.1504 - 3 April low - Strong
EURUSD: fundamental overview

The euro remains underpinned by a combination of ECB hawkishness and improving risk sentiment, with markets increasingly focused on the prospect of additional policy tightening from Frankfurt. The latest catalyst came from ECB Executive Board member Isabel Schnabel, who argued that the central bank can no longer look through the inflationary effects of the Iran conflict, warning that price pressures have broadened well beyond energy and that inflation expectations risk becoming unanchored. Importantly, Schnabel reframed the Iran shock as a more persistent global cost and demand shock rather than a temporary energy spike, signaling that further rate hikes remain firmly on the table and declining to place any ceiling on the tightening cycle. Markets are now fully pricing two additional ECB rate hikes over the next year and continue to assign meaningful odds of a third move. At the same time, tentative progress toward a longer-lasting ceasefire agreement between the US and Iran has helped support broader risk appetite, reducing some of the downside risks to the euro associated with energy supply disruptions. Against this backdrop, EURUSD remains supported on relative rate differentials, though gains have been tempered by a modest recovery in the US dollar ahead of this week’s key US labor market data, particularly the May nonfarm payrolls report.

 
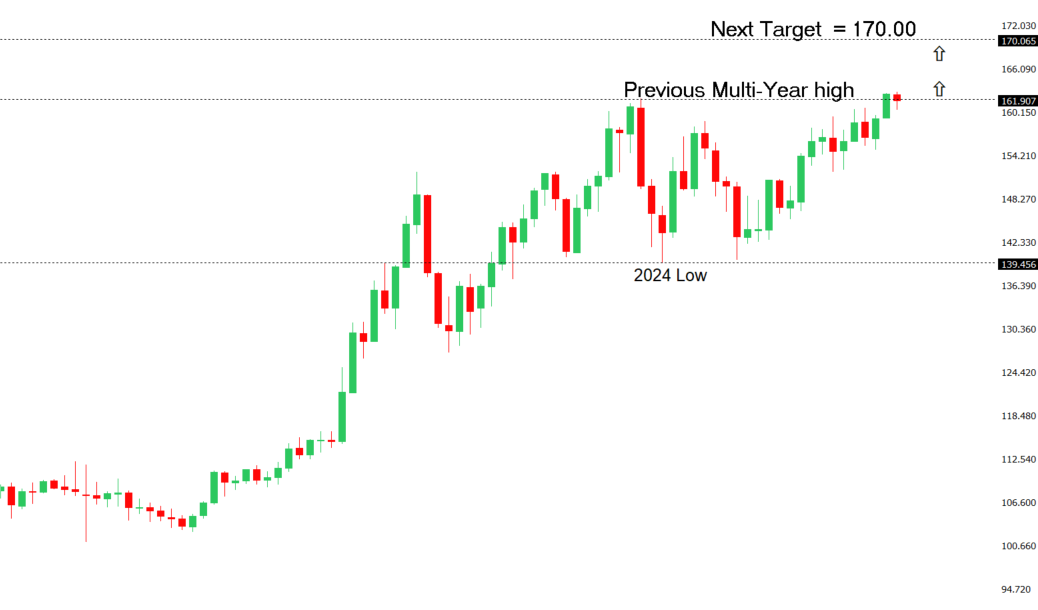
USDJPY: technical overview

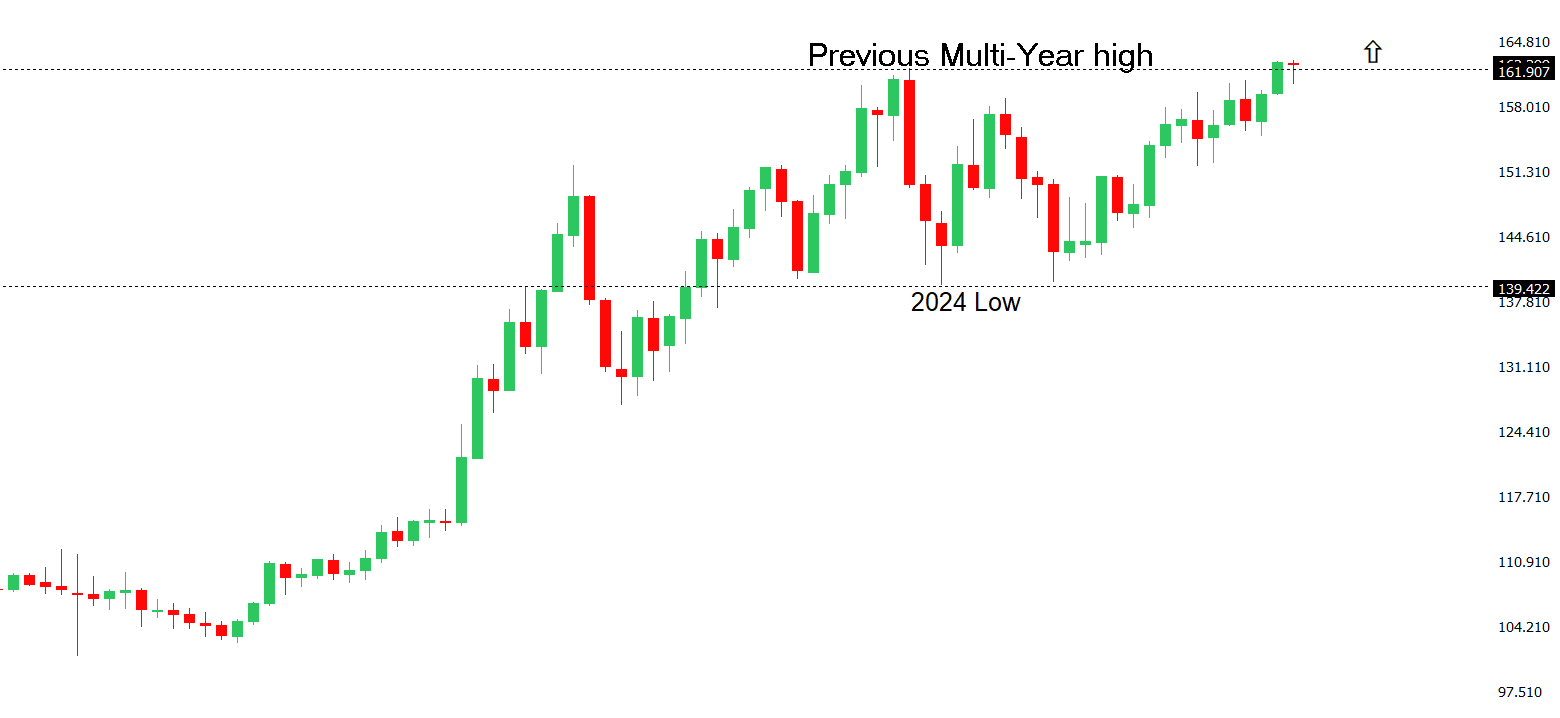
There are signs of the formation of a meaningful top after the market put in a multi-year high in 2024. At this point, rallies should be well capped above 160.00 in favor of a fresh down-leg back towards the 2024 low at 139.58. Only a monthly close above 160.00 negates.

USDJPY Chart
R2 160.00 - Psychological - Strong
R1 159.66 - 28 May high - Medium
S1 158.59 - 20 May low - Medium
S2 157.29 - 14 May low - Medium
USDJPY: fundamental overview

The Yen remains pressured by a combination of softer domestic growth signals and an unfavorable rate differential versus the US Dollar. The latest Ministry of Finance data showed Q1 corporate capital spending effectively stalled, rising just 0.047% y/y versus expectations for a 4.0% increase and slowing sharply from 6.5% in Q4, reinforcing expectations that Japan’s preliminary Q1 GDP growth estimate may be revised lower on June 8. The weak investment data, alongside concerns about the impact of elevated energy prices and Middle East tensions on Japan’s import-dependent economy, has largely offset support from increasingly hawkish Bank of Japan rhetoric. Governor Ueda recently reiterated concerns about inflation becoming more entrenched through second-round effects on wages and inflation expectations, keeping alive the prospect of further policy normalization. However, markets remain cautious about the BOJ’s ability to tighten aggressively given signs of slowing domestic demand and subdued capital expenditure despite strong corporate profits, which rose 14.6% y/y in Q1. At the same time, persistent yield spreads between US Treasuries and JGBs continue to favor Dollar demand, while resilient US economic data has encouraged investors to scale back Fed easing expectations. As a result, USDJPY remains supported despite growing expectations for further BOJ normalization, with incoming inflation data and the June GDP revision likely to play a key role in shaping near-term Yen direction.

 
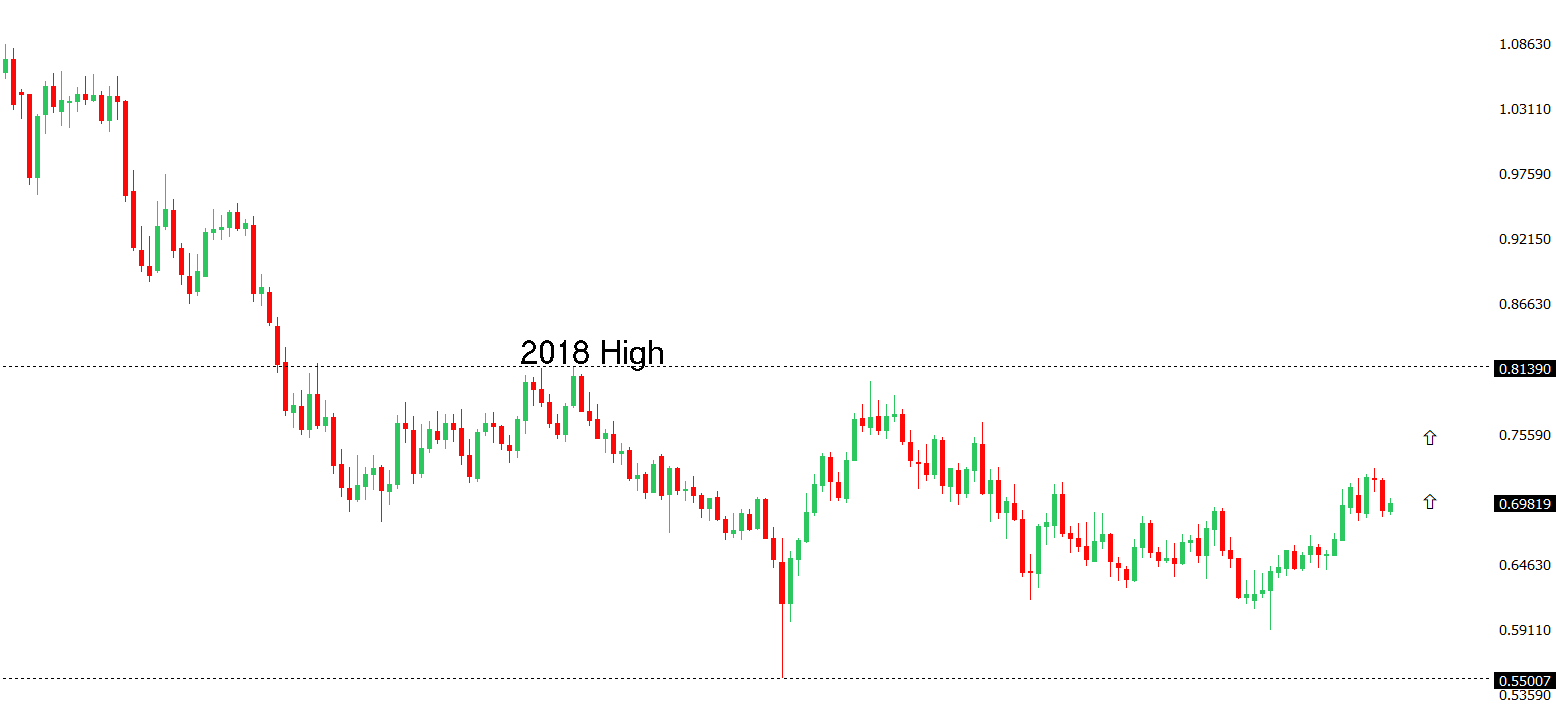
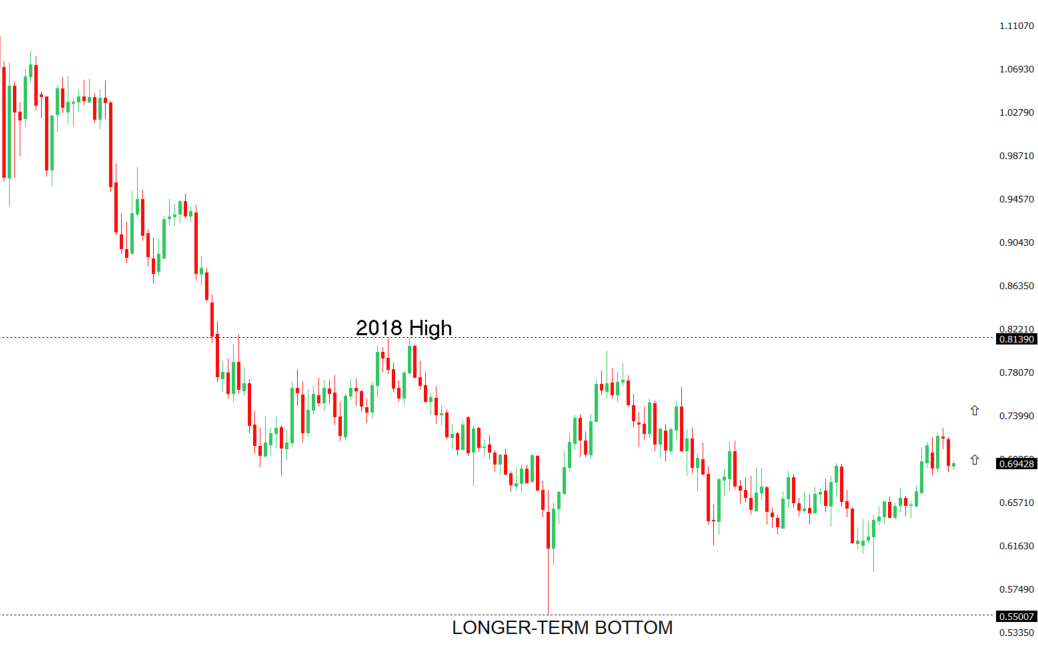
AUDUSD: technical overview

There are signs of the formation of a longer-term base with the market recovering out from a meaningful longer-term support zone. The latest monthly close back above 0.7000 takes the big picture pressure off the downside and strengthens the case for a bottom, with the focus now on a push towards 0.8000. Setbacks should now be well supported ahead of 0.6700.

AUDUSD Chart
R2 0.7278 - 6 May/2026 high - Strong
R1 0.7222 - 17 April high - Medium
S1 0.7079 - 19 May low - Medium
S2 0.6963 - 8 April low - Strong
AUDUSD: fundamental overview

The Australian dollar has remained relatively resilient, with AUDUSD hovering just below the 0.7200 level and near recent two-week highs, supported by signs of stabilization in Chinese manufacturing activity and broader optimism around Australia’s key export outlook. However, gains continue to be capped by a stronger US dollar backdrop, as persistent US inflation pressures reinforce expectations that the Federal Reserve will keep policy restrictive for longer. Geopolitical uncertainty surrounding the fragile US-Iran ceasefire and ongoing concerns over the Strait of Hormuz have also underpinned safe-haven demand for the greenback. On the domestic side, markets have tempered expectations for further RBA tightening, reducing one source of support for the Aussie. Meanwhile, investors are also monitoring Beijing’s latest efforts to tighten oversight of outbound investment and technology transfers, a move that reinforces China’s focus on economic self-reliance and could have implications for future trade and investment flows across the region. More broadly, the AUD continues to take direction from China’s growth outlook, commodity price dynamics—particularly iron ore—and evolving interest rate expectations between the RBA and the Fed.

 
Suggested reading

Are consumers ready for humanoid robots?, C. Criddle, Financial Times (May 29, 2026)

The AI Future we want, M. Murgia, Financial Times (May 31, 2026)


Any opinions, news, research, analyses, prices or other information ("information") contained on this Blog, constitutes marketing communication and it has not been prepared in accordance with legal requirements designed to promote the independence of investment research. Further, the information contained within this Blog does not contain (and should not be construed as containing) investment advice or an investment recommendation, or an offer of, or solicitation for, a transaction in any financial instrument. LMAX Group has not verified the accuracy or basis-in-fact of any claim or statement made by any third parties as comments for every Blog entry.

LMAX Group will not accept liability for any loss or damage, including without limitation to, any loss of profit, which may arise directly or indirectly from use of or reliance on such information. No representation or warranty is given as to the accuracy or completeness of the above information. While the produced information was obtained from sources deemed to be reliable, LMAX Group does not provide any guarantees about the reliability of such sources. Consequently any person acting on it does so entirely at his or her own risk. It is not a place to slander, use unacceptable language or to promote LMAX Group or any other FX and CFD provider and any such postings, excessive or unjust comments and attacks will not be allowed and will be removed from the site immediately.

Day Image
29th May 2026 | view in browser
Markets price peace but hedge the headline risk

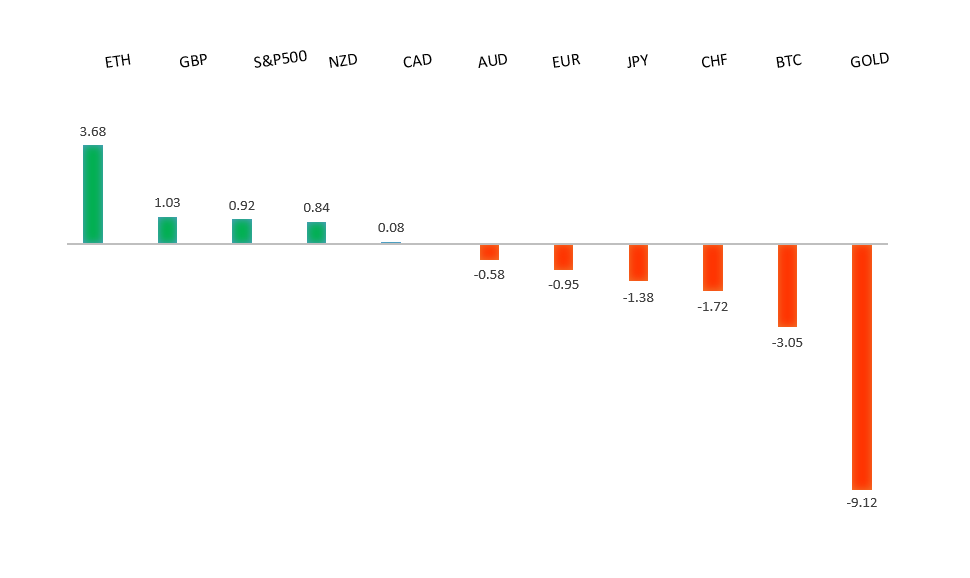
Markets remain broadly risk-positive on softer U.S. inflation and AI-led equity strength, but investors are staying cautious as unresolved U.S.-Iran negotiations, BOJ policy uncertainty, and geopolitical tensions continue to shape FX, commodities, and broader macro price action.


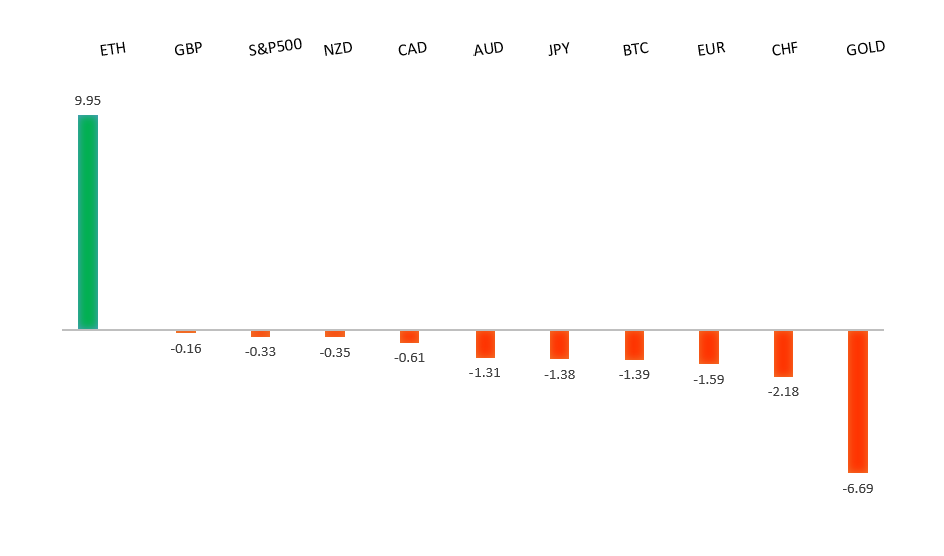
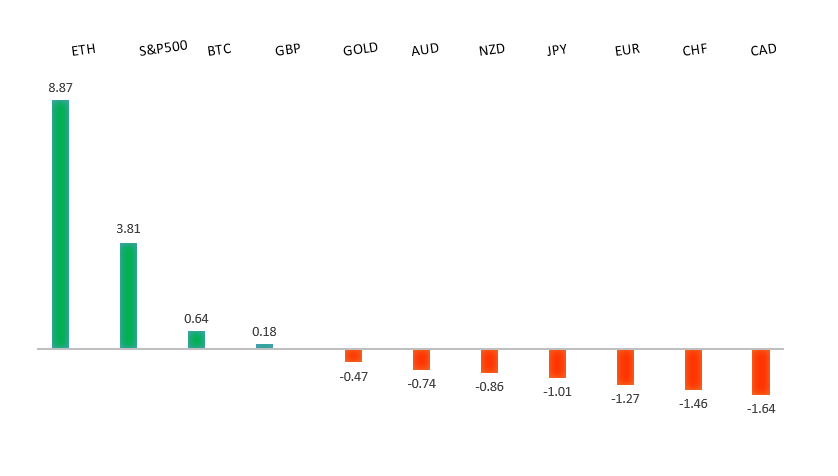
Performance chart 30day v. USD (%)
Performance Chart
 
 
Technical & fundamental highlights
EURUSD: technical overview

The Euro outlook remains constructive with higher lows sought out on dips in favor of the next major upside extension targeting the 2021 high at 1.2350. Setbacks should be exceptionally well supported ahead of 1.1300.

EURUSD Chart
R2 1.1797 - 6 May high - Medium
R1 1.1722 - 14 May high - Medium
S1 1.1576 - 21 May low - Medium
S2 1.1504 - 3 April low - Strong
EURUSD: fundamental overview

The euro remains well supported on a combination of improving risk sentiment, relative growth resilience, and a less negative rates outlook. Most recently, reports of progress toward a US-Iran agreement and an extension of the ceasefire have helped underpin broader risk appetite, encouraging demand for pro-cyclical currencies including the euro. At the same time, softer-than-expected monthly US core PCE inflation and signs of moderating US growth have reinforced expectations that the Federal Reserve will be able to adopt a less restrictive policy stance going forward, weighing on the US dollar. On the euro side, investors continue to draw support from expectations that the ECB is nearing the end of its easing cycle, while Germany’s fiscal expansion plans and increased European defense and infrastructure spending are seen as constructive for the medium-term growth outlook. The result has been a continuation of the favorable EURUSD dynamic, with dips attracting demand amid a still-broad trend of dollar weakness.

 
USDJPY: technical overview

There are signs of the formation of a meaningful top after the market put in a multi-year high in 2024. At this point, rallies should be well capped above 160.00 in favor of a fresh down-leg back towards the 2024 low at 139.58. Only a monthly close above 160.00 negates.

USDJPY Chart
R2 160.00 - Psychological - Strong
R1 159.66 - 28 May high - Medium
S1 158.59 - 20 May low - Medium
S2 157.29 - 14 May low - Medium
USDJPY: fundamental overview

Japan fundamentals remain mixed for the yen. On one hand, BoJ Governor Ueda’s recent remarks reinforced expectations that the central bank remains concerned about inflation becoming embedded through wages and inflation expectations, keeping the prospect of further policy normalization alive. However, the latest Tokyo CPI report complicated that narrative, with headline, core, and core-core inflation all slowing more than expected in May, reducing the urgency for a June rate hike and prompting some investors to push expectations toward a later move despite markets still assigning a relatively high probability of tightening in the months ahead. At the same time, stronger-than-expected April retail sales and industrial production data suggest domestic demand and manufacturing activity remain resilient, helping to offset concerns about the broader economy. The dominant driver of yen weakness continues to be the wide US-Japan rate differential, with US yields remaining elevated relative to JGB yields, while Japan’s dependence on imported energy leaves the economy vulnerable to higher oil prices and a weaker currency. Against this backdrop, intervention risks have become an increasingly important support factor, with USDJPY once again approaching the psychologically important ¥160 level. Market participants are awaiting official Ministry of Finance intervention data, with estimates suggesting authorities may have spent as much as ¥10 trillion defending the currency in late April and early May. While intervention fears may slow the pace of depreciation, investors generally view direct FX operations as a temporary tool rather than a lasting solution unless accompanied by a meaningful narrowing in US-Japan yield differentials through further BoJ tightening.

 
AUDUSD: technical overview

There are signs of the formation of a longer-term base with the market recovering out from a meaningful longer-term support zone. The latest monthly close back above 0.7000 takes the big picture pressure off the downside and strengthens the case for a bottom, with the focus now on a push towards 0.8000. Setbacks should now be well supported ahead of 0.6700.

AUDUSD Chart
R2 0.7278 - 6 May/2026 high - Strong
R1 0.7222 - 17 April high - Medium
S1 0.7079 - 19 May low - Medium
S2 0.6963 - 8 April low - Strong
AUDUSD: fundamental overview

The Australian dollar has been trading with a mixed fundamental backdrop, caught between shifting global risk sentiment and a material repricing of RBA expectations. Recent Australian inflation data surprised to the downside, with both monthly and annual CPI readings cooling faster than anticipated, prompting markets to sharply scale back expectations for additional RBA tightening. Following the data, the probability of a near-term rate hike was largely priced out, while expectations for further policy tightening later in the year were significantly reduced, undermining a key source of support for the currency. At the same time, escalating geopolitical tensions in the Middle East have weighed on broader risk appetite, typically a headwind for the risk-sensitive Australian dollar. However, intermittent bouts of US dollar weakness, driven by hopes of de-escalation in the region and evolving expectations around the US policy outlook, have helped cushion downside pressure. As a result, AUDUSD remains range-bound, with softer domestic inflation and a less hawkish RBA offsetting support from periods of improved global sentiment and US dollar consolidation.

 
Suggested reading

AI Can’t Pick Winning Funds. But It Can Avoid Bad Ones, L. Swedroe, Morningstar (May 28, 2026)

China’s Long March to Technological Supremacy, J. Rockstrom, Project Syndicate (May 27, 2026)


Any opinions, news, research, analyses, prices or other information ("information") contained on this Blog, constitutes marketing communication and it has not been prepared in accordance with legal requirements designed to promote the independence of investment research. Further, the information contained within this Blog does not contain (and should not be construed as containing) investment advice or an investment recommendation, or an offer of, or solicitation for, a transaction in any financial instrument. LMAX Group has not verified the accuracy or basis-in-fact of any claim or statement made by any third parties as comments for every Blog entry.

LMAX Group will not accept liability for any loss or damage, including without limitation to, any loss of profit, which may arise directly or indirectly from use of or reliance on such information. No representation or warranty is given as to the accuracy or completeness of the above information. While the produced information was obtained from sources deemed to be reliable, LMAX Group does not provide any guarantees about the reliability of such sources. Consequently any person acting on it does so entirely at his or her own risk. It is not a place to slander, use unacceptable language or to promote LMAX Group or any other FX and CFD provider and any such postings, excessive or unjust comments and attacks will not be allowed and will be removed from the site immediately.

Day Image
28th May 2026 | view in browser
Dollar up, gold down, nerves fraying

Markets remain dominated by the inflationary fallout from escalating US-Iran tensions, with higher oil prices and hawkish central bank rhetoric driving dollar strength, pressuring equities and gold, and reinforcing the higher-for-longer global rates narrative.


Performance chart 30day v. USD (%)
Performance Chart
 
 
Technical & fundamental highlights
EURUSD: technical overview

The Euro outlook remains constructive with higher lows sought out on dips in favor of the next major upside extension targeting the 2021 high at 1.2350. Setbacks should be exceptionally well supported ahead of 1.1300.

EURUSD Chart
R2 1.1797 - 6 May high - Medium
R1 1.1722 - 14 May high - Medium
S1 1.1576 - 21 May low - Medium
S2 1.1504 - 3 April low - Strong
EURUSD: fundamental overview

The Euro has come under renewed pressure amid a broader flight to safety after Iran retaliated against recent US strikes, with reports of attacks on US military bases and explosions near Bandar Abbas fueling concerns of a wider regional conflict and supporting demand for the US Dollar. The deterioration in risk sentiment has overshadowed what had otherwise been a constructive backdrop for the single currency, including improving Eurozone growth expectations and optimism around increased fiscal spending in Germany. At the same time, markets remain cautious ahead of key US PCE inflation data and Germany’s preliminary May HICP release, both of which could shape expectations for the Fed and ECB policy outlooks. ECB officials have continued to signal confidence that inflation is moving sustainably back toward target, reinforcing expectations the central bank is nearing the end of its easing cycle, though geopolitical tensions and softer global risk appetite are limiting Euro upside for now.

 
USDJPY: technical overview

There are signs of the formation of a meaningful top after the market put in a multi-year high in 2024. At this point, rallies should be well capped above 160.00 in favor of a fresh down-leg back towards the 2024 low at 139.58. Only a monthly close above 160.00 negates.

USDJPY Chart
R2 160.00 - Psychological - Strong
R1 159.66 - 28 May high - Medium
S1 158.59 - 20 May low - Medium
S2 157.29 - 14 May low - Medium
USDJPY: fundamental overview

The Yen has remained caught between increasingly hawkish Bank of Japan expectations and still-powerful external headwinds. BoJ Governor Kazuo Ueda’s latest comments reinforced the view that policymakers are becoming more concerned that higher energy prices could feed into wages, inflation expectations, and broader price-setting behavior, keeping alive expectations for additional policy normalization in the months ahead. Recent inflation readings have continued to hold above the BoJ’s 2% target, while steady wage growth has strengthened the case for further rate hikes. However, Yen gains have been limited by Japan’s vulnerability to elevated oil prices, rising concerns about the domestic growth outlook, and persistently wide yield differentials with the United States, where Treasury yields remain comparatively attractive. On the external side, the Dollar has continued to draw support from resilient US economic data and a more hawkish repricing of Federal Reserve expectations, with markets scaling back the scope for easing amid sticky inflation and firm labor market conditions. Investors are now closely focused on upcoming Tokyo CPI data and US PCE inflation figures for further confirmation on the policy outlook for both the BoJ and the Fed, while rising geopolitical tensions and higher crude prices are also contributing to volatility.

 
AUDUSD: technical overview

There are signs of the formation of a longer-term base with the market recovering out from a meaningful longer-term support zone. The latest monthly close back above 0.7000 takes the big picture pressure off the downside and strengthens the case for a bottom, with the focus now on a push towards 0.8000. Setbacks should now be well supported ahead of 0.6700.

AUDUSD Chart
R2 0.7278 - 6 May/2026 high - Strong
R1 0.7222 - 17 April high - Medium
S1 0.7079 - 19 May low - Medium
S2 0.6963 - 8 April low - Strong
AUDUSD: fundamental overview

The Australian dollar has come under renewed pressure as softer domestic data has prompted markets to scale back expectations for additional RBA tightening, particularly following weaker labor market readings and a moderation in headline inflation. While underlying price pressures remain sticky, investors increasingly believe the RBA may be nearing the end of its hiking cycle as slowing growth and easing demand begin to weigh on the economy. At the same time, heightened geopolitical tensions in the Middle East and the resulting surge in energy prices have fueled broader risk aversion and supported the US dollar and Japanese yen at the expense of higher-beta currencies like the Aussie. Concerns over slower Chinese growth – a key driver for Australia’s commodity-linked economy – have also limited AUD upside, despite some support from resilient metals demand and relatively elevated Australian yields. Meanwhile, hawkish Bank of Japan rhetoric and lingering fears of Japanese FX intervention have added further downside pressure.

 
Suggested reading

Why Double Digit Earnings Growth Won’t Stop the Bear, M. Hulbert, Marketwatch (May 27, 2026)

If Expectations Aren’t Met, It’s Long Way Down, J. Calhoun, Alhambra (May 25, 2026)


Any opinions, news, research, analyses, prices or other information ("information") contained on this Blog, constitutes marketing communication and it has not been prepared in accordance with legal requirements designed to promote the independence of investment research. Further, the information contained within this Blog does not contain (and should not be construed as containing) investment advice or an investment recommendation, or an offer of, or solicitation for, a transaction in any financial instrument. LMAX Group has not verified the accuracy or basis-in-fact of any claim or statement made by any third parties as comments for every Blog entry.

LMAX Group will not accept liability for any loss or damage, including without limitation to, any loss of profit, which may arise directly or indirectly from use of or reliance on such information. No representation or warranty is given as to the accuracy or completeness of the above information. While the produced information was obtained from sources deemed to be reliable, LMAX Group does not provide any guarantees about the reliability of such sources. Consequently any person acting on it does so entirely at his or her own risk. It is not a place to slander, use unacceptable language or to promote LMAX Group or any other FX and CFD provider and any such postings, excessive or unjust comments and attacks will not be allowed and will be removed from the site immediately.

Day Image
27th May 2026 | view in browser
AI euphoria and easing yields keep bulls in control

Markets are trading with a broadly constructive risk tone as easing bond yields, relentless AI-driven equity momentum, and optimism around a potential US-Iran diplomatic framework continue to outweigh geopolitical uncertainty and lingering inflation concerns.


Performance chart 30day v. USD (%)
Performance Chart
 
 
Technical & fundamental highlights
EURUSD: technical overview

The Euro outlook remains constructive with higher lows sought out on dips in favor of the next major upside extension targeting the 2021 high at 1.2350. Setbacks should be exceptionally well supported ahead of 1.1300.

EURUSD Chart
R2 1.1797 - 6 May high - Medium
R1 1.1722 - 14 May high - Medium
S1 1.1576 - 21 May low - Medium
S2 1.1504 - 3 April low - Strong
EURUSD: fundamental overview

The euro has remained well supported against the dollar, with EURUSD extending gains toward the mid-1.16s as a combination of improving global risk sentiment and a relatively hawkish ECB backdrop continues to underpin the single currency. Optimism surrounding a potential US-Iran agreement and reduced fears over disruption through the Strait of Hormuz have weighed on traditional safe-haven demand for the dollar, while broader market sentiment has improved amid easing geopolitical risk premiums. At the same time, ECB officials have continued to reinforce a comparatively firm inflation stance, with policymakers including Francois Villeroy de Galhau and Isabel Schnabel stressing the need to preserve the ECB’s inflation-fighting credibility and warning that energy-related second-round effects could keep price pressures elevated. Markets have subsequently scaled back expectations for aggressive ECB easing, helping support euro rate differentials. The move higher in EURUSD has also been aided by growing concerns over the US fiscal outlook and expectations that the Federal Reserve is moving closer to a more dovish policy pivot later this year as US growth momentum softens and inflation gradually moderates.

 
USDJPY: technical overview

There are signs of the formation of a meaningful top after the market put in a multi-year high in 2024. At this point, rallies should be well capped above 160.00 in favor of a fresh down-leg back towards the 2024 low at 139.58. Only a monthly close above 160.00 negates.

USDJPY Chart
R2 160.00 - Psychological - Strong
R1 159.50 - Mid-Figure - Medium
S1 158.59 - 20 May low - Medium
S2 157.29 - 14 May low - Medium
USDJPY: fundamental overview

The Japanese Yen has been driven primarily by a combination of rising expectations for further Bank of Japan tightening, intervention fears, and ongoing geopolitical uncertainty tied to the Middle East. Recent hawkish remarks from BoJ Deputy Governor Ryozo Himino and Governor Kazuo Ueda reinforced the view that the BoJ remains on a gradual rate-hike path as policymakers grow increasingly concerned that higher energy prices could fuel broader inflation pressures in Japan. At the same time, traders remain cautious about pushing USDJPY materially above the 160 level amid speculation Japanese authorities could step in again to support the currency following suspected intervention earlier this month. However, the Yen’s upside continues to be capped by concerns that prolonged disruptions to Middle East energy supplies would disproportionately hurt Japan’s import-dependent economy and worsen the domestic growth outlook. Meanwhile, elevated US yields, lingering safe-haven demand for the Dollar amid the Iran conflict, and market expectations that the Federal Reserve will keep policy restrictive into 2026 have continued to underpin the USD and limit deeper downside in USDJPY despite the more hawkish BoJ backdrop.

 
AUDUSD: technical overview

There are signs of the formation of a longer-term base with the market recovering out from a meaningful longer-term support zone. The latest monthly close back above 0.7000 takes the big picture pressure off the downside and strengthens the case for a bottom, with the focus now on a push towards 0.8000. Setbacks should now be well supported ahead of 0.6700.

AUDUSD Chart
R2 0.7278 - 6 May/2026 high - Strong
R1 0.7222 - 17 April high - Medium
S1 0.7079 - 19 May low - Medium
S2 0.6963 - 8 April low - Strong
AUDUSD: fundamental overview

The Australian dollar has been driven primarily by shifting RBA expectations, softer inflation data, and ongoing swings in global risk sentiment tied to China and the Middle East. Australia’s April CPI slowed more than expected, with headline inflation easing to 4.2% y/y from 4.6%, while monthly prices unexpectedly fell as fuel costs retreated following March’s surge, reinforcing market expectations that the RBA is likely to pause after already delivering three rate hikes this year. At the same time, underlying inflation remains sticky, with trimmed-mean CPI edging up to 3.4%, suggesting the Bank will retain a cautious tightening bias even as slowing labor market conditions — including a rise in unemployment to 4.5% — argue for patience. Externally, the AUD continues to trade as a proxy for global growth and commodity demand, with resilient iron ore imports into China and firmer commodity prices offering support, although concerns around weaker Chinese steel production and broader China growth risks remain a headwind. Meanwhile, volatility surrounding the Iran conflict and energy markets has added another layer of uncertainty for the currency through its impact on global risk appetite and commodity prices.

 
Suggested reading

For Michael Burry, This Time Is Different Once Again, J. Remsburg, InvestorPlace (May 23, 2026)

Higher Rates, More Renovation, T. Slok, Apollo (May 23, 2026)


Any opinions, news, research, analyses, prices or other information ("information") contained on this Blog, constitutes marketing communication and it has not been prepared in accordance with legal requirements designed to promote the independence of investment research. Further, the information contained within this Blog does not contain (and should not be construed as containing) investment advice or an investment recommendation, or an offer of, or solicitation for, a transaction in any financial instrument. LMAX Group has not verified the accuracy or basis-in-fact of any claim or statement made by any third parties as comments for every Blog entry.

LMAX Group will not accept liability for any loss or damage, including without limitation to, any loss of profit, which may arise directly or indirectly from use of or reliance on such information. No representation or warranty is given as to the accuracy or completeness of the above information. While the produced information was obtained from sources deemed to be reliable, LMAX Group does not provide any guarantees about the reliability of such sources. Consequently any person acting on it does so entirely at his or her own risk. It is not a place to slander, use unacceptable language or to promote LMAX Group or any other FX and CFD provider and any such postings, excessive or unjust comments and attacks will not be allowed and will be removed from the site immediately.

Day Image
26th May 2026 | view in browser
Diplomacy keeps the macro panic contained

Markets are cautiously stabilizing as investors increasingly price a managed diplomatic resolution to the Iran-Hormuz conflict, driving a pullback in oil and haven assets while leaving FX and equities trading in a more measured risk-sensitive environment.


Performance chart 30day v. USD (%)
Performance Chart
 
 
Technical & fundamental highlights
EURUSD: technical overview

The Euro outlook remains constructive with higher lows sought out on dips in favor of the next major upside extension targeting the 2021 high at 1.2350. Setbacks should be exceptionally well supported ahead of 1.1300.

EURUSD Chart
R2 1.1797 - 6 May high - Medium
R1 1.1722 - 14 May high - Medium
S1 1.1576 - 21 May low - Medium
S2 1.1504 - 3 April low - Strong
EURUSD: fundamental overview

The euro has come under modest pressure in recent trade as renewed uncertainty around the fragile US-Iran ceasefire has driven a broader safe-haven bid into the US dollar. Reports that US forces carried out defensive strikes in southern Iran after ceasefire violations have kept markets cautious, while concerns over the Strait of Hormuz and broader Middle East energy security continue to cloud sentiment. At the same time, the euro has found some underlying support from a more hawkish shift at the ECB, as policymakers increasingly acknowledge that the latest energy shock risks prolonging inflation pressures across the Eurozone. ECB officials including Isabel Schnabel have argued that “looking through” another inflation spike is no longer an option, warning that rising energy costs are beginning to spill over into the wider consumption basket even as growth risks deteriorate. Markets have consequently moved to price a high probability of another ECB rate hike, helping to offset some of the euro’s geopolitical-driven weakness.

 
USDJPY: technical overview

There are signs of the formation of a meaningful top after the market put in a multi-year high in 2024. At this point, rallies should be well capped above 160.00 in favor of a fresh down-leg back towards the 2024 low at 139.58. Only a monthly close above 160.00 negates.

USDJPY Chart
R2 159.53 - 17 April low - Medium
R1 159.36 - 21 May high - Medium
S1 157.29 - 14 May low - Medium
S2 155.02 - 6 May low - Strong
USDJPY: fundamental overview

The yen has remained under pressure against the dollar as a combination of external and domestic fundamentals continues to favor the greenback. Heightened geopolitical uncertainty surrounding the Middle East has undercut the traditional safe-haven appeal of the yen, with markets increasingly focused on the negative implications of elevated energy prices and supply disruptions for Japan’s import-dependent economy. At the same time, the dollar has found renewed support from resilient US economic data and persistent inflation, reinforcing expectations that the Fed will keep rates higher for longer. On the domestic side, while BOJ Deputy Governor Himino reiterated that the Bank of Japan still intends to continue raising rates and gradually normalize policy, he stressed that the timing and pace of tightening would depend heavily on how Middle East developments affect Japan’s economy and inflation outlook. That conditional approach has tempered expectations for aggressive BOJ tightening, especially as policymakers remain cautious about financial conditions and bond market stability. Markets also remain alert to the risk of official FX intervention should yen weakness accelerate further beyond current levels.

 
AUDUSD: technical overview

There are signs of the formation of a longer-term base with the market recovering out from a meaningful longer-term support zone. The latest monthly close back above 0.7000 takes the big picture pressure off the downside and strengthens the case for a bottom, with the focus now on a push towards 0.8000. Setbacks should now be well supported ahead of 0.6700.

AUDUSD Chart
R2 0.7278 - 6 May/2026 high - Strong
R1 0.7222 - 17 April high - Medium
S1 0.7079 - 19 May low - Medium
S2 0.6963 - 8 April low - Strong
AUDUSD: fundamental overview

The Australian Dollar has come under renewed pressure amid a broader deterioration in global risk sentiment following fresh US military strikes on southern Iran. The escalation in geopolitical tensions has supported safe-haven demand for the US Dollar and weighed on risk-sensitive currencies like the Aussie, particularly given Australia’s close exposure to global growth and commodity demand dynamics. At the same time, markets remain cautious ahead of Australia’s April CPI report, where headline inflation is expected to ease modestly from 4.6% YoY to 4.4%, though any upside surprise could revive expectations that the RBA will need to maintain a relatively hawkish policy stance for longer. More broadly, the AUD has also been influenced by shifting China sentiment and commodity price dynamics, with investors continuing to monitor the outlook for Chinese demand, iron ore prices, and the trajectory of US yields, all of which remain key external drivers for the Australian currency.

 
Suggested reading

What’s Not to Like About Rising Bond Yields?, S. Kirchner, Institutional Economics (May 23, 2026)

Making a Case for Bond Yields Entering the Danger Zone, R. Forsyth, Barron’s (May 22, 2026)


Any opinions, news, research, analyses, prices or other information ("information") contained on this Blog, constitutes marketing communication and it has not been prepared in accordance with legal requirements designed to promote the independence of investment research. Further, the information contained within this Blog does not contain (and should not be construed as containing) investment advice or an investment recommendation, or an offer of, or solicitation for, a transaction in any financial instrument. LMAX Group has not verified the accuracy or basis-in-fact of any claim or statement made by any third parties as comments for every Blog entry.

LMAX Group will not accept liability for any loss or damage, including without limitation to, any loss of profit, which may arise directly or indirectly from use of or reliance on such information. No representation or warranty is given as to the accuracy or completeness of the above information. While the produced information was obtained from sources deemed to be reliable, LMAX Group does not provide any guarantees about the reliability of such sources. Consequently any person acting on it does so entirely at his or her own risk. It is not a place to slander, use unacceptable language or to promote LMAX Group or any other FX and CFD provider and any such postings, excessive or unjust comments and attacks will not be allowed and will be removed from the site immediately.

Day Image
25th May 2026 | view in browser
Markets lean into Hormuz relief trade amid thin holiday liquidity

Markets are starting the week in a thin-liquidity, holiday-shortened relief rally driven by optimism around a potential US-Iran deal easing Hormuz tensions, pushing oil and the dollar lower while lifting global equities, risk FX and broader sentiment despite lingering geopolitical uncertainty.


Performance chart 30day v. USD (%)
Performance Chart
 
 
Technical & fundamental highlights
EURUSD: technical overview

The Euro outlook remains constructive with higher lows sought out on dips in favor of the next major upside extension targeting the 2021 high at 1.2350. Setbacks should be exceptionally well supported ahead of 1.1300.

EURUSD Chart
R2 1.1797 - 6 May high - Medium
R1 1.1722 - 14 May high - Medium
S1 1.1576 - 21 May low - Medium
S2 1.1504 - 3 April low - Strong
EURUSD: fundamental overview

The euro has remained underpinned against the US dollar, with EURUSD holding firm near the mid-1.16s as a combination of softer US dollar sentiment and relatively resilient Eurozone fundamentals continues to support the single currency. A key driver at the start of the week has been improving global risk appetite following comments from US President Donald Trump suggesting a US-Iran agreement is “largely negotiated,” fueling hopes of lower geopolitical tensions and helping trigger a sharp decline in oil prices. The move lower in energy prices has weighed on the dollar by encouraging markets to modestly scale back hawkish Federal Reserve expectations, while broader risk-on flows have further reduced demand for traditional safe havens. At the same time, ECB rhetoric has continued to lean relatively firm, with policymakers increasingly acknowledging the risk of renewed inflation pressures and signaling that the easing cycle may be nearing its end. Comments from ECB officials, including Belgium’s Pierre Wunsch warning that the Eurozone may be at the “beginning of an inflation problem,” have helped reinforce expectations that rates in Europe could remain restrictive for longer than previously assumed. More broadly, narrowing US-Eurozone rate differentials, persistent concerns over the US fiscal outlook, and continued reserve diversification away from the dollar have also contributed to ongoing structural support for the euro.

 
USDJPY: technical overview

There are signs of the formation of a meaningful top after the market put in a multi-year high in 2024. At this point, rallies should be well capped above 160.00 in favor of a fresh down-leg back towards the 2024 low at 139.58. Only a monthly close above 160.00 negates.

USDJPY Chart
R2 159.53 - 17 April low - Medium
R1 159.36 - 21 May high - Medium
S1 157.29 - 14 May low - Medium
S2 155.02 - 6 May low - Strong
USDJPY: fundamental overview

The yen has found renewed support in recent sessions, with USDJPY pulling back as easing geopolitical tensions in the Middle East helped drive oil prices lower, improving Japan’s terms of trade given the country’s heavy reliance on imported energy. Reports pointing toward progress on a potential US-Iran agreement and a reopening of the Strait of Hormuz have reduced immediate supply concerns and weighed on the dollar’s safe-haven appeal. At the same time, markets remain highly sensitive to the risk of Japanese official intervention should USDJPY move back toward the 160 level, a threshold that previously triggered action from Tokyo earlier this year. On the domestic side, softer Japanese inflation data has tempered expectations for near-term Bank of Japan tightening, though underlying resilience in the economy and the prospect of gradually rising wages continue to support expectations that the BoJ will maintain a slow normalization path. Meanwhile, the broader dollar outlook remains mixed, as sticky US inflation has led markets to scale back expectations for Fed easing, limiting the extent of yen appreciation despite the recent improvement in risk sentiment.

 
AUDUSD: technical overview

There are signs of the formation of a longer-term base with the market recovering out from a meaningful longer-term support zone. The latest monthly close back above 0.7000 takes the big picture pressure off the downside and strengthens the case for a bottom, with the focus now on a push towards 0.8000. Setbacks should now be well supported ahead of 0.6700.

AUDUSD Chart
R2 0.7300 - Figure - Medium
R1 0.7278 - 6 May/2026 high - Medium
S1 0.7079 - 19 May low - Medium
S2 0.6963 - 8 April low - Strong
AUDUSD: fundamental overview

The Australian dollar has been supported at the start of the week by an improvement in broader market risk sentiment, with optimism surrounding a potential US-Iran peace agreement weighing on the safe-haven US dollar and helping AUDUSD recover from last week’s lows. At the same time, the move higher in the Aussie has remained measured as investors continue to balance improving global sentiment against lingering geopolitical uncertainty, particularly around the Strait of Hormuz and Iran’s nuclear program. The currency has also continued to draw underlying support from Australia’s close correlation with global growth expectations and commodity demand, especially from China, though gains have been tempered by expectations that the Federal Reserve could still keep rates elevated for longer if US inflation remains sticky. Overall, the AUD remains caught between improving risk appetite and resilient US yield support, limiting the scope for a more aggressive upside move.

 
Suggested reading

What Are Rising Interest Rates Telling Us?, B. Carlson, AWOCS (May 22, 2026)

Real Yields Near 20-Year Highs, J. Picerno, The Capital Spectator (May 20, 2026)


Any opinions, news, research, analyses, prices or other information ("information") contained on this Blog, constitutes marketing communication and it has not been prepared in accordance with legal requirements designed to promote the independence of investment research. Further, the information contained within this Blog does not contain (and should not be construed as containing) investment advice or an investment recommendation, or an offer of, or solicitation for, a transaction in any financial instrument. LMAX Group has not verified the accuracy or basis-in-fact of any claim or statement made by any third parties as comments for every Blog entry.

LMAX Group will not accept liability for any loss or damage, including without limitation to, any loss of profit, which may arise directly or indirectly from use of or reliance on such information. No representation or warranty is given as to the accuracy or completeness of the above information. While the produced information was obtained from sources deemed to be reliable, LMAX Group does not provide any guarantees about the reliability of such sources. Consequently any person acting on it does so entirely at his or her own risk. It is not a place to slander, use unacceptable language or to promote LMAX Group or any other FX and CFD provider and any such postings, excessive or unjust comments and attacks will not be allowed and will be removed from the site immediately.

Day Image
21st May 2026 | view in browser
Risk appetite masks global divergence

Markets remain broadly supported by AI-driven US equity optimism and softer US yields, but beneath the surface investors are navigating increasingly divergent central bank paths, weakening Asian growth signals, and rising geopolitical risks.


Performance chart 30day v. USD (%)
Performance Chart
 
 
Technical & fundamental highlights
EURUSD: technical overview

The Euro outlook remains constructive with higher lows sought out on dips in favor of the next major upside extension targeting the 2021 high at 1.2350. Setbacks should be exceptionally well supported ahead of 1.1300.

EURUSD Chart
R2 1.1797 - 6 May high - Medium
R1 1.1722 - 14 May high - Medium
S1 1.1583 - 20 May low - Medium
S2 1.1504 - 3 April low - Strong
EURUSD: fundamental overview

The euro has remained underpinned by a still constructive ECB policy outlook and improving regional data expectations, although gains against the dollar have stalled near the 1.16 area amid a renewed bid for USD safety. Markets continue to price a relatively cautious easing cycle from the ECB, with recent Reuters polling showing a growing majority of economists expecting another 25bp rate increase in June to 2.25%, reflecting concerns that Eurozone inflation pressures remain sticky enough to warrant further restraint. At the same time, preliminary May PMI releases from Germany and the broader Eurozone are in focus for signs that activity momentum is stabilizing after a soft start to the year, particularly in services. However, broader geopolitical tensions and a more hawkish Fed narrative have tempered euro upside. Escalating rhetoric surrounding US-Iran negotiations has supported safe-haven demand for the dollar, while the latest Fed minutes reinforced expectations that US rates may need to stay restrictive for longer should inflation remain persistent. The widening contrast between resilient US yields and still fragile Eurozone growth dynamics has limited EURUSD follow-through despite relatively firm ECB expectations.

 
USDJPY: technical overview

There are signs of the formation of a meaningful top after the market put in a multi-year high in 2024. At this point, rallies should be well capped above 160.00 in favor of a fresh down-leg back towards the 2024 low at 139.58. Only a monthly close above 160.00 negates.

USDJPY Chart
R2 159.53 - 17 April low - Medium
R1 159.25 - 19 May high - Medium
S1 157.29 - 14 May low - Medium
S2 155.02 - 6 May low - Strong
USDJPY: fundamental overview

The yen remains caught between increasingly hawkish Bank of Japan expectations and rising concerns over Japan’s growth and fiscal outlook. BOJ board member Koeda delivered one of the clearest tightening signals yet, arguing that underlying inflation is already around 2% and warning that persistent Middle East-driven energy pressures risk pushing it higher, reinforcing expectations that the BOJ could continue normalizing policy as soon as June. Markets have also focused on Koeda’s argument that keeping rates too low risks further distortions from deeply negative real interest rates, a notable shift toward a more proactive inflation-fighting stance. At the same time, Japan’s latest PMI data highlighted an increasingly uncomfortable mix of slowing activity and intensifying price pressures, with services activity stalling while selling price inflation accelerated to the strongest pace in nearly 19 years. Trade data added to the stagflationary undertone: although April exports beat expectations and produced a surprise trade surplus, the improvement was flattered by a historic collapse in crude oil imports amid Middle East supply disruption, raising concerns that higher energy costs and wider trade deficits will emerge in coming months. Meanwhile, rising fiscal worries tied to discussion of additional stimulus spending and multi-decade highs in JGB yields have added another layer of pressure on the yen, leaving USDJPY driven by the tension between a more hawkish BOJ on one side and deteriorating growth, energy shock risks and fiscal concerns on the other.

 
AUDUSD: technical overview

There are signs of the formation of a longer-term base with the market recovering out from a meaningful longer-term support zone. The latest monthly close back above 0.7000 takes the big picture pressure off the downside and strengthens the case for a bottom, with the focus now on a push towards 0.8000. Setbacks should now be well supported ahead of 0.6700.

AUDUSD Chart
R2 0.7300 - Figure - Medium
R1 0.7278 - 6 May/2026 high - Medium
S1 0.7079 - 19 May low - Medium
S2 0.6963 - 8 April low - Strong
AUDUSD: fundamental overview

The Australian Dollar has come under renewed pressure as a sharp deterioration in domestic data has reinforced expectations that the Reserve Bank of Australia will pause its tightening cycle, or potentially begin discussing eventual easing if labor market weakness deepens. April employment unexpectedly fell by 18.6k against expectations for a 17.5k increase, while the unemployment rate climbed to 4.5%, its highest level since late 2021 and above the RBA’s own forecast trajectory. The weakness was broad-based across both full- and part-time employment, while youth unemployment moved above 11%, historically an early warning signal for wider economic slowing. At the same time, May flash PMI data pointed to a rapid loss of momentum in activity, with services slipping back into contraction territory and business confidence falling toward pandemic-era lows. The softer domestic backdrop has seen markets scale back RBA hike expectations, weighing on yield support for the AUD. Externally, the currency has also been pressured by a firmer US Dollar amid renewed geopolitical tension surrounding US-Iran negotiations and risks to Middle East energy supply routes, although elevated commodity and energy prices continue to provide some offsetting support for Australia’s terms of trade.

 
Suggested reading

All New Highs Are Not Created Equal, J. Parets, Trend Labs (May 18, 2026)

Bonds Are Behaving Just Like…Bonds, J. Wiggins, Behavioral Investment (May 19, 2026)


Any opinions, news, research, analyses, prices or other information ("information") contained on this Blog, constitutes marketing communication and it has not been prepared in accordance with legal requirements designed to promote the independence of investment research. Further, the information contained within this Blog does not contain (and should not be construed as containing) investment advice or an investment recommendation, or an offer of, or solicitation for, a transaction in any financial instrument. LMAX Group has not verified the accuracy or basis-in-fact of any claim or statement made by any third parties as comments for every Blog entry.

LMAX Group will not accept liability for any loss or damage, including without limitation to, any loss of profit, which may arise directly or indirectly from use of or reliance on such information. No representation or warranty is given as to the accuracy or completeness of the above information. While the produced information was obtained from sources deemed to be reliable, LMAX Group does not provide any guarantees about the reliability of such sources. Consequently any person acting on it does so entirely at his or her own risk. It is not a place to slander, use unacceptable language or to promote LMAX Group or any other FX and CFD provider and any such postings, excessive or unjust comments and attacks will not be allowed and will be removed from the site immediately.

Day Image
20th May 2026 | view in browser
Caught between war risk and rate risk

Markets remain dominated by the inflationary implications of the Iran-Hormuz crisis, with surging oil prices, rising global yields, hawkish central bank repricing and persistent geopolitical uncertainty driving defensive positioning across FX, equities and commodities.


Performance chart 30day v. USD (%)
Performance Chart
 
 
Technical & fundamental highlights
EURUSD: technical overview

The Euro outlook remains constructive with higher lows sought out on dips in favor of the next major upside extension targeting the 2021 high at 1.2350. Setbacks should be exceptionally well supported ahead of 1.1300.

EURUSD Chart
R2 1.1797 - 6 May high - Medium
R1 1.1722 - 14 May high - Medium
S1 1.1589 - 8 April low - Medium
S2 1.1504 - 3 April low - Strong
EURUSD: fundamental overview

The euro remains under pressure after Tuesday’s bearish session pushed the single currency to its weakest levels since April, as investors continue to favor the dollar amid rising US yields and a deteriorating global risk backdrop. Market sentiment has turned increasingly defensive on fears that tensions in the Middle East could escalate again if Iran fails to reach a deal with the United States, boosting safe-haven demand for the greenback. At the same time, US Treasury yields have surged, with the 10-year yield climbing to fresh multi-year highs as markets further scale back expectations for Federal Reserve rate cuts this year following resilient US economic data and persistent inflation concerns. While the euro has found some underlying support from signs of easing transatlantic trade tensions after the EU moved closer to ratifying its trade accord with the US, helping reduce risks of a broader tariff conflict, the positive impact has so far been overshadowed by widening US-Eurozone rate differentials and softer sentiment toward European assets. Investors are now looking ahead to the upcoming FOMC minutes and May flash PMI data from both the Eurozone and the US for further direction on relative growth and policy expectations.

 
USDJPY: technical overview

There are signs of the formation of a meaningful top after the market put in a multi-year high in 2024. At this point, rallies should be well capped above 160.00 in favor of a fresh down-leg back towards the 2024 low at 139.58. Only a monthly close above 160.00 negates.

USDJPY Chart
R2 159.53 - 17 April low - Medium
R1 159.25 - 19 May high - Medium
S1 157.29 - 14 May low - Medium
S2 155.02 - 6 May low - Strong
USDJPY: fundamental overview

The yen has found some near-term support after Japan’s economy surprised to the upside in Q1, with GDP expanding at an annualized 2.1% pace and reinforcing expectations that the BOJ will continue gradually normalizing policy. At the same time, growing concern over official intervention has helped slow the pace of JPY weakness as USDJPY approaches the psychologically important 160 level, with Finance Minister Katayama reiterating that authorities stand ready to respond to excessive FX volatility and markets suspecting Tokyo already intervened aggressively earlier this spring. More broadly, improving domestic fundamentals are beginning to shift sentiment around the yen, with one major US bank upgrading its view to neutral from bearish while citing rising Japanese real rates, stronger Japanese equity performance, and improving structural capital flow dynamics as medium-term supportive factors. That said, the yen continues to face a significant headwind from wide US-Japan rate differentials as resilient US inflation and elevated energy prices reinforce a higher-for-longer Fed outlook, keeping US yields elevated and preserving the attractiveness of dollar assets relative to Japan.

 
AUDUSD: technical overview

There are signs of the formation of a longer-term base with the market recovering out from a meaningful longer-term support zone. The latest monthly close back above 0.7000 takes the big picture pressure off the downside and strengthens the case for a bottom, with the focus now on a push towards 0.8000. Setbacks should now be well supported ahead of 0.6700.

AUDUSD Chart
R2 0.7300 - Figure - Medium
R1 0.7278 - 6 May/2026 high - Medium
S1 0.7079 - 19 May low - Medium
S2 0.6963 - 8 April low - Strong
AUDUSD: fundamental overview

The Australian dollar has remained under pressure in recent sessions, with AUDUSD slipping back below 0.7100 as a resurgent US dollar, heightened geopolitical tensions in the Middle East, and rising oil prices have reinforced demand for safe-haven assets. Markets have increasingly priced in the risk that renewed conflict involving Iran could reignite global inflation pressures, prompting investors to scale back expectations for aggressive Fed easing and instead lean toward a more hawkish US rates outlook. While the RBA has maintained a relatively hawkish bias — with minutes showing most board members supported the May rate hike to 4.35% amid concerns that higher fuel costs could further lift inflation expectations — this has been outweighed by broader USD strength and risk aversion. At the same time, Australia’s close trade ties with China remain an important offsetting factor for the AUD, with sentiment supported somewhat by signs of improving US-China trade relations following the Kuala Lumpur framework agreement, including plans for reciprocal tariff reductions and large-scale Chinese purchases of US goods. Still, with China’s growth backdrop remaining uneven and the PBOC keeping policy settings unchanged, external risk sentiment and US rate dynamics continue to dominate near-term AUD direction.

 
Suggested reading

AI Is Penetrating Every Corner of Financial Markets, T. Slok, Apollo (May 18, 2026)

If the Consensus Is Wrong, Stocks Are Pricey, J. Calhoun, Alhambra (May 17, 2026)


Any opinions, news, research, analyses, prices or other information ("information") contained on this Blog, constitutes marketing communication and it has not been prepared in accordance with legal requirements designed to promote the independence of investment research. Further, the information contained within this Blog does not contain (and should not be construed as containing) investment advice or an investment recommendation, or an offer of, or solicitation for, a transaction in any financial instrument. LMAX Group has not verified the accuracy or basis-in-fact of any claim or statement made by any third parties as comments for every Blog entry.

LMAX Group will not accept liability for any loss or damage, including without limitation to, any loss of profit, which may arise directly or indirectly from use of or reliance on such information. No representation or warranty is given as to the accuracy or completeness of the above information. While the produced information was obtained from sources deemed to be reliable, LMAX Group does not provide any guarantees about the reliability of such sources. Consequently any person acting on it does so entirely at his or her own risk. It is not a place to slander, use unacceptable language or to promote LMAX Group or any other FX and CFD provider and any such postings, excessive or unjust comments and attacks will not be allowed and will be removed from the site immediately.

Day Image
19th May 2026 | view in browser
Headline risk keeps investors defensive

Global markets remain trapped in a fragile, headline-driven risk environment as persistent Middle East tensions keep oil prices elevated, US yields high, the dollar broadly supported, and investors increasingly defensive across FX, equities, and commodities.


Performance chart 30day v. USD (%)
Performance Chart
 
 
Technical & fundamental highlights
EURUSD: technical overview

The Euro outlook remains constructive with higher lows sought out on dips in favor of the next major upside extension targeting the 2021 high at 1.2350. Setbacks should be exceptionally well supported ahead of 1.1300.

EURUSD Chart
R2 1.1797 - 6 May high - Medium
R1 1.1722 - 14 May high - Medium
S1 1.1608 - 18 May low - Medium
S2 1.1589 - 8 April low - Strong
EURUSD: fundamental overview

The euro has come under renewed pressure, with EURUSD slipping back below 1.1650 as escalating uncertainty around Iran and the broader Middle East conflict continues to underpin safe-haven demand for the US dollar. While President Trump delayed a planned strike on Iran following requests from Gulf states including Saudi Arabia, Qatar and the UAE, markets remain cautious after warnings that military action could still proceed at short notice if negotiations fail. At the same time, the downside in the single currency has been cushioned by a more hawkish ECB backdrop, with policymakers increasingly signaling concern over sticky inflation and the risk of inflation expectations becoming entrenched. ECB Governing Council member Yannis Stournaras said a modest rate hike could help contain price pressures without materially damaging growth, while markets have moved to more fully price another 25bp ECB hike in June. The repricing higher in ECB rate expectations has helped limit euro losses even as geopolitical tensions and broader risk aversion continue to favor the dollar in the near term.

 
USDJPY: technical overview

There are signs of the formation of a meaningful top after the market put in a multi-year high in 2024. At this point, rallies should be well capped above 160.00 in favor of a fresh down-leg back towards the 2024 low at 139.58. Only a monthly close above 160.00 negates.

USDJPY Chart
R2 159.53 - 17 April low - Medium
R1 159.08 - 18 May high - Medium
S1 157.29 - 14 May low - Medium
S2 155.02 - 6 May low - Strong
USDJPY: fundamental overview

Japan’s Q1 GDP data offered the yen some fundamental support after growth surprised to the upside at 2.1% annualized, with consumption, capex and inflation metrics all beating expectations, reinforcing the view that the economy had entered the current geopolitical shock on relatively solid footing. However, the positive domestic backdrop has quickly been overshadowed by the fallout from the Iran conflict and the associated surge in energy prices, with Japan viewed as particularly vulnerable given its heavy dependence on Middle East oil imports. Markets have subsequently pared back expectations for near-term BOJ tightening, with concerns mounting that the central bank may be forced to delay further rate hikes if the energy shock tips Q2 growth into contraction despite still-elevated inflation pressures. At the same time, the yen continues to suffer under the weight of the wide US-Japan rate differential as Fed hawkishness and higher US Treasury yields keep demand for the dollar supported. Japanese officials have intensified intervention rhetoric as USDJPY moves back toward the 160 area, with Finance Minister Katayama reiterating that authorities stand ready to act against excessive FX volatility after an estimated ¥10 trillion of intervention since late April. Still, markets remain skeptical that unilateral intervention alone can sustainably reverse yen weakness absent a more meaningful shift in BOJ policy or a broader decline in US yields.

 
AUDUSD: technical overview

There are signs of the formation of a longer-term base with the market recovering out from a meaningful longer-term support zone. The latest monthly close back above 0.7000 takes the big picture pressure off the downside and strengthens the case for a bottom, with the focus now on a push towards 0.8000. Setbacks should now be well supported ahead of 0.6700.

AUDUSD Chart
R2 0.7300 - Figure - Medium
R1 0.7278 - 6 May/2026 high - Medium
S1 0.7101 - 30 April low - Medium
S2 0.6963 - 8 April low - Strong
AUDUSD: fundamental overview

The Australian Dollar remains under pressure as a resilient US Dollar and elevated global risk aversion continue to outweigh an increasingly hawkish Reserve Bank of Australia. While the latest RBA Minutes reinforced expectations for further tightening – revealing that eight of nine board members backed May’s hike to 4.35% amid concerns that energy-driven inflation and the Middle East conflict could de-anchor inflation expectations – the Aussie has struggled to benefit as markets instead gravitate toward the safe-haven USD. Investors remain focused on geopolitical uncertainty surrounding Iran and the Strait of Hormuz, with oil prices staying elevated and broader fears over global growth and trade-sensitive currencies weighing on sentiment toward the AUD. At the same time, firmer US data and persistent Fed hawkishness have revived expectations that US rates could remain higher for longer, further supporting the Greenback and narrowing the relative appeal of the Australian Dollar. Domestically, concerns are also building that tighter financial conditions and slowing Chinese demand could weigh on Australia’s growth outlook, even as sticky inflation keeps the RBA biased toward additional hikes later this year.

 
Suggested reading

The 4 Abilities You Need To Be A Successful Investor, B. Carlson, AWOC (May 15, 2026)

Don’t Be Someone Else’s Exit Liquidity, J. Parets, Trend Labs (May 15, 2026)


Any opinions, news, research, analyses, prices or other information ("information") contained on this Blog, constitutes marketing communication and it has not been prepared in accordance with legal requirements designed to promote the independence of investment research. Further, the information contained within this Blog does not contain (and should not be construed as containing) investment advice or an investment recommendation, or an offer of, or solicitation for, a transaction in any financial instrument. LMAX Group has not verified the accuracy or basis-in-fact of any claim or statement made by any third parties as comments for every Blog entry.

LMAX Group will not accept liability for any loss or damage, including without limitation to, any loss of profit, which may arise directly or indirectly from use of or reliance on such information. No representation or warranty is given as to the accuracy or completeness of the above information. While the produced information was obtained from sources deemed to be reliable, LMAX Group does not provide any guarantees about the reliability of such sources. Consequently any person acting on it does so entirely at his or her own risk. It is not a place to slander, use unacceptable language or to promote LMAX Group or any other FX and CFD provider and any such postings, excessive or unjust comments and attacks will not be allowed and will be removed from the site immediately.

Day Image
18th May 2026 | view in browser
Oil spike fuels inflation fears and higher yields

Global markets are under pressure as escalating geopolitical tensions drive an oil-led inflation shock, pushing yields higher, weighing on equities, and broadly supporting the dollar.


Performance chart 30day v. USD (%)
Performance Chart
 
 
Technical & fundamental highlights
EURUSD: technical overview

The Euro outlook remains constructive with higher lows sought out on dips in favor of the next major upside extension targeting the 2021 high at 1.2350. Setbacks should be exceptionally well supported ahead of 1.1300.

EURUSD Chart
R2 1.1797 - 6 May high - Medium
R1 1.1722 - 14 May high - Medium
S1 1.1600 - Figure - Medium
S2 1.1589 - 8 April low - Strong
EURUSD: fundamental overview

The Euro has been under pressure in recent sessions, with EURUSD drifting lower as the US Dollar strengthens on a combination of rising rate expectations and a more defensive global backdrop. Markets have repriced the path of Federal Reserve policy after a series of hawkish signals from officials stressing that inflation remains the dominant concern, with pricing for an additional rate hike jumping sharply. This widening policy divergence—at least in the near term—has tilted yield support back toward the Dollar. At the same time, elevated geopolitical tensions, including risks around the Strait of Hormuz and broader US-China frictions, have driven safe-haven demand into the Dollar, further weighing on the Euro. That said, downside in the single currency has been somewhat cushioned by expectations that the European Central Bank will also need to maintain a hawkish stance, with sticky inflation keeping the door open for further tightening, limiting the extent of EUR underperformance even as external headwinds persist.

 
USDJPY: technical overview

There are signs of the formation of a meaningful top after the market put in a multi-year high in 2024. At this point, rallies should be well capped above 160.00 in favor of a fresh down-leg back towards the 2024 low at 139.58. Only a monthly close above 160.00 negates.

USDJPY Chart
R2 159.53 - 17 April low - Medium
R1 159.08 - 18 May high - Medium
S1 157.29 - 14 May low - Medium
S2 155.02 - 6 May low - Strong
USDJPY: fundamental overview

The yen has come under renewed pressure, with USDJPY pushing back above 159 as a confluence of external and domestic fundamentals tilts decisively against the currency. The primary driver has been broad USD strength, underpinned by rising geopolitical tensions around Iran, which are reinforcing the dollar’s safe-haven appeal while simultaneously pushing oil prices higher and reviving global inflation risks. This dynamic has fed directly into more hawkish Fed expectations, with markets now pricing a meaningful probability of further tightening and US yields remaining elevated—widening rate differentials sharply in favor of the dollar. In contrast, the yen is failing to benefit from traditional risk-off flows, as Japan’s heavy reliance on imported energy leaves it particularly exposed to Middle East-driven oil shocks, worsening the domestic terms of trade and growth outlook. At the same time, the Bank of Japan remains far behind the Fed in policy normalization, limiting any yield support for the currency. While intermittent intervention fears from Japanese authorities are helping to slow, but not reverse, the move, they have so far proven insufficient against the powerful combination of USD strength, higher US yields, and Japan-specific vulnerability to the current geopolitical backdrop.

 
AUDUSD: technical overview

There are signs of the formation of a longer-term base with the market recovering out from a meaningful longer-term support zone. The latest monthly close back above 0.7000 takes the big picture pressure off the downside and strengthens the case for a bottom, with the focus now on a push towards 0.8000. Setbacks should now be well supported ahead of 0.6700.

AUDUSD Chart
R2 0.7300 - Figure - Medium
R1 0.7278 - 6 May/2026 high - Medium
S1 0.7101 - 30 April low - Medium
S2 0.6963 - 8 April low - Strong
AUDUSD: fundamental overview

The Australian Dollar remains under pressure, trading below 0.7150, primarily driven by a combination of weaker-than-expected Chinese data and a more supportive backdrop for the US Dollar. Disappointing activity indicators out of China—most notably soft Retail Sales, slower Industrial Production, and a contraction in Fixed Asset Investment—have reinforced concerns about demand from Australia’s largest trading partner, weighing directly on AUD sentiment. At the same time, the USD has found renewed strength as Federal Reserve officials continue to emphasize a higher-for-longer stance on interest rates, with markets sharply repricing the probability of additional tightening. This policy divergence is further amplified by rising geopolitical tensions, including US-Iran frictions and broader global uncertainty, which are boosting safe-haven flows into the Dollar. While higher oil prices could, in theory, support Australia via terms of trade, the dominant drivers at present remain China growth concerns and relative rate dynamics, keeping AUDUSD biased to the downside.

 
Suggested reading

A “Casino” Stock Market, B. Smead, Smead Capital Management (May 14, 2026)

Inflation’s Elevated No Matter How You Slice It, S. Varghese, Carson Group (May 13, 2026)


Any opinions, news, research, analyses, prices or other information ("information") contained on this Blog, constitutes marketing communication and it has not been prepared in accordance with legal requirements designed to promote the independence of investment research. Further, the information contained within this Blog does not contain (and should not be construed as containing) investment advice or an investment recommendation, or an offer of, or solicitation for, a transaction in any financial instrument. LMAX Group has not verified the accuracy or basis-in-fact of any claim or statement made by any third parties as comments for every Blog entry.

LMAX Group will not accept liability for any loss or damage, including without limitation to, any loss of profit, which may arise directly or indirectly from use of or reliance on such information. No representation or warranty is given as to the accuracy or completeness of the above information. While the produced information was obtained from sources deemed to be reliable, LMAX Group does not provide any guarantees about the reliability of such sources. Consequently any person acting on it does so entirely at his or her own risk. It is not a place to slander, use unacceptable language or to promote LMAX Group or any other FX and CFD provider and any such postings, excessive or unjust comments and attacks will not be allowed and will be removed from the site immediately.